
Figure 1
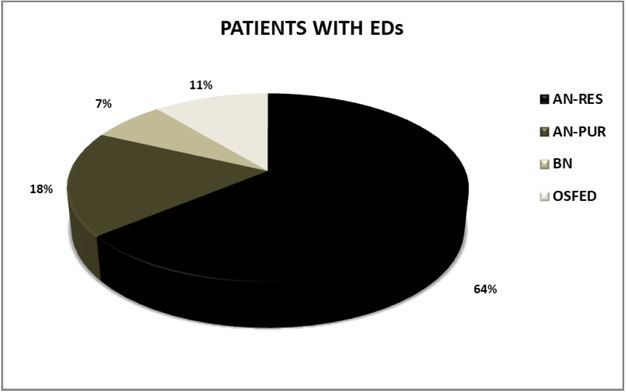
Different diagnoses of Eating Disorders. Percentage distribution of different subtypes of Eating Disorders in a population of 28 female patients. AN-RES (restrictive-type anorexia nervosa) in black, AN-PUR (purging-type anorexia nervosa) in dark grey, BN (bulimia nervosa) in light grey, and OSFED (other specified feeding or eating disorder) in white.
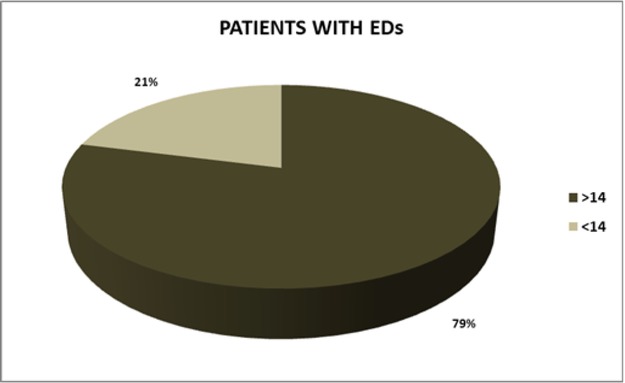
Figure 2
Patients with Eating Disorders divided by age. While 79% were over 14 years old, 21% were under 14 years old.
Table 1
Sociodemographic characteristics (age) and clinical characteristics (BMI, clinical manifestations in the skin, muscle and genitourinary tract) of all the patients in the study according to type of EDs.
| N° | Diagnoses | Age | BMI | Skin | Muscle | Genitourinary |
|---|---|---|---|---|---|---|
| 1 | AN-RES | 11 | 14,2 | pale-dehydrated | hypotrophic | no menarche |
| 2 | OSFED | 11 | 14,1 | hypotrophic | normotrophic-normotonic | secondary amenorrhea |
| 3 | AN-RES | 12 | 15,1 | hypertrophic-lanugo | hypotrophic | no menarche |
| 4 | AN-RES | 12 | 15,4 | pale-lanugo | hypotrophic-hypotonic | secondary amenorrhea |
| 5 | AN-RES | 12 | 15,6 | hypertrophic-lanugo | hypotrophic | secondary amenorrhea |
| 6 | AN-RES | 12 | 17,2 | normal | normotrophic-normotonic | no menarche |
| 7 | AN-RES | 15 | 13,8 | pale-normohydrated | normotrophic-normotonic | secondary amenorrhea |
| 8 | AN-RES | 15 | 14,4 | pale-lanugo | hypotonic | primary amenorrhea |
| 9 | AN-PUR | 16 | 14,3 | normal | hypotonic | regular menstrual cycle |
| 10 | AN-RES | 16 | 12,8 | pale-dehydrated | hypotrophic | secondary amenorrhea |
| 11 | AN-RES | 16 | 13,2 | pale-dehydrated | hypotrophic-hypotonic | secondary amenorrhea |
| 12 | AN-RES | 16 | 15,1 | hypotrophic | hypotrophic | primary amenorrhea |
| 13 | AN-RES | 16 | 15,2 | hypotrophic | hypotrophic | secondary amenorrhea |
| 14 | AN-PUR | 17 | 16,2 | pale-lanugo | hypotrophic | secondary amenorrhea |
| 15 | AN-RES | 19 | 13,5 | pale-dehydrated | hypotrophic-hypotonic | secondary amenorrhea |
| 16 | AN-RES | 19 | 13,6 | normal | normotrophic-normotonic | secondary amenorrhea |
| 17 | AN-RES | 19 | 13,7 | hypotrophic-lanugo | hypotrophic-hypotonic | secondary amenorrhea |
| 18 | AN-RES | 19 | 15,2 | hypotrophic-lanugo | hypotrophic | regular menstrual cycle |
| 19 | AN-RES | 20 | 14,7 | normal | hypotrophic | secondary amenorrhea |
| 20 | AN-RES | 20 | 15,1 | pale-lanugo | hypotrophic-hypotonic | secondary amenorrhea |
| 21 | OSFED | 23 | 17,1 | normal | normotrophic-normotonic | regular menstrual cycle |
| 22 | AN-PUR | 24 | 14,2 | hypotrophic-lanugo | hypotrophic | secondary amenorrhea |
| 23 | AN-RES | 29 | 15,1 | cyanosis | hypotrophic-hypotonic | secondary amenorrhea |
| 24 | BN | 29 | 15,7 | pale-dehydrated | hypotrophic-hypotonic | secondary amenorrhea |
| 25 | BN | 29 | 23,3 | normal | hypotonic (Bechet syndrome) | secondary amenorrhea |
| 26 | AN-PUR | 32 | 14,6 | normal | hypotrophic | secondary amenorrhea |
| 27 | AN-PUR | 32 | 16,0 | pale-dehydrated | normotrophic-normotonic | secondary amenorrhea |
| 28 | OSFED | 50 | 23,3 | normal | normotrophic-normotonic | regular menstrual cycle |
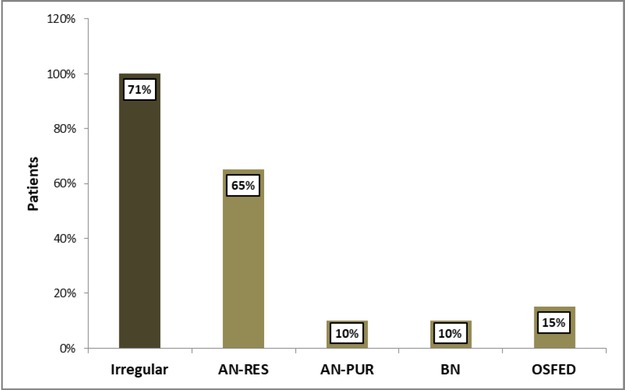
Figure 3
Percentage of patients with irregular blood count and procedure divided by type of EDs. AN-RES, restrictive-type anorexia nervosa, AN-PUR, purging-type anorexia nervosa, BN, bulimia nervosa, OSFED, other specified feeding or eating disorder.
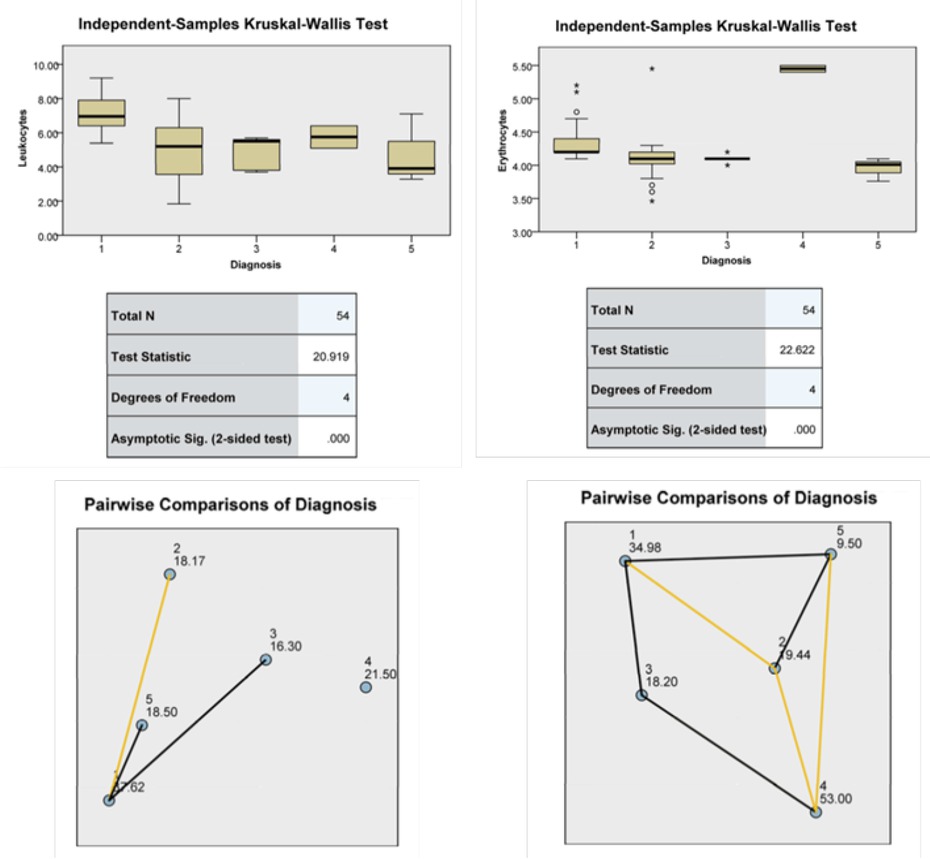
Figure 4
Statistical analysis using non-parametric Kruskal-Wallis: a) leukocytes levels and EDs types (number 1 CTR, number 2 AN-RES, number 3 AN-PUR, number 4 BN and number 5 OSFED) b) erythrocytes levels and EDs types (number 1 CTR, number 2 AN-RES, number 3 AN-PUR, number 4 BN and number 5 OSFED), c) Pairwise Comparison to compare leukocytes levels and EDs types in pairs (significant correlation in yellow lines) d) Pairwise Comparison to compare erythrocytes levels and EDs types in pairs (significant correlation in yellow lines).
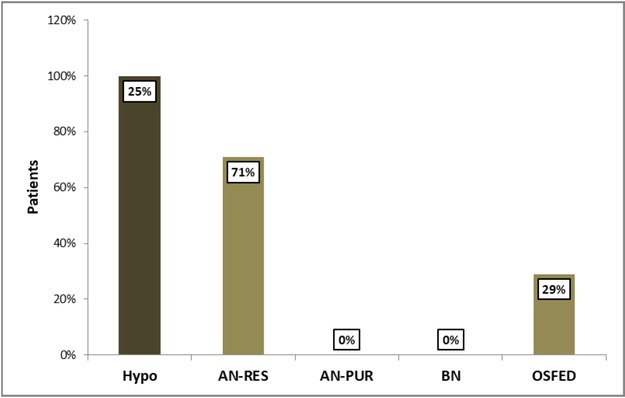
Figure 5
Percentage of patients with hypoglycemia and divided by type of EDs. AN-RES, restrictive-type anorexia nervosa, AN-PUR, purging-type anorexia nervosa, BN, bulimia nervosa, OSFED, other specified feeding or eating disorder.
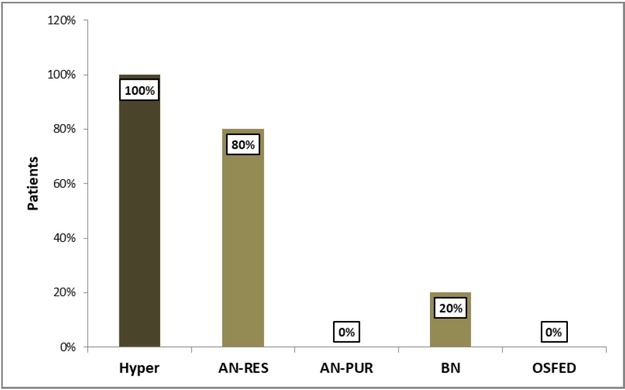
Figure 6
Percentage of patients with hypercholesterolemia divided by type of EDs. AN-RES, restrictive-type anorexia nervosa, AN-PUR, purging-type anorexia nervosa, BN, bulimia nervosa, OSFED, other specified feeding or eating disorder.
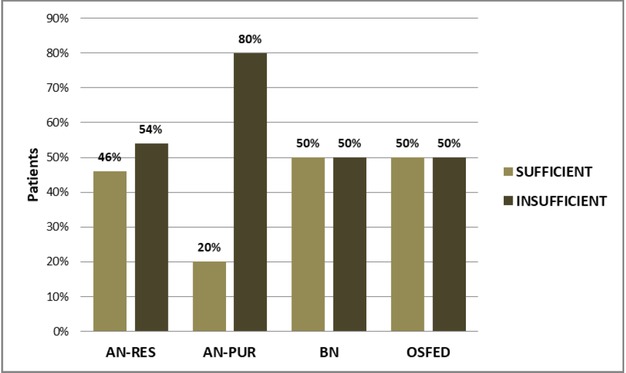
Figure 7
Vitamin D3 values in adults patients divided by type of EDs. AN-RES, restrictive-type anorexia nervosa, AN-PUR, purging-type anorexia nervosa, BN, bulimia nervosa, OSFED, other specified feeding or eating disorder.
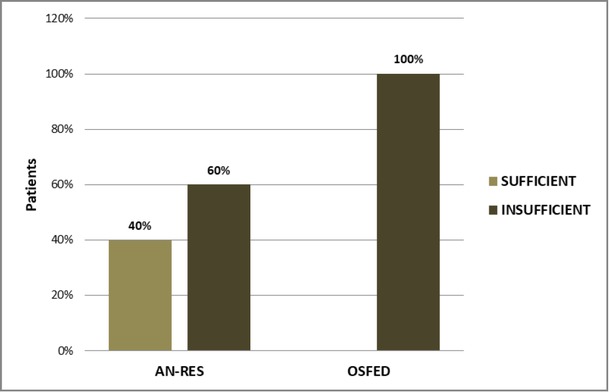
Figure 8
Vitamin D3 values in “girls” patients divided by type of Eating Disorders Only AN-RES, restrictive-type anorexia nervosa and OSFED, other specified feeding or eating disorder.
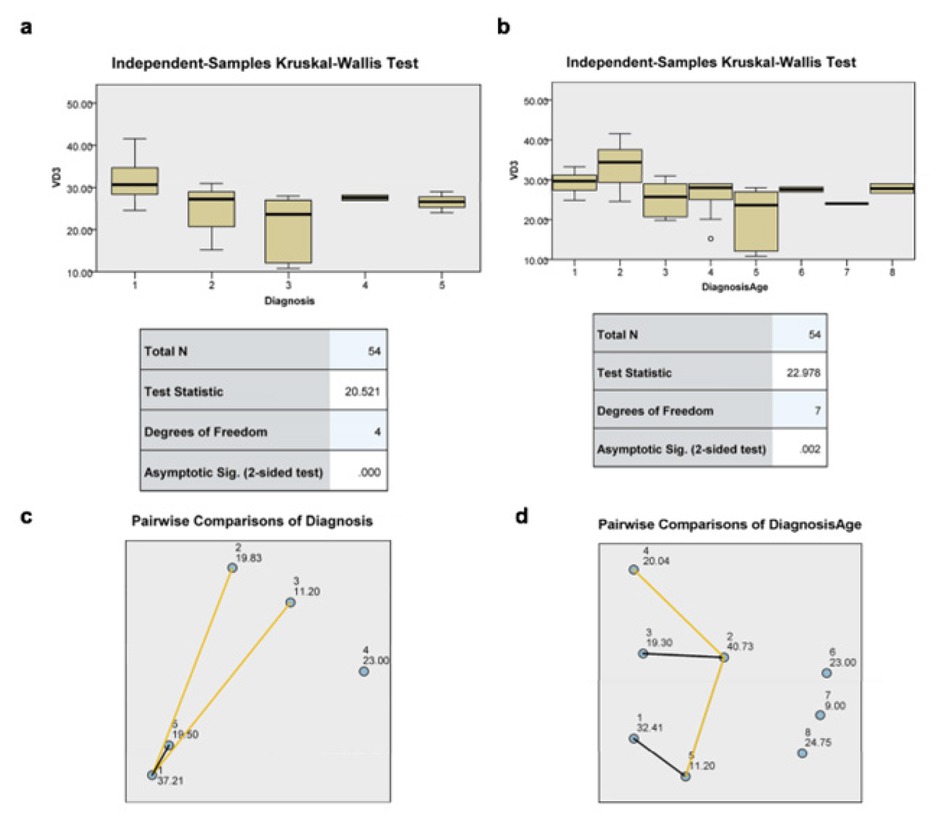
Figure 9
Statistical analysis using non-parametric Kruskal-Wallis: a) Vitamin D3 levels and EDs types (number 1 CTR, number 2 AN-RES, number 3 AN-PUR, number 4 BN and number 5 OSFED) b) Vitamin D3 levels and EDs types in different age groups (number 1 CTR<14, number 2 CTR>14, number 3 AN-RES<14, number 4 AN-RES>14, number 5 AN-PUR, number 6 BN and number 7 OSFED<14, number 8 OSFED>14), c) Pairwise Comparison to compare EDs types in pairs (significant correlation in yellow lines) d) Pairwise Comparison to compare EDs types in different age groups in pairs (significant correlation in yellow lines).