
Table 1
Chemical content of propolis used in this study (GC-MS)
| Compounds | % | Compounds | % |
|---|---|---|---|
| Flavonoids | 41,2 | Aromatic acids and their esters | 27,13 |
| 4,5 dimethoxy-(2-propenyl) 2-phenol | Caffeic acid | ||
| Pinocembrin | Ferulic acid | ||
| Chrysin | Benzoic acid | ||
| Galangin | Caffeic acid phenetyhl ester | ||
| Organic and fatty acids | 12,63 | Alcohol, ketone and terpenes | 19,04 |
| Decanoic acid | 2-propen-1-ol | ||
| 4-pentenoic acid | 5-3,3-dimethyl-cyclohexanone | ||
| Cinnamic acid | 2-Nonadecanone | ||
| 3-hydroxy-4-methoxycinnamic acid | Gamma-eudesmol | ||
| 2-propenoic acid | Beta-eudesmol | ||
| 3,4-dimethoxycinnamic acid | Alpha-eudesmol | ||
| Coumaric acid | Alpha-bisabolol | ||
| 9-Octadecanoic acid | 2-propen-1-one | ||
| Octadecanoic acid |
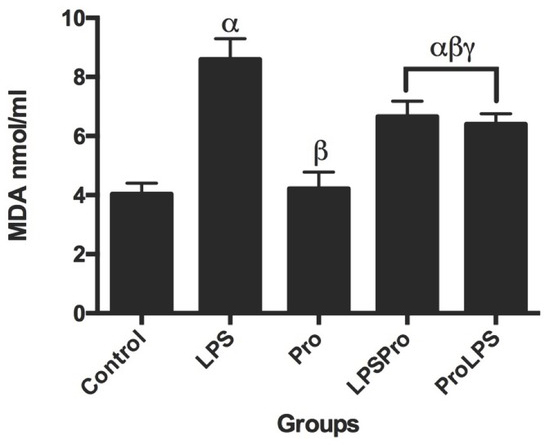
Figure 1
Serum MDA levels of groups. The histogram bar graph data are expressed as mean ± SD, and compared by compared by one-way ANOVA and Tukey’s post hoc test for multiple comparisons test (α P<0.05 versus control group; β P<0.05 vs. LPS group; γ P<0.05 vs. Propolis group; ψ P<0.05 vs. LPS + Propolis group).
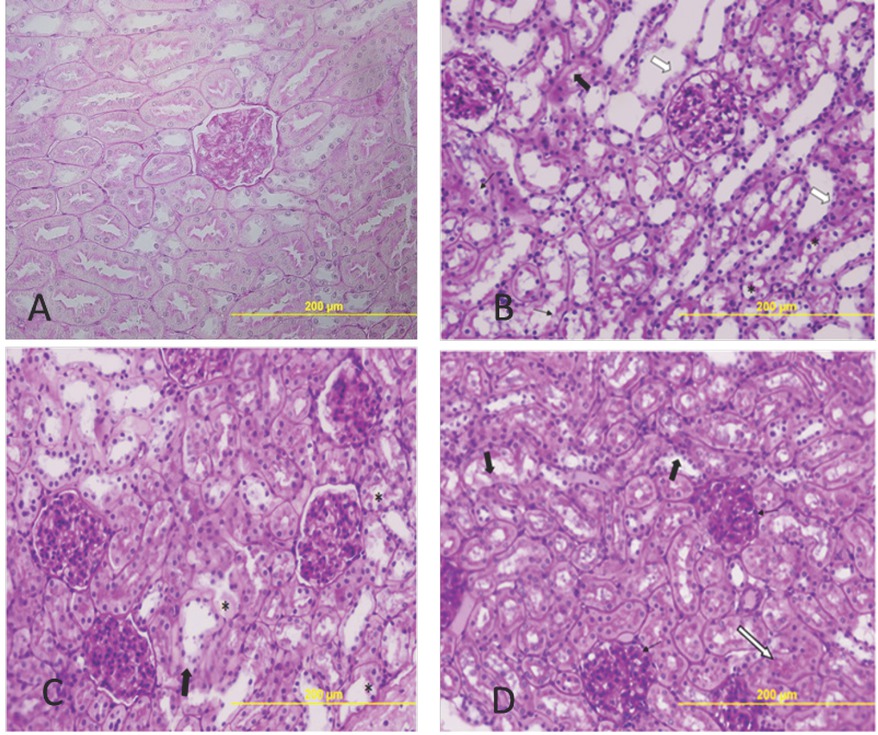
Figure 2
A: Group 1 (control animals) revealed normal kidney structure (x40, PAS). B: Group 2 (LPS) kidney sections of rats demonstrated slight tubular damage (black arrow), ischemic damage in the form of vacuolization (thin black arrow), tubular dilatation (thick white arrow) and tubule epithelial vacuolization (*) (x40, PAS). C: Group 4 (Propolis+LPS) kidney sections of rats demonstrated ischemic damage (thick black arrow), tubule epithelial degeneration (*), (x40, PAS). D: Group 5 (LPS+Propolis) kidney sections demonstrated ischemic damage (thick black arrow), vascular congestion (thin white arrow) and reduced Bowman’s space (thin black arrow), (x40, PAS).