
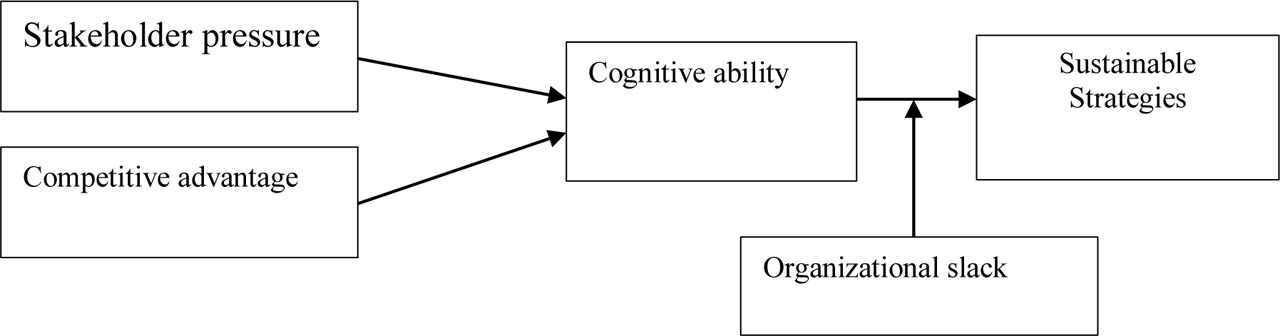
Figure 1:
Proposed conceptual framework
Source: own research
Table 1:
Respondents' Profile
| Demographic Characteristic | Greater Accra (n=250) | Western Region (n=165) | Total (N=415) |
|---|---|---|---|
| Gender | |||
| Male | 140 (56%) | 90 (55%) | 230 (55%) |
| Female | 110 (44%) | 75 (45%) | 185 (45%) |
| Age Group | |||
| 18–30 years | 75 (30%) | 40 (24%) | 115 (28%) |
| 31–45 years | 125 (50%) | 85 (52%) | 210 (51%) |
| 46+ years | 50 (20%) | 40 (24%) | 90 (22%) |
| Education Level | |||
| Masters | 15 (6%) | 20 (12%) | 35 (8%) |
| SSSCE/Diploma | 120 (48%) | 90 (55%) | 210 (51%) |
| Degree | 115 (46%) | 55 (33%) | 170 (41%) |
Table 2:
Construct reliability and validity
| Constructs | Cronbach alpha | Composite reliability (rho_a) | Composite reliability (rho_c) | Average Var. extracted (AVE) |
|---|---|---|---|---|
| Cognitive Ability | 0.850 | 0.867 | 0.909 | 0.769 |
| Competitive Advantage | 0.811 | 0.821 | 0.888 | 0.727 |
| Organizational Slack | 0.916 | 0.919 | 0.947 | 0.858 |
| Stakeholder Pressure | 0.814 | 0.852 | 0.890 | 0.732 |
| Sustainable Strategies | 0.865 | 0.867 | 0.918 | 0.788 |
Table 3:
Construct Measurement, VIF and factor loadings
| Construct | Indicator | Factor Loading | VIF |
|---|---|---|---|
| Cognitive Ability | CA2: My business leadership effectively anticipates market changes and adjusts strategies proactively. | 0.810 | 1.478 |
| CA3: I consistently evaluate risks and opportunities using logical reasoning before making key decisions. | 0.915 | 2.255 | |
| CA4: Our team learns quickly from setbacks and innovates solutions to complex operational challenges. | 0.902 | 2.135 | |
| Competitive Advantage | COA2: Our SME offers unique products/services that stand out from competitors in the market. | 0.779 | 1.703 |
| COA3: We maintain lower operational costs than rivals, allowing competitive pricing without sacrificing quality. | 0.893 | 2.622 | |
| COA4: Customer loyalty to our business provides a strong edge over other firms in our industry. | 0.882 | 2.484 | |
| Organisational Slack | OS1: Our business maintains excess financial resources to handle unexpected challenges or opportunities. | 0.882 | 2.423 |
| OS2: We have unused capacity in staff, equipment, or inventory that allows quick adaptation to market demands. | 0.958 | 4.113 | |
| OS3: Extra operational buffers enable us to experiment with new sustainability initiatives without risking core stability. | 0.936 | 4.118 | |
| Stakeholder Pressure | SP2: Customers increasingly demand sustainable practices from our business, influencing our operational choices | 0.728 | 1.444 |
| SP3: Regulatory bodies or government policies push our SME to adopt environmentally friendly strategies | 0.926 | 2.922 | |
| SP4: Investors or partners expect us to prioritise ethical and green initiatives to maintain their support | 0.900 | 2.540 | |
| Sustainable Strategies | SS2: Our SME actively incorporates eco-friendly materials and processes into core production or operations. | 0.856 | 2.067 |
| SS3: We pursue innovative green practices (e.g., energy efficiency or waste reduction) to gain a competitive edge. | 0.923 | 3.074 | |
| SS4: Sustainability goals are embedded in our long-term business planning and resource allocation. | 0.883 | 2.282 |
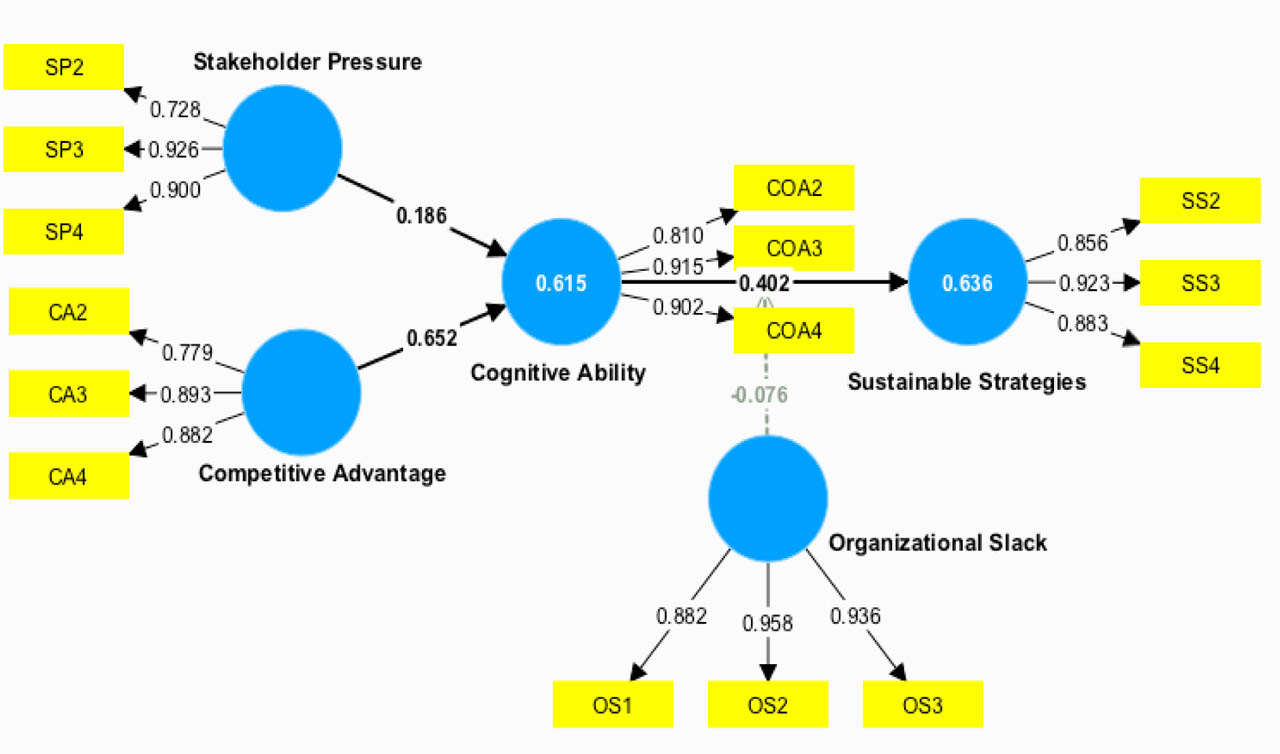
Figure 2:
Results of the model
Source: Data processing from PLS-SEM
Table 4:
discriminant validity-Fornell Lacker
| Constructs | Cognitive Ability | Competitive Advantage | Organizational Slack | Stakeholder Pressure | Sustainable Strategies |
|---|---|---|---|---|---|
| Cognitive Ability | 0.877 | ||||
| Competitive Advantage | 0.771 | 0.853 | |||
| Organizational Slack | 0.541 | 0.554 | 0.926 | ||
| Stakeholder Pressure | 0.604 | 0.642 | 0.452 | 0.856 | |
| Sustainable Strategies | 0.693 | 0.723 | 0.692 | 0.555 | 0.888 |
Table 5:
Hypothesis Testing
| Standard Bootstrap Results | ||||||
|---|---|---|---|---|---|---|
| Effects | Original coefficient | Mean value | Standard Deviation | t-value | p-value | Interpretation |
| H1: Stakeholder Pressure -> Cognitive Ability | 0.186 | 0.185 | 0.065 | 2.844 | 0.004 | Accepted |
| H2: Competitive Advantage -> Cognitive Ability | 0.652 | 0.652 | 0.053 | 12.404 | 0.000 | Accepted |
| H3: Cognitive Ability -> Sustainable Strategies | 0.402 | 0.394 | 0.078 | 5.184 | 0.000 | Accepted |
| H4: Organisational Slack -> Cognitive Ability -> Sustainable Strategies | −0.076 | −0.107 | 0.065 | 1.173 | 0.241 | Not Accepted |