
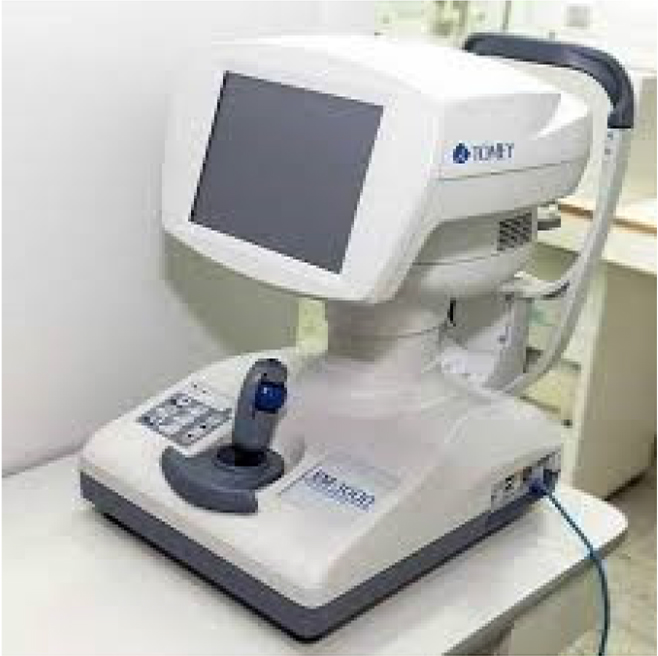
Figure 1.
Tomey EM-3000 specular microscope
Table 1.
Age and sex distribution
| Variable | DM group (n = 36 eyes / 22 patients) | Control group (n = 40 eyes / 23 patients) |
|---|---|---|
| Age (years), mean ± SD | 67.4 ± 10.1 | 65.8 ± 12.6 |
| Sex (patients), n (%) | ||
| Male | 11 (50.0%) | 10 (43.5%) |
| Female | 11 (50.0%) | 13 (56.5%) |
Table 2.
Preoperative and postoperative corneal parameters in the diabetes and control groups
| Parameter | DM Pre-op (Mean ± SD) | DM 1 Month (Mean ± SD) | p (within DM) | Control Pre-op (Mean ± SD) | Control 1 Month (Mean ± SD) | p (within Control) | p (between groups) |
|---|---|---|---|---|---|---|---|
| ECD (cells/mm2) | 2577.25 ± 191.22 | 1899.19 ± 682.59 | <0.001 | 2460.35 ± 307.80 | 1786.18 ± 702.56 | < 0.001 | Pre-op: >0.05 Post-op: <0.05 |
| HEX (%) | 43.2 ± 5.4 | 39.4 ± 8.2 | >0.05 | 45.1 ± 7.8 | 42.2 ± 7.6 | >0.05 | >0.05 |
| CV (%) | 38.9 ± 5.5 | 40.7 ± 10.2 | >0.05 | 35.6 ± 3.3 | 37.5 ± 6.1 | >0.05 | >0.05 |
| CCT (μm) | 545.61 ± 32.45 | 556.32 ± 21.07 | >0.05 | 522.74 ± 36.49 | 536.69 ± 36.63 | >0.05 | Pre-op: <0.05 Post-op: <0.05 |