
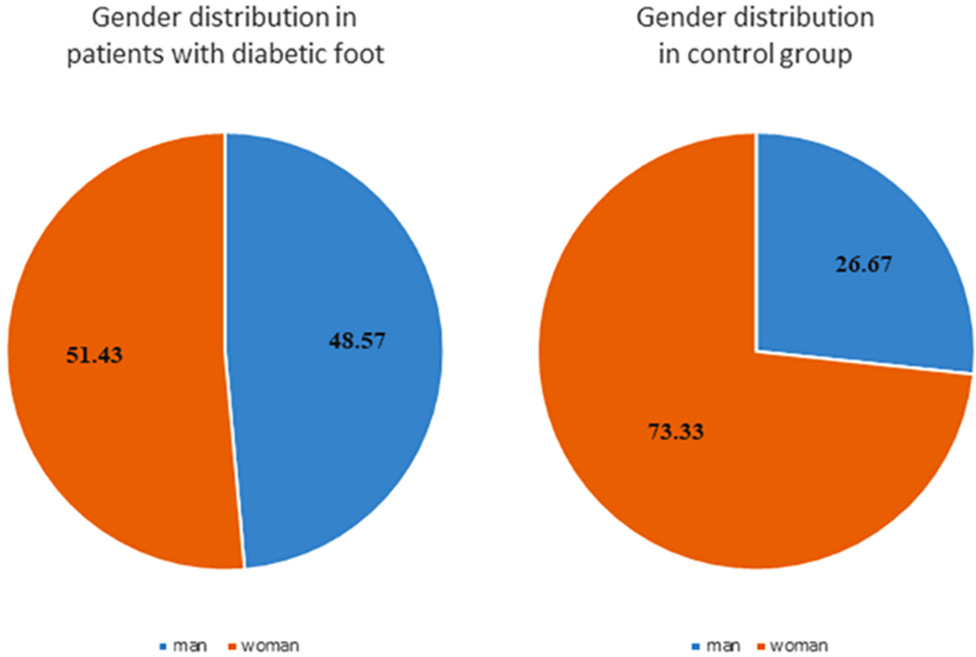
Figure 1.
Distribution of subjects by gender
Table 1.
Diagnostic performance of the monofilament score for detecting plantar foot lesion
| AUC | SE | 95% CI | z | p |
|---|---|---|---|---|
| 0.82 | 0.0319 | 0.743 - 0.882 | 10.027 | < 0.001 |
| “Cut point” | SN (%) | SP (%) | PPV (%) | NPV (%) |
| < 11 | 61.43 | 100 | 100 | 69 |
Table 2.
Display of the frequency of microlesions on the plantar side of the foot
| Microlesions foot | Right leg | Left leg | ||
|---|---|---|---|---|
| Study population | Contro group (n = 60) | Study group (n = 70) | Control group (n = 60) | Study group (n = 70) |
| Cracks | ||||
| yes | 0 (0%) | 34 (48.58%) | 0 (0%) | 34 (48.58 %) |
| no | 60 (100%) | 36 (51.42%) | 60 (100%) | 36 (51.42%) |
| Calluses | ||||
| yes | 0 (0%) | 25 (35.7%) | 9 (15%) | 31 (44.28%) |
| no | 60 (100%) | 45 (64.3%) | 51 (85%) | 39 (55.71%) |
Table 3.
Ulcers on the plantar side of the foot
| History of existence ulcer | Control group (n = 60) | Study group (n = 70) | Total |
|---|---|---|---|
| negative | 60 (100%) | 47 (67.15%) | 107 |
| positive | 0 (0%) | 23 (32.85%) | 23 |
Table 4.
Plantar average pressures during static measurement
| Average pressure (kPa) | Control group (n = 60) Md | Study group (n = 70) Md | U | z | p |
|---|---|---|---|---|---|
| P 1 | 18.810 | 19.078 | 2008.5 | 0.260 | p > 0.05 |
| Pd | 20.180 | 19.005 | 1578.5 | 2.300 | p = 0.021 |
| Pmax | 63.720 | 75.870 | 1761.0 | 1.437 | p > 0.05 |
| (Pl+Pd)/2 | 20.010 | 18.975 | 1942.5 | 0.579 | p > 0.05 |
| P 1/Pd | 21.270 | 21.460 | 2042.0 | 0.109 | p > 0.05 |
| P 1 and Pd | 19.715 | 19.010 | 7509.5 | 1.257 | p > 0.05 |
Table 5.
Integral pressure/time for both feet during dynamic measurement
| Integral pressure/time (kPa·ms) | Control group (number of measurements) | Study group (number of measurements) | Control group (n = 60) Md | Studygroup (n = 70) Md | U | z | p |
|---|---|---|---|---|---|---|---|
| I l | 60 | 70 | 971.820 | 1088.47 | 1674 | −1.849 | p = 0.06 |
| Id | 60 | 70 | 930.320 | 1097.67 | 1676 | −1.839 | p = 0.07 |
| (Il+Id)/2 | 60 | 70 | 944.770 | 1055.83 | 1652 | −1.953 | p = 0.05 |
| Il or Id | 60 | 70 | 1066.49 | 1293.72 | 1618 | −2.113 | p = 0.03 |
| Il + Id | 120 | 140 | 947.695 | 1088.47 | 6698 | −2.616 | p < 0.01 |
[i] I l - integral pressure/time for the left foot in the dynamic measurement model, Id - integral pressure/time for the right foot in the dynamic measurement model, (Il+Id)/2 - mean values integral pressure time, Il or Id - dominant integral pressure time in the dynamic model pressure measurement, Il + Id - total integral pressure time
Table 6.
Comparison of monofilament test, static and dynamic measurement model of plantar pressures
| Monofilament | Static measurement | Dynamic measurement | |
|---|---|---|---|
| Number of subjects | 130 | 130 | 130 |
| Mean value (%) | 78.2402 | 85.9787 | 95.5426 |
| Median (%) | 81.2500 | 87.5000 | 93.7500 |
| Standard error (%) | 18.47607 | 12.20248 | 5.36701 |
| Range (%) | 75.00 | 96.25 | 25.00 |
| Minimum (%) | 25.00 | 3.75 | 75.00 |
| Maximum (%) | 100.00 | 100.00 | 100.00 |
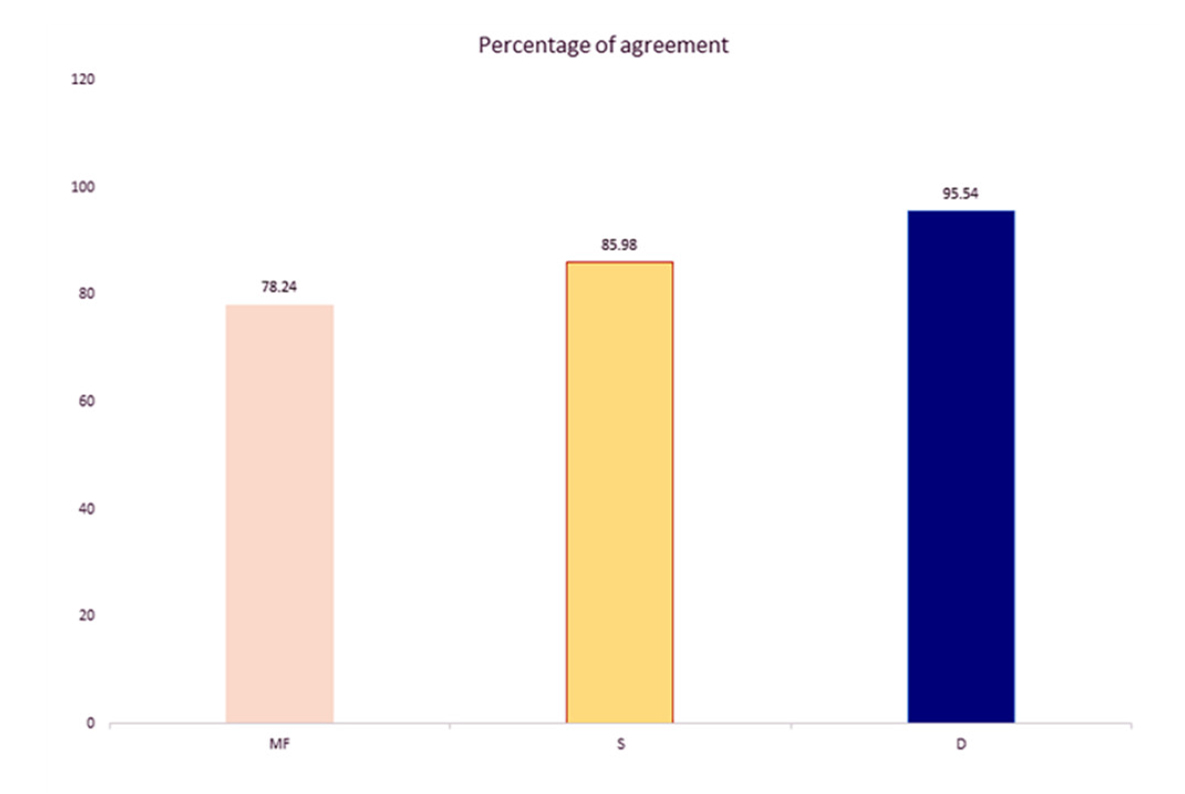
Figure 2.
Comparison results of monofilament tests, static and dynamic models measurement of plantar pressures with clinical findings
MF- monofilament test, S- static measurement model, D- dynamic plantar pressure