
INTRODUCTION
Diabetic foot disease involves one or more foot disorders in people with diabetes mellitus, including peripheral polyneuropathy, peripheral vascular disease, infection, ulceration, neuroosteoarthropathy, gangrene, or amputation. Although this complication affects a substantial proportion of people with diabetes, it represents not only a personal burden for the affected individual but also a significant burden for the family and healthcare system [1]. Once a foot ulcer develops, the risk of recurrent ulceration and lower-limb amputation increases considerably, creating a major medical, social, and economic problem. Therefore, early identification of factors associated with plantar tissue damage is of particular clinical importance [2, 3].
Plantar pressure is defined as the force applied per unit area by the plantar surface of the foot to the ground. Increased and repetitive plantar pressure contributes to the development of microlesions on the plantar surface, which may be detected during routine clinical examination. Plantar pressure is commonly assessed using baropodographic platforms, which provide quantitative information on pressure distribution under static and dynamic conditions [4]. Clinical examination of the foot represents the primary reference method in routine practice, while plantar pressure measurements and sensory testing are considered useful adjunct tools for identifying areas exposed to increased mechanical load [5]. Plantar pressure may increase during both standing and walking. Depending on the depth and extent of tissue damage, clinical manifestations may involve the epidermis, dermis, subcutaneous tissue, tendons, joint ligaments, or plantar fascia, and in advanced stages, joints and bones may also be affected [6]. Most countries apply international guidelines for diabetic foot management and operate specialized multidisciplinary clinics. Nevertheless, there remains a need for practical and objective methods that can support routine clinical assessment and contribute to the early detection of plantar tissue changes [7, 8].
The aim of this study was to assess the diagnostic agreement between commonly used clinical and instrumental methods for the detection of minor and major plantar foot lesions, including the monofilament test, static plantar pressure measurement, and dynamic plantar pressure measurement.
MATERIALS AND METHODS
Study design
This was a clinical, non-interventional, cross-sectional observational study including participants from an study group and a control group. The study was approved by the Ethics Committee of the Clinical Center Kragujevac and conducted at the Center for Endocrinology, Diabetes, and Metabolic Diseases of the University Clinical Center Kragujevac.
Study population
Inclusion criteria
Participants were recruited using a convenience sampling approach and included individuals who provided written informed consent, were older than 18 years, and had a body mass index (BMI) below 35 kg/m2. The study group consisted of patients with type 2 diabetes mellitus and sensorimotor diabetic polyneuropathy, diagnosed according to standard criteria as the presence of at least one neuropathic symptom or clinical sign in combination with abnormal nerve conduction study findings, after exclusion of other identifiable causes of peripheral neuropathy. The control group consisted of healthy volunteers without diabetes mellitus.
Exclusion criteria
The following participants were excluded from the study: patients with other neurological disorders relevant to the research, including cerebrovascular stroke, transient ischemic attack, myelodegenerative diseases, demyelinating disorders of the nervous system, and tumors of the nervous system; patients with orthopedic disorders, fractures or deformities of the spine or foot; patients with rheumatoid arthritis and foot deformities; patients with limb amputation; patients with thyroid dysfunction, liver or kidney insufficiency; as well as patients receiving opioid analgesic therapy, individuals with opioid dependence, and patients with mental disorders affecting perception.
Study procedures
All measurements and examinations were performed during a single visit for each participant. Clinical foot examination included a general assessment of foot condition, careful visual inspection immediately after removal of footwear and socks, in order to identify areas of increased pressure related to inadequate footwear and existing deformities of the toes or foot. Minor and major diabetic foot lesions corresponding to high-pressure areas were recorded, including rhagades, calluses, hyperkeratosis, and non-infected plantar ulcers. Each foot was photographed and independently examined by two endocrinologists. Both examiners documented the location and type of lesion on a standardized schematic foot chart.
Sensory testing was performed using a 10 g Semmes-Weinstein monofilament at eight standardized points on each foot: the first, third, and fifth metatarsal heads, the plantar surface of the hallux, third and fifth toes, the heel area, and the dorsal surface of the hallux. The monofilament was applied perpendicular to the skin and pressure was gradually increased until the filament bent into a C shape, which was maintained for one second. Participants were asked to indicate whether they perceived the stimulus. The monofilament score ranged from 0 to 16 and represented the number of plantar sites at which the stimulus was correctly perceived.
Static and dynamic plantar pressure measurements were performed using a baropodographic platform (FOOTWORK PRO, France), equipped with 4096 calibrated sensors (two sensors per cm2). The active surface of the platform measured 490 × 490 mm and allowed assessment of pressure distribution and force during standing and walking. All measurements were performed in real time. For each participant, three static and three dynamic measurements were performed separately for each foot. The static model measured plantar pressure during standing. Participants stood barefoot on the platform in an upright position, with feet shoulder-width apart and gaze directed forward, for 30 seconds. Three consecutive measurements were obtained, with a five-minute rest period between measurements, during which participants stepped off the platform and resumed the initial position. The dynamic model recorded plantar pressure during walking using the three-step protocol. Participants started three steps away from the platform (0.75–1.5 m), initiated walking with the left foot, and stepped onto the platform with the left foot on the third step. The procedure was then repeated starting with the right foot. This sequence was repeated three times, resulting in three dynamic measurements for each foot. Variables recorded included maximum and mean plantar pressure under static and dynamic conditions, contact time between foot and platform, and pressure-time integral for each foot. Pressuretime integral values were expressed in units provided by the device software (kPa·ms). Clinical findings at the eight predefined plantar points were compared with monofilament test results and corresponding parameters from static and dynamic plantar pressure measurements. Percentage agreement between methods was calculated for both feet. For the purpose of this study, calluses and fissures were defined broadly as any visible hyperkeratosis or superficial skin discontinuity, regardless of size or clinical significance.
Statistical analysis
Statistical analysis was performed using IBM SPSS Statistics version 20. Data were presented graphically and in tables. Descriptive statistics included frequencies, measures of central tendency (mode, median, and mean), and measures of variability (quantiles, variance, and standard deviation). Group comparisons were performed using the independent samples t-test or the Mann-Whitney U test, depending on data distribution. Paired comparisons within the same participant under different conditions were performed using the paired samples t-test or the Wilcoxon signed-rank test, as appropriate.
RESULTS
Demographic and anthropometric characteristics
A total of 130 participants of the same ethnic background were included in the study. The study group consisted of 70 participants, including 36 women (51.43%) and 34 men (48.57%). The control group included 60 participants, of whom 44 were women (73.33%) and 16 were men (26.67%). The mean age of participants in both groups was 54.56 ± 14.22 years. The distribution of participants by sex is presented in Figure 1.
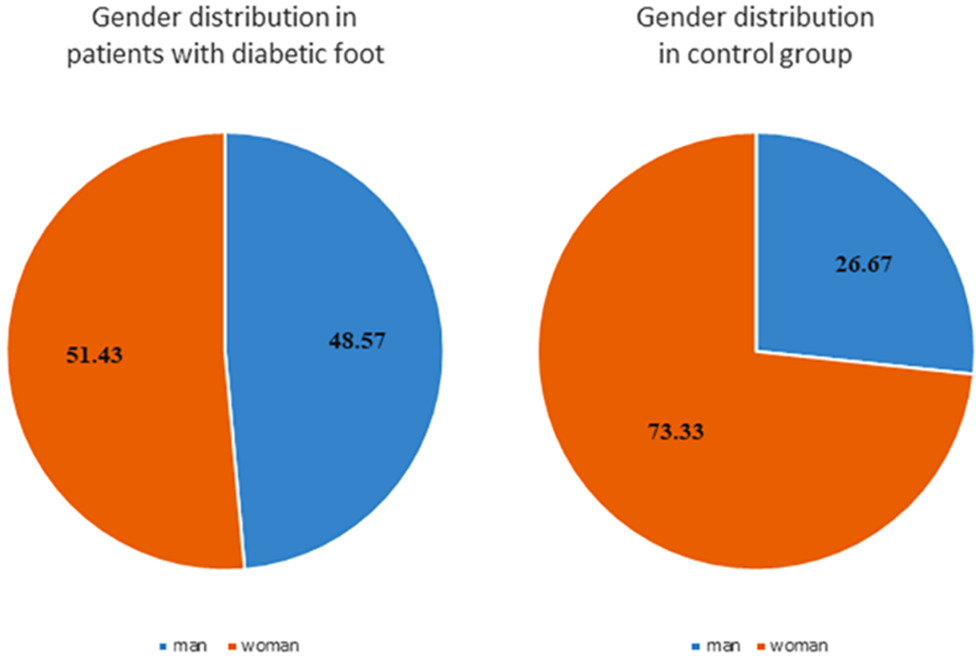
Figure 1.
Distribution of subjects by gender
Agreement between clinical findings and diagnostic methods
By comparing clinical findings on the plantar surface of the foot with positive results obtained from static and dynamic plantar pressure measurements and monofilament testing, the percentage agreement among the three methods was determined. During static measurement, the position of each foot was automatically displayed in centimeters, and the software calculated pressure distribution for both feet, including forefoot and rearfoot regions, as well as maximum and mean plantar pressure values. The same plantar points were compared for monofilament testing and for maximum pressure values obtained from static and dynamic measurements.
Monofilament testing
Monofilament testing was considered positive when the participant failed to perceive the stimulus at one of the sixteen tested points (eight points on each foot). The results showed that the monofilament test had a specificity of 100% and a positive predictive value of 100%, while sensitivity was 61.43% and negative predictive value was 69% in the detection of diabetic foot lesions. The derived cut-off value in the study group was below 11 (Table 1).
Clinical findings
Microlesions on the plantar surface of the foot were identified in the form of calluses, rhagades, and fissures. Rhagade-type lesions were observed in 36 participants (51.42%) on both feet. Calluses were present in 45 participants (64.3%) on the right foot and in 39 participants (55.7%) on the left foot (Table 2). Minor plantar skin changes were frequent in both groups due to the broad operational definition applied, which included minimal hyperkeratosis/superficial fissuring.
Table 2.
Display of the frequency of microlesions on the plantar side of the foot
| Microlesions foot | Right leg | Left leg | ||
|---|---|---|---|---|
| Study population | Contro group (n = 60) | Study group (n = 70) | Control group (n = 60) | Study group (n = 70) |
| Cracks | ||||
| yes | 0 (0%) | 34 (48.58%) | 0 (0%) | 34 (48.58 %) |
| no | 60 (100%) | 36 (51.42%) | 60 (100%) | 36 (51.42%) |
| Calluses | ||||
| yes | 0 (0%) | 25 (35.7%) | 9 (15%) | 31 (44.28%) |
| no | 60 (100%) | 45 (64.3%) | 51 (85%) | 39 (55.71%) |
Macrolesions in the form of non-infected plantar ulcers were detected in 23 participants (32.85%) at the time of examination. A history of previous plantar ulcers was reported in 47 participants (67.15%) from the study group. No plantar ulcers were observed in the control group. A statistically significant difference between the study and control groups was found for the presence of plantar ulcers (p < 0.001; Table 3).
Static plantar pressure measurements
In the static plantar pressure measurement model, the following parameters were analyzed: mean pressure of both feet, mean pressure of the dominant foot, and combined mean pressure of both feet (Table 4). No statistically significant differences were observed between the study and control groups, except for mean pressure of the right foot (p = 0.021). Maximum pressure on the dominant foot showed higher values in the study group, but without statistical significance.
Table 4.
Plantar average pressures during static measurement
| Average pressure (kPa) | Control group (n = 60) Md | Study group (n = 70) Md | U | z | p |
|---|---|---|---|---|---|
| P 1 | 18.810 | 19.078 | 2008.5 | 0.260 | p > 0.05 |
| Pd | 20.180 | 19.005 | 1578.5 | 2.300 | p = 0.021 |
| Pmax | 63.720 | 75.870 | 1761.0 | 1.437 | p > 0.05 |
| (Pl+Pd)/2 | 20.010 | 18.975 | 1942.5 | 0.579 | p > 0.05 |
| P 1/Pd | 21.270 | 21.460 | 2042.0 | 0.109 | p > 0.05 |
| P 1 and Pd | 19.715 | 19.010 | 7509.5 | 1.257 | p > 0.05 |
Dynamic plantar pressure measurements
In the dynamic measurement model, mean plantar pressure and maximum plantar pressure at the same points on each foot were analyzed. No statistically significant differences were found between the study and control groups for these parameters. However, the pressure-time integral parameter was significantly higher in participants with diabetic foot compared with the control group, including mean, dominant, and total values for both feet (Table 5).
Table 5.
Integral pressure/time for both feet during dynamic measurement
| Integral pressure/time (kPa·ms) | Control group (number of measurements) | Study group (number of measurements) | Control group (n = 60) Md | Studygroup (n = 70) Md | U | z | p |
|---|---|---|---|---|---|---|---|
| I l | 60 | 70 | 971.820 | 1088.47 | 1674 | −1.849 | p = 0.06 |
| Id | 60 | 70 | 930.320 | 1097.67 | 1676 | −1.839 | p = 0.07 |
| (Il+Id)/2 | 60 | 70 | 944.770 | 1055.83 | 1652 | −1.953 | p = 0.05 |
| Il or Id | 60 | 70 | 1066.49 | 1293.72 | 1618 | −2.113 | p = 0.03 |
| Il + Id | 120 | 140 | 947.695 | 1088.47 | 6698 | −2.616 | p < 0.01 |
[i] I l - integral pressure/time for the left foot in the dynamic measurement model, Id - integral pressure/time for the right foot in the dynamic measurement model, (Il+Id)/2 - mean values integral pressure time, Il or Id - dominant integral pressure time in the dynamic model pressure measurement, Il + Id - total integral pressure time
Percentage agreement between methods
Clinical examination identified micro- and macrolesions on the plantar surface of the foot, which were compared with positive findings from static and dynamic plantar pressure measurements and monofilament testing. The percentage agreement among the three methods was calculated. The highest agreement was observed for dynamic plantar pressure measurements across sixteen plantar points, with the smallest standard error and the narrowest range. The lowest agreement was observed for monofilament testing (Table 6,Figure 2).
Table 6.
Comparison of monofilament test, static and dynamic measurement model of plantar pressures
| Monofilament | Static measurement | Dynamic measurement | |
|---|---|---|---|
| Number of subjects | 130 | 130 | 130 |
| Mean value (%) | 78.2402 | 85.9787 | 95.5426 |
| Median (%) | 81.2500 | 87.5000 | 93.7500 |
| Standard error (%) | 18.47607 | 12.20248 | 5.36701 |
| Range (%) | 75.00 | 96.25 | 25.00 |
| Minimum (%) | 25.00 | 3.75 | 75.00 |
| Maximum (%) | 100.00 | 100.00 | 100.00 |
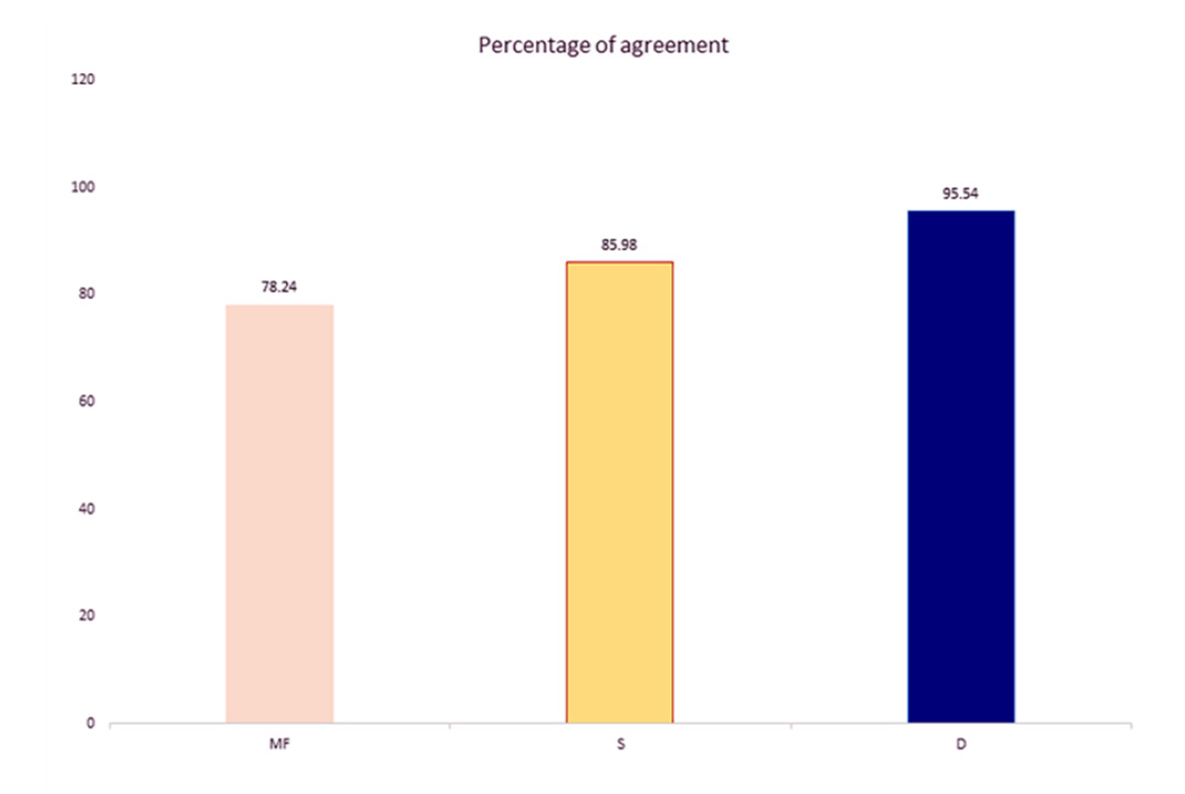
Figure 2.
Comparison results of monofilament tests, static and dynamic models measurement of plantar pressures with clinical findings
MF- monofilament test, S- static measurement model, D- dynamic plantar pressure
The dynamic plantar pressure measurement model showed the highest percentage agreement with clinical examination (95.54%), followed by the static measurement model (85.08%) and the monofilament test (78.24%).
DISCUSSION
Foot ulcer occurrence in people with diabetes mellitus remains frequent despite the numerous diagnostic methods and preventive measures introduced over recent decades. This complication may lead to lower limb amputation and represents not only a medical, psychological, and physical burden for the affected individual, but also a social and economic burden for both the patient and society [9]. The earliest clinical manifestations of increased plantar pressure appear as microlesions that may progress toward ulcer formation. In our study, examination of plantar microlesions revealed changes such as calluses, rhagades, and fissures. Rhagadetype lesions were observed in 36 participants (51.42%) on both feet, while calluses were present in 45 participants (64.3%) on the right foot and in 39 participants (55.7%) on the left foot. Macrolesions in the form of non-infected plantar ulcers were detected in 23 participants (32.85%) at the time of examination (Table 2).
According to published data, approximately 50% to 60% of diabetic foot ulcers become infected, and about 20% of moderate to severe infections lead to lower limb amputation [9]. The five-year mortality rate among individuals with diabetic foot ulcers is approximately 30%, and exceeds 70% in those who undergo major amputation. Mortality among people with diabetic foot ulcers reaches 231 deaths per 1000 individuals per year, compared with 182 deaths per 1000 individuals with diabetes without foot ulceration [9]. Diabetic peripheral neuropathy is considered one of the main risk factors for the development of foot ulcers. According to the 2023 guidelines of the International Working Group on the Diabetic Foot (IWGDF), neuropathy should be systematically assessed using standardized tools such as vibration perception threshold testing, monofilament testing, and symptom questionnaires [10].
Prevention of foot ulcer development in people with diabetes and diabetic peripheral neuropathy remains of major clinical importance, as the first ulcer markedly increases the risk of new ulcer formation on the same or contralateral limb [11]. This process is related to altered foot architecture caused by neuropathy. Various toe and foot deformities tend to worsen after partial amputations, promoting new ulcer formation on the same foot after minor amputation or on the opposite limb after major amputation [12]. Elevated plantar pressure represents another important factor in the etiology of diabetic foot. Over recent decades, diabetic foot has received increasing scientific attention, and multiple methods have been developed to assess plantar pressure [13]. However, most previous studies and meta-analyses have focused primarily on treatment strategies rather than on objective assessment methods supporting early identification of high-risk plantar regions [14, 15, 16].
To date, limited data are available from studies that directly compare commonly used diagnostic tests and plantar pressure measurements with clinical foot findings in a cross-sectional manner. The age of participants in our study was comparable to age groups reported in other investigations, with a mean age of 54.56 ± 14.22 years. The mean duration of diabetes in the study group was 13.86 ± 7.85 years. Previous studies have shown that individuals with diabetes lasting longer than ten years have a substantially increased risk of lower limb amputation. Distal symmetric polyneuropathy represents the most common form of diabetic neuropathy and typically shows slow progression [17].
In the present study, dynamic plantar pressure measurements showed a higher percentage agreement with clinical foot examination compared with static measurements and monofilament testing (Figure 1). Other studies have attempted to improve static plantar pressure assessment using machine learning approaches. For example, Sheikh et al. [18] reported improved accuracy under static conditions using gradient boosting techniques, while Gerlein et al. [19] reported lower accuracy using similar methods. Regional segmentation of the forefoot and rearfoot has been proposed as a way to enhance the discriminatory capacity of static measurements. Armstrong et al. [20] demonstrated that regionspecific pressure analysis may improve identification of ulcer-prone areas; however, their study did not include neuropathy classification or direct clinical examination findings, unlike the present study.
Some investigations, including studies conducted in Japanese populations, reported significantly higher plantar pressure values and pressure-time integrals in patients with diabetic peripheral neuropathy compared with patients with diabetes without neuropathy [21]. These findings support the potential relevance of dynamic plantar pressure parameters, particularly pressure-time integral, in identifying plantar regions exposed to prolonged mechanical stress during gait. However, other studies reported inconsistent results, especially when using baropodographic platforms, and suggested that in-shoe measurement systems may provide greater precision. Recent technological developments include systems for dynamic pressure redistribution, such as pneumatically driven mechanisms and magnetorheological fluid-based systems, which aim to regulate plantar pressure within recommended thresholds. When integrated into footwear or insoles, these technologies may contribute to reducing mechanical stress and supporting diabetic foot care [6, 22].
The main limitations of most existing studies include relatively small sample sizes and cross-sectional designs. Although diabetic neuropathy diagnosis was confirmed using combined clinical and electrophysiological criteria, detailed stratification according to neuropathy severity, diabetes duration, and glycemic control was not performed. The absence of subgroup analyses based on neuropathy severity scales or metabolic control parameters may have limited the ability to detect potential gradations in plantar pressure patterns. Future studies incorporating standardized neuropathy severity scoring systems and metabolic profiling are warranted to better define the relationship between mechanical load distribution and neuropathy progression. Additionally, novel technological solutions remain limited in their implementation, particularly in healthcare systems where primary prevention of diabetic foot has not yet been fully established [23, 24]. The cross-sectional nature of the present study does not allow conclusions regarding causality or prediction of future ulcer development, but provides descriptive information on the agreement between clinical findings and commonly used assessment methods.
CONCLUSION
The results of this study showed that dynamic plantar pressure measurements demonstrated a higher level of agreement with clinical foot examination compared with static measurements and monofilament testing. Plantar pressure mapping may represent a useful tool for identifying areas of increased mechanical load on the plantar surface of the foot.
This approach may support clinical assessment by contributing to individualized orthotic planning, objective monitoring of plantar pressure distribution, and evaluation of therapeutic interventions. However, due to the cross-sectional design of the study, no conclusions can be drawn regarding causality or prediction of future ulcer development.
Further longitudinal studies with standardized protocols are required to confirm the clinical relevance of dynamic plantar pressure assessment in diabetic foot care.