
Table 1.
Sociodemographic characteristics of the study population
| variables | MS relapse group (n =48) | MS remitting group (n = 50) | control group (n = 35) | p - value |
|---|---|---|---|---|
| age (years) | 41.7 ± 9.13 | 38.6 ± 7.88 | 38.6 ± 8.73 | 0.14* |
| sex (female / male) | 30 / 18 | 35 / 15 | 22 / 13 | 0.20* |
| mean duration of illness (years) | 6.19 (1–34) | 8.64 (2–18) | NA | 0.01** |
| relapse rate | 2.42 (0–5) | 1.24 (0–6) | NA | 0.05** |
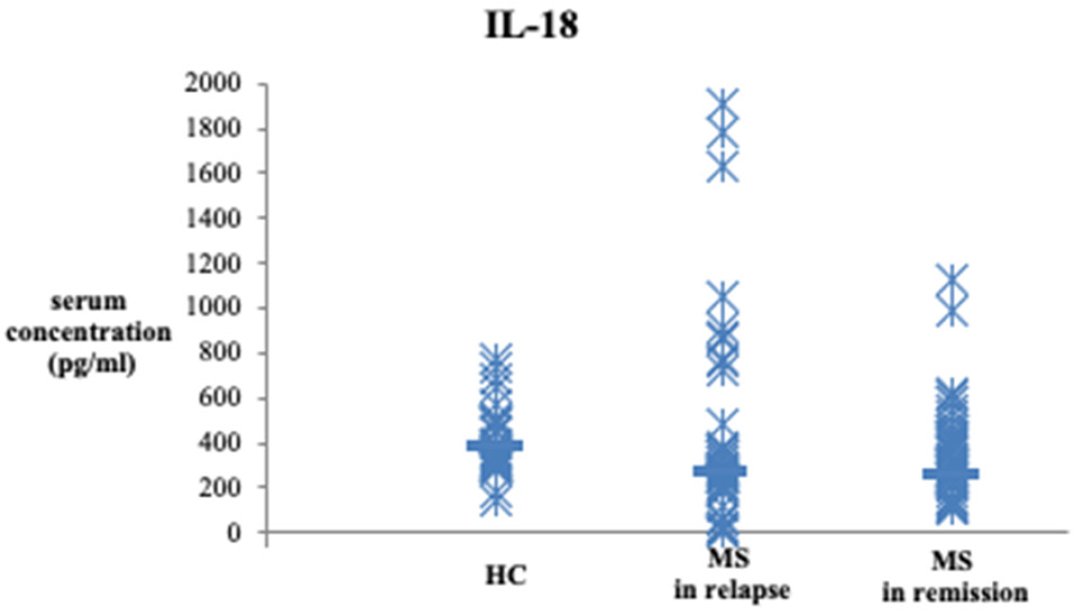
Figure 1.
Serum levels of IL-18.
Serum levels of IL-18 were determined by ELISA in healthy control subjects (n = 35), MS relapse patients (n = 48) and MS remitting patients (n = 50). Data are presented as mean ± SD. Statistical significance was tested using the Kruskal-Wallis test. Serum levels of IL-18 were significantly higher in MS relapse and MS remitting patients compared to the group of healthy control subjects (578.41 ± 1160.70 vs. 357.195 ± 206.75 vs. 405.20 ± 146.16 pg/ml, p = 0.040).
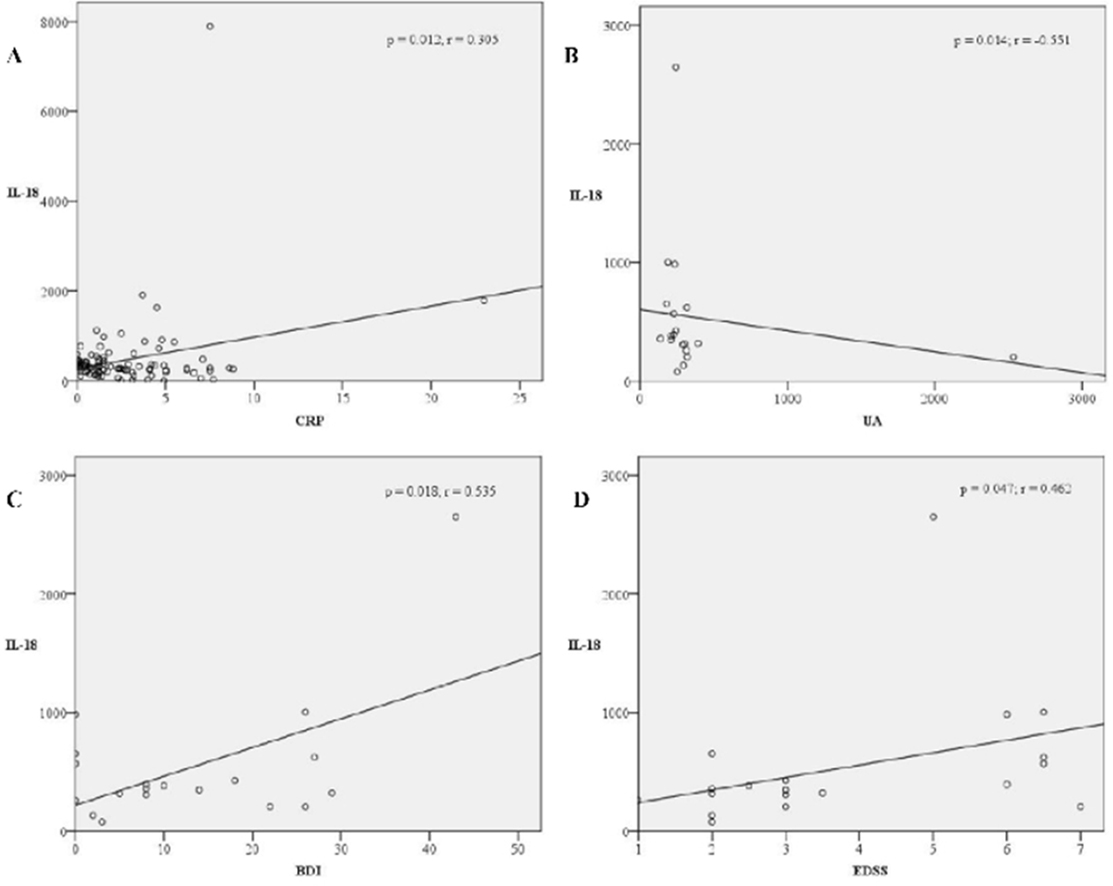
Figure 2
Legend. Correlations between serum levels of IL-18 and CRP and UA, and BDI and EDSS clinical scores. A significant, moderate positive correlation was observed between IL-18 and serum levels of CRP (p = 0.012, r = 0.305) in acute relapse (A). In stabilization, after eight weeks of corticosteroid therapy, a significant strong negative correlation was observed between IL-18 and serum concentrations of UA (p = 0.014, r = −0.551) (B), a strong positive correlation was observed between IL-18 and BDI score (p = 0.018, r = 0.535) (C), and a moderate positive correlation was observed with EDSS score (p = 0.047, r = 0.462) (D).
Abbreviations: IL - interleukin; CRP - C-reactive protein; EDSS - Expanded Disability Status Scale; UA - uric acid, BDI - Beck’s Depression Inventory.
Table 2.
Results of binary logistic regression analysis with illness onset as the dependent variable, and sex, age, serum UA and IL-18 levels as explanatory variables.
| category | explanatory variables | Wald | df | p - value | Odds ratio | Lower and upper 95% CI |
|---|---|---|---|---|---|---|
| illness onset | sex | 0.004 | 1 | 0.950 | 0.371 | 2.878 |
| age | 0.190 | 1 | 0.663 | 0.960 | 1.066 | |
| UA | 15.692 | 1 | 0.000 | 0.979 | 0.993 | |
| IL-18 | 0.021 | 1 | 0.884 | 0.999 | 1.001 |