
Table 1
Gross domestic product with the adjustment of import and export (in mil. CZK)
| Period | 2015 | 2016 |
|---|---|---|
| GDP | 4,595,783 | 4,773,240 |
| GDP after adjustment of import and export | 4,320,094 | 4,416,037 |
[i] Source: own processing according to: National accounts database: GDP expenditure method (Czech Statistical Office 2018, a)
Table 2
Formation of gross fix capital (national economy, in mil. CZK)
| Period | 2015 | 2016 |
|---|---|---|
| Formation of fix capital after change of supplies and net valuables acquisition | 1,284,787 | 1,257,260 |
[i] Source: own processing according to: National accounts database: GDP expenditure method (Czech Statistical Office 2018, a)
Table 3
Calculation of average amounts of acquisition of fix assets
| Sale and transfer of used fix assets (in mil. CZK) | NISID | Financial institutions | Governmental institutions | Households |
|---|---|---|---|---|
| 2010 | 523 | 6,886 | 48,794 | 137,133 |
| 2011 | 428 | 8,092 | 41,464 | 148,300 |
| 2012 | 462 | 6,659 | 28,428 | 162,622 |
| 2013 | 417 | 7,475 | 28,514 | 184,680 |
| 2014 | 356 | 5,857 | 23,195 | 161,197 |
| 2015 | 411 | 10,187 | 24,974 | 198,812 |
| Average 2016 | 433 | 7,526 | 32,562 | 165,457 |
| Net acquisition of fix assets 2016 | 4,982 | 32,455 | 158,823 | 211,922 |
| Net acquisition of fix assets + average of sales and transfer of used fix assets | 5,415 | 39,981 | 191,385 | 377,379 |
Table 4
Intermediate consumption and gross formation of capital (non-profit institutions, in mil. CZK)
| Period | 2015 | 2016 |
|---|---|---|
| Intermediate consumption + gross formation of capital after adjustment (non-profit institutions) | 51,050 | 41,939 |
[i] Source: own processing according to: National accounts database: Timeline of sector accounts (Czech Statistical Office 2018, a)
Table 5
Intermediate consumption and gross formation of capital (financial institutions, in mil. CZK)
| Period | 2015 | 2016 |
|---|---|---|
| Intermediate consumption + Gross formation of capital after adjustment and setting of share without a claim for deduction (financial institutions) | 112,720 | 108,005 |
[i] Source: own processing according to: National accounts database: Timeline of sector accounts (Czech Statistical Office 2018, a)
Table 6
Intermediate consumption and gross formation of capital (governmental institutions in mil. CZK)
| Period | 2015 | 2016 |
|---|---|---|
| Intermediate consumption + gross formation of capital after adjustment and deduction of collective consumption | 134,140 | 53,042 |
[i] Source: own processing according to: National accounts database: Timeline of sector accounts (Czech Statistical Office 2018, a)
Table 7
Analysis of individuals – active VAT payers
| 2015 | Share on total | 2016 | Share on total | |
|---|---|---|---|---|
| Individuals – active VAT payers, domestic | 291,133 | 23.32 | 280,274 | 22.59 |
| Individuals – active businessmen handing in personal income tax | 957,185 | 76.68 | 960,550 | 77.41 |
| Individuals – total | 1,248,318 | 100.00 | 1,240,824 | 100.00 |
[i] Source: own processing according to: Data from the register of tax entities. (Financial administration 2019)
Table 8
Gross formation of the capital after adjustment (households, in mil. CZK)
| Period | 2015 | 2016 |
|---|---|---|
| Gross formation of the capital after adjustment of the expenditures of non-/residents, acquisition of housing, exemption of share of VAT tax payers and deduction of production for own usage | 119,681 | 98,861 |
[i] Source: own processing according to: National accounts database: Timeline of sector accounts (Czech Statistical Office 2018, a)
Table 10
Absolute and relative VAT gap (in mil. CZK, in %)
| Period | 2015 | 2016 | |
|---|---|---|---|
| VAT gap | (mil. CZK) | 105,508 | 94,108 |
| VAT gap | (Percent) | 24.12 | 21.22 |
Table 11
Comparison of accessible VAT gap estimations
| SOURCE | 2012 | 2013 | ||
|---|---|---|---|---|
| mil. CZK | Percent | mil. CZK | Percent | |
| Study CASE – Final report 2017 | 72,439 | 20.00 | 71,116 | 19.00 |
| NKÚ – Summary from the control event 14/17 | 100,634 | 26.00 | 104,936 | 25.70 |
| Moravec et al. – calculation with the help of form of supplies and usage | 115,557 | 28.70 | 118,445 | 28.05 |
| Moravec et al. – GDP cleaning method | 65,369 | 16.26 | 69,034 | 16.07 |
| Stavjaňová – calculation with the help of form of supplies and usage | 127,000 | 31.40 | – | – |
[i] Source: own processing in accordance with: CASE (2017), NKÚ (2017), Moravec, Hinke and Kaňka (2018), Stavjaňová (2014)
Table 12
Comparison of accessible VAT gap estimations (mil. CZK/%) – part 2
| SOURCE | 2014 | 2015 | 2016 | |||
|---|---|---|---|---|---|---|
| mil. CZK | Percent | mil. CZK | Percent | mil. CZK | Percent | |
| Study CASE – Final report 2017 | 63,697 | 17 | 66,669 | 16 | – | – |
| NKÚ – Summary from the control event 14/17 | – | – | – | – | – | – |
| Moravec et al. – Calculation with the help of form of supplies and usage | 113,828 | 26.27 | – | – | – | – |
| Moravec et al. – GDP cleaning method | 60,524 | 13.77 | – | – | – | – |
| Stavjaňová – Calculation with the help of form of supplies and usage | – | – | – | – | – | – |
| GDP cleaning method calculated by authors | – | – | 105,508 | 24.12 | 94,108 | 21.22 |
[i] Source: own processing in accordance with: CASE (2017), NKÚ (2017), Moravec, Hinke and Kaňka (2018), Stavjaňová (2014)
Table 13
VAT revenues related to selected methods of financial administration (in thousand CZK)
| Method/Year | 2015 | 2016 |
|---|---|---|
| Change of tax – Summons from control statement | 0 | 214,295 |
| Change of tax – Initiatives from pairing control statement | 0 | 239,621 |
| Additionally assessed taxes from Tax checks | 13,660,791 | 12,454,914 |
| Revenue from Procedures for doubt removal | 10,564,998 | 4,872,856 |
[i] Source: change of tax – own calculation; additionally assessed taxes from tax check and revenue from procedures for doubt removal – Financial Administration (2018, b)
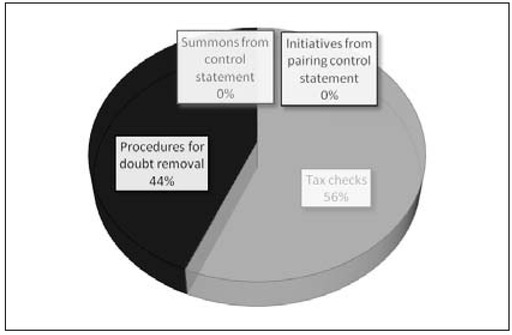
Figure 1
Share of selected methods on the overall change of tax in 2015
Source: own processing, 2020
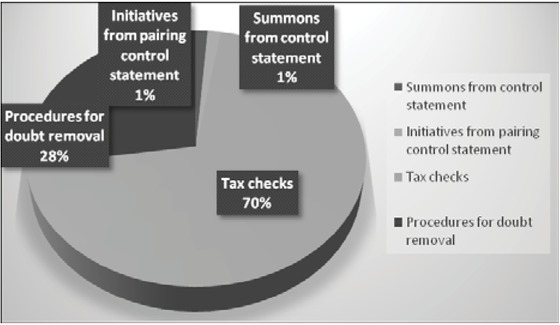
Figure 2
Share of selected methods on the overall change of VAT in 2016
Source: own processing, 2020
Table 14
Summary table of VAT indicators for 2015 and 2016
| Indicator/Year | 2015 | 2016 | ||
|---|---|---|---|---|
| mil. CZK | Percent | mil. CZK | Percent | |
| Theoretical tax liability for VAT | 437,344 | – | 443,568 | – |
| Real collection VAT | 331,836 | – | 349,460 | – |
| VAT gap with interventions | 105,508 | 24.12 | 94,108 | 21.22 |
| Share of Control Statement on real collection | 0 | 0 | 454 | 0.13 |
| Share of Tax Checks and Procedures for doubt removal on real collection | 24,226 | 7.3 | 17,328 | 4.96 |
| Share of selected methods on real collection IN TOTAL | 24,226 | 7.3 | 17,782 | 5.09 |
| Real collection on VAT without fiscal benefits of financial administration | 307,610 | – | 331,678 | – |
| VAT gap without the methods of financial administration | 129,734* | 29.66** | 111,890*** | 25.22** |
[i] Source: own processing; real collection: Data from tax collection Financial administration (2018, a) Note: *(437 344 − 307 610), ** % from theoretical tax liability, *** (443 568 − 331 678)
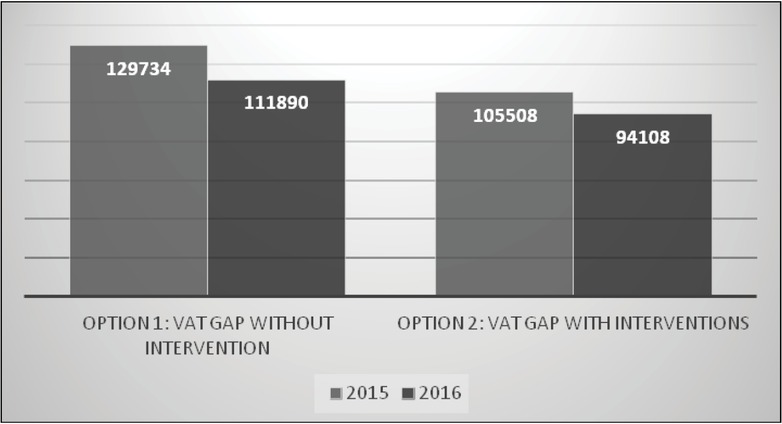
Figure 3
Comparison of the output of VAT gap in 2015 and 2016 K (in mil. CZK)
Source: own processing, 2020