
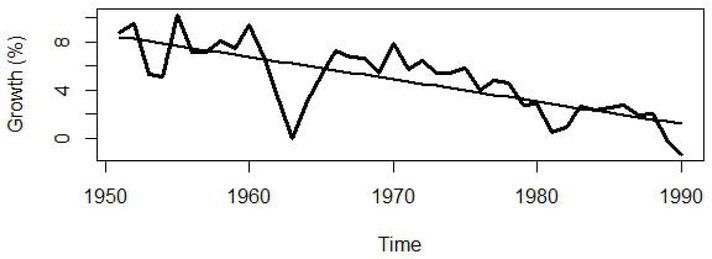
Figure 1
Changes in social product 1950–1989 in %
Source: Statistické ročenky Československé socialistické republiky 1971–1990
Table 1
Summary of the data and results (with five-year plans)
| Growth rates (%) | 1971–1975 | 1976–1980 | 1981–1985 | 1986–1990 | All periods average |
|---|---|---|---|---|---|
| GDP | 4.94 | 2.81 | 0.93 | 1.91 | 2.65 |
| GDP plan | 5 | 5 | 1.5−2.1 | 3.2 | |
| Labour | 0.48 | 0.74 | 0.52 | −0.21 | 0.39 |
| Labour productivity | 4.44 | 2.06 | 0.40 | 2.13 | 2.26 |
| Labour prod. plan | 4.75 | 4.55 | 1.4−2 | 2.9 | |
| Capital | 9.69 | 1.98 | −3.02 | 1.81 | 2.61 |
| TFP | −0.41 | 1.41 | 2.55 | 1.33 | 1.22 |
| Shares (%)* | |||||
| Extensity | 65.96 | 58.89 | 51.18 | 47.63 | 56.44 |
| Intensity | 34.04 | 41.11 | 48.82 | 52.37 | 43.56 |
[i] * – the overall shares are computed from absolute values.
Source: Authors; Zákon č. 115/1971 Sb.; 70/1976 Sb.; 125/1981 Sb.; č. 87/1986
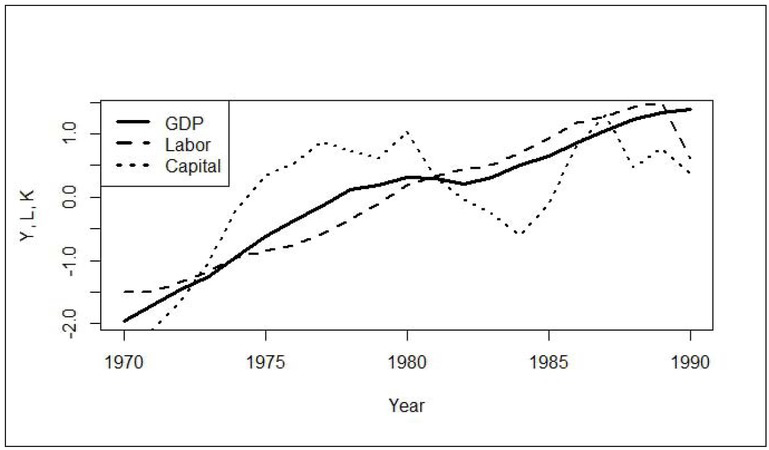
Figure 2
GDP, Labour, Capital (standardised)
Source: Authors
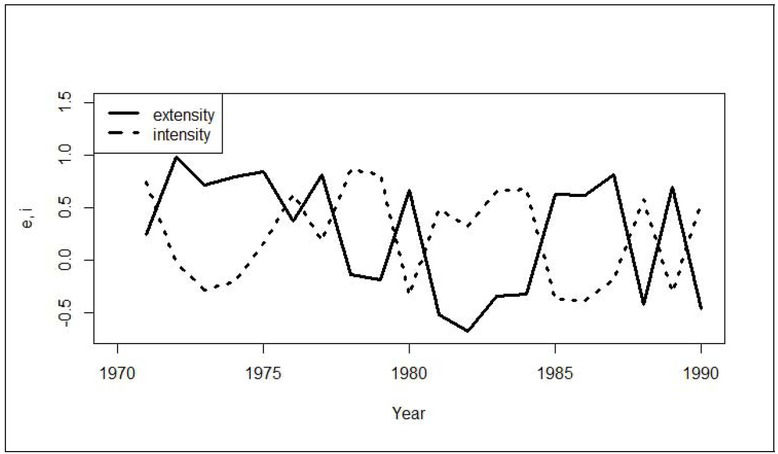
Figure 3
Extensity and intensity parameters
Source: Authors
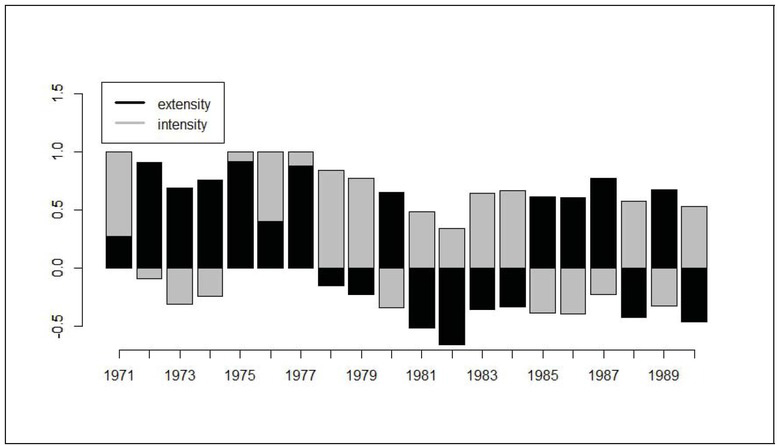
Figure 4
Growth composition
Source: Authors