
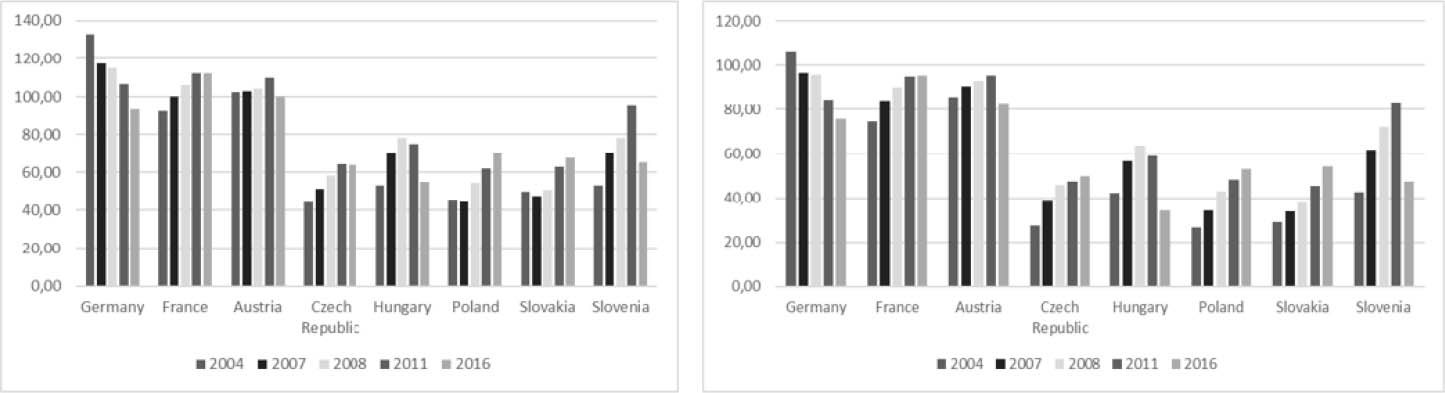
Figure 1
Banks’ total assets (left) and private credit (right) to the GDP (2004–2016)
Source: The World Bank's Global Financial Development database
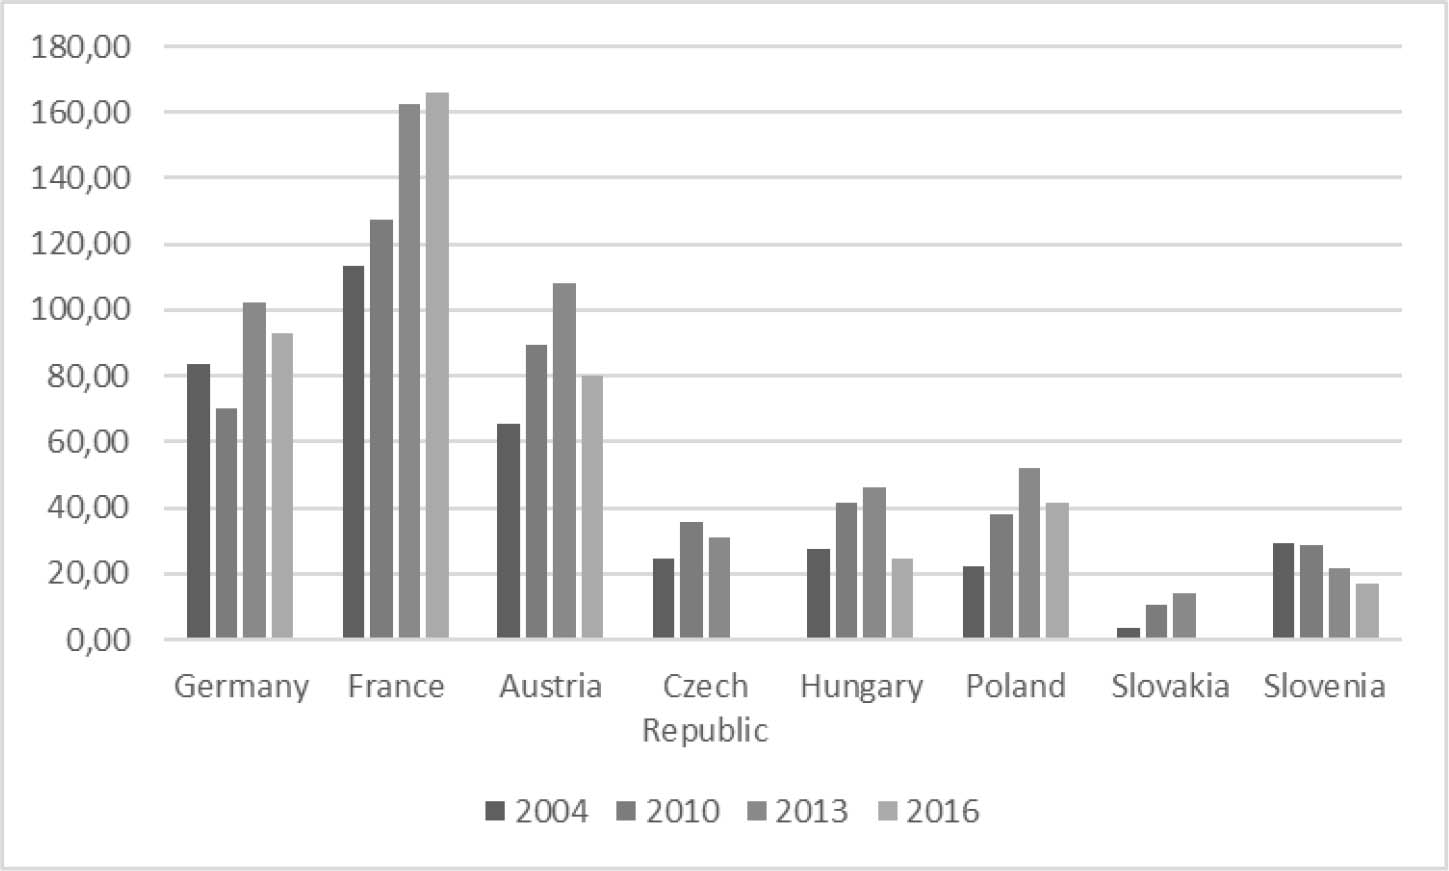
Figure 2
Joined capitalisation of the stock market and the private debt market to GDP (2004–2016)*
Sources: The World Bank's Global Financial Development database, the BIS’ Debt securities statistics and the World Bank's World Development Indicators
* for the Czech Republic and Slovakia data are available only until 2013
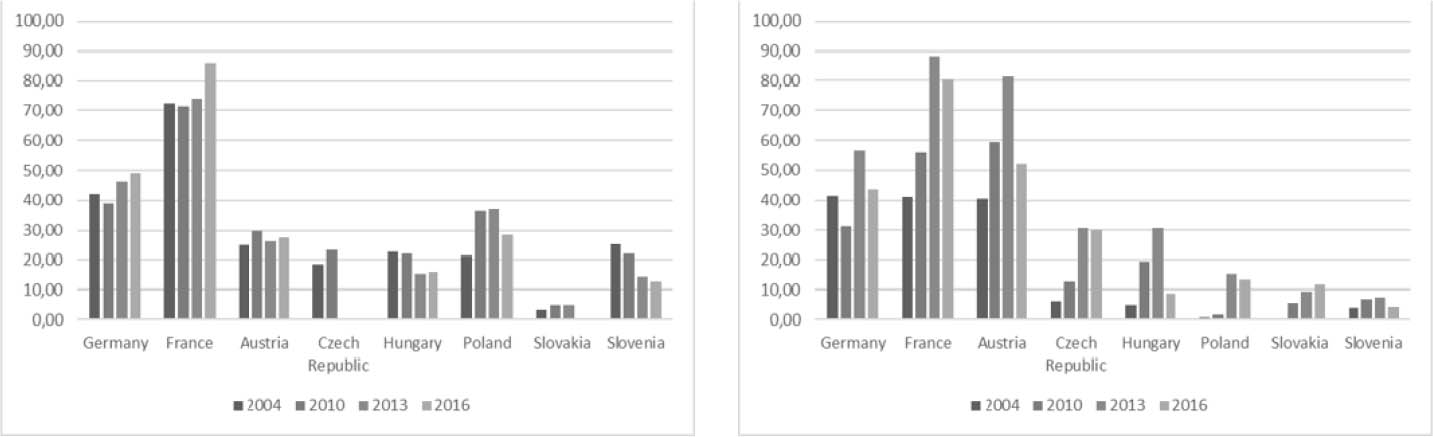
Figure 3
Stock market capitalisation (left) and corporate bond market capitalisation (right) to GDP (2004–2016)
Sources: The World Bank's Global Financial Development database, the BIS’ Debt securities statistics and the World Bank's World Development Indicators
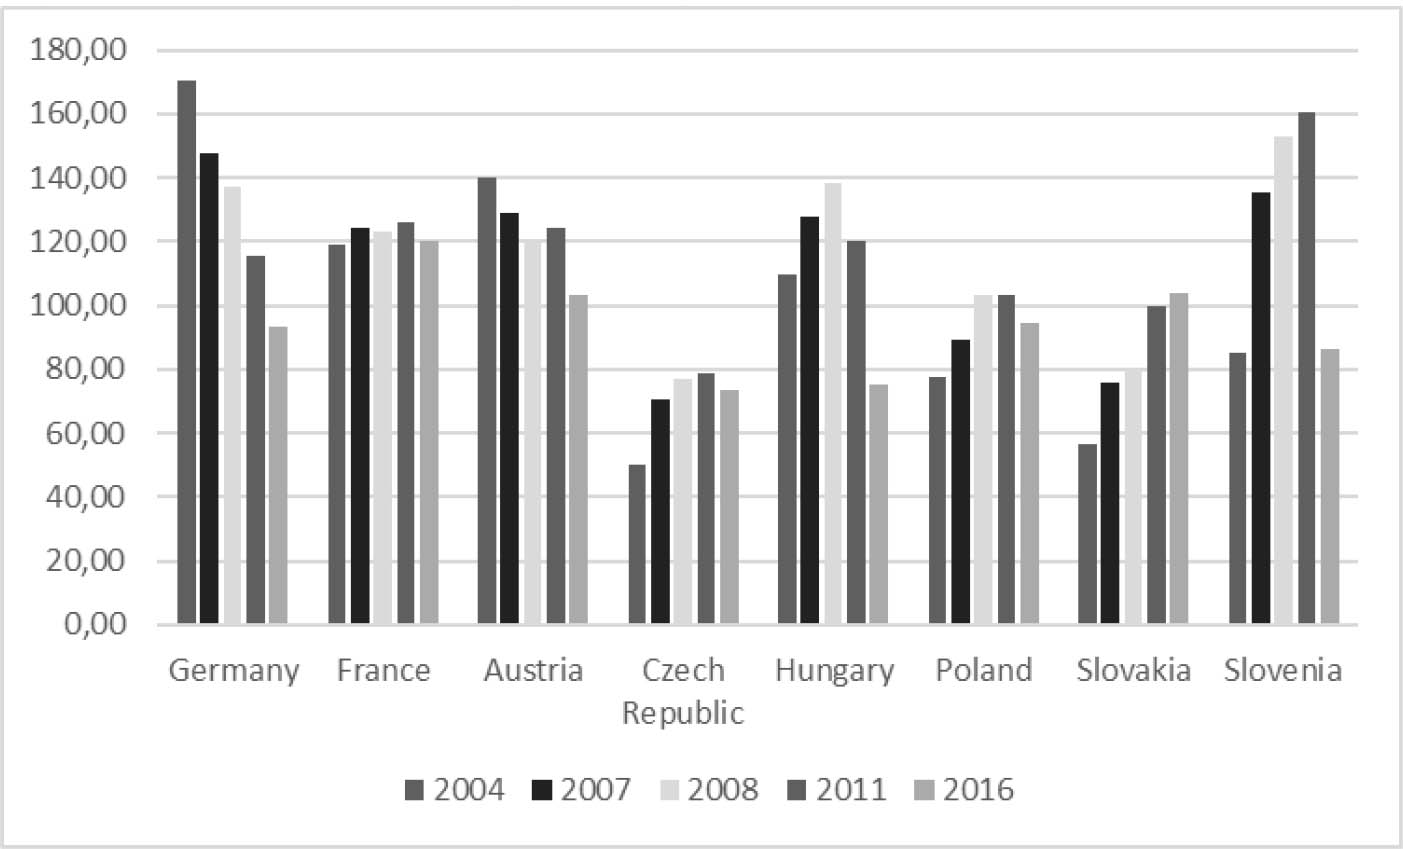
Figure 4
Loan-to-deposit ratio (2004–2016)
Source: The World Bank's Global Financial Development database
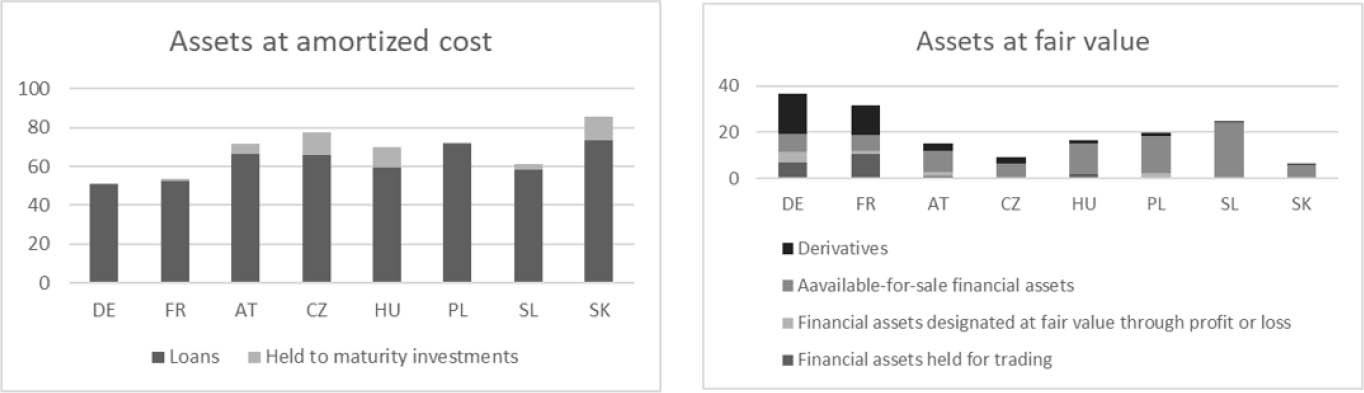
Figure 5
The breakdown of banks’ assets by valuation methods (2016 Q4)
Source: ESRB (2017 Table 3.3.)
Table 1
The size of the shadow banking system to GDP (%)