
Table 1.
Description of representative trajectories.
| Age | Never smoker/Never EVP user | Smoker/Never EVP user | Former smoker/Never EVP user | Never smoker/EVP user | Smoker/EVP user | Former smoker/EVP user | Never smoker/Former EVP user | Smoker/Former EVP user | Former smoker/Former EVP user |
|---|---|---|---|---|---|---|---|---|---|
| 18–20 | NVR; NVR | NVR; NVR | NVR; NVR | NVR; NVR | NVR; NVR | NVR; NVR | NVR; NVR | NVR; NVR | NVR; NVR |
| 21–30 | NVR; NVR | CUR; NVR | CUR; NVR | NVR; CUR | CUR; NVR | CUR; NVR | NVR; CUR | CUR; NVR | CUR; NVR |
| 31–40 | NVR; NVR | CUR; NVR | CUR; NVR | NVR; CUR | CUR; CUR | CUR; CUR | NVR; CUR | CUR; CUR | CUR; CUR |
| 41–50 | NVR; NVR | CUR; NVR | FMR;NVR | NVR; CUR | CUR; CUR | FMR; CUR | NVR; FMR | CUR; FMR | FMR; FMR |

Figure 1.
Observed and projected US adult smoking and vaping prevalence, 2016–2044.
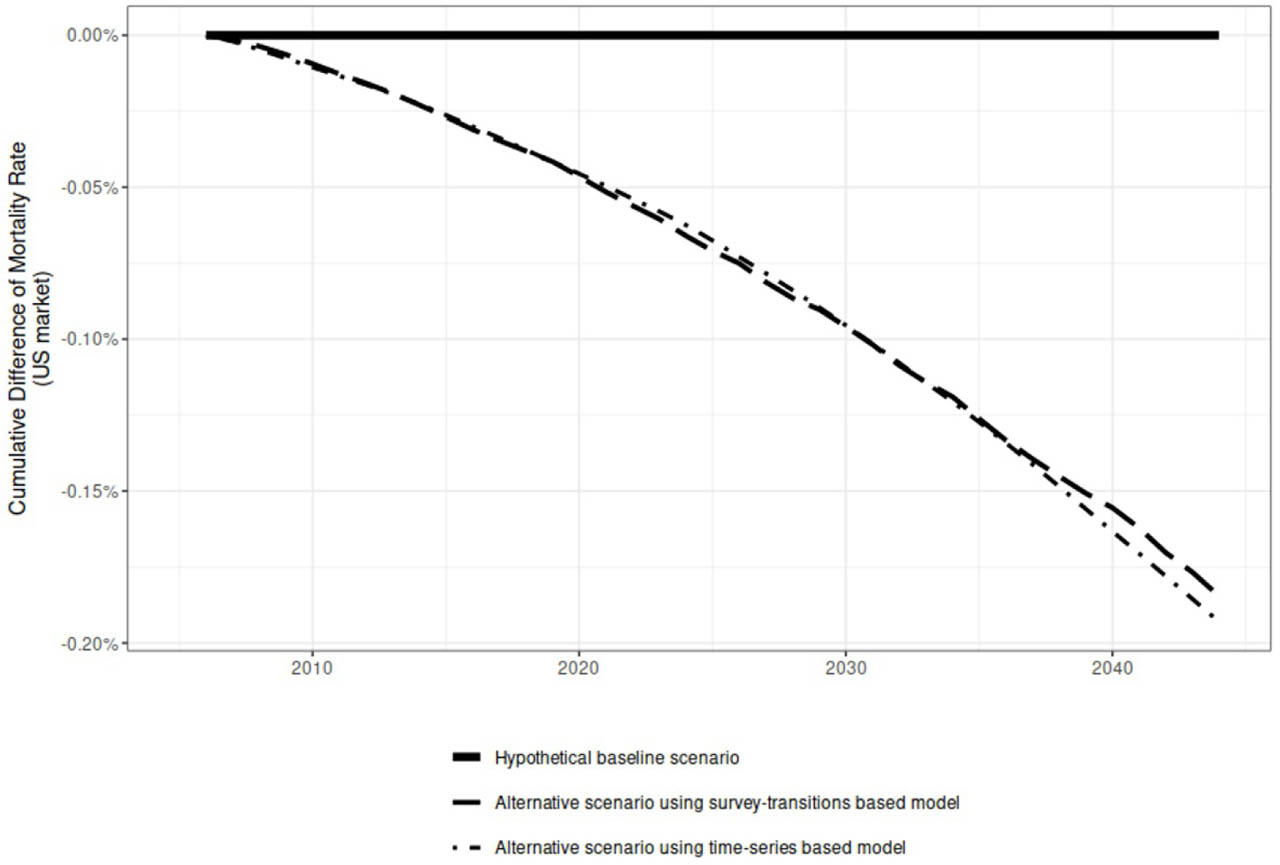
Figure 2.
Cumulative difference of mortality rate using different approaches (US market).
Table 2.
Sensitivity analysis of cumulative premature death differences between the baseline scenario and alternative scenarios across varying Excess Relative Risk (ERR) values by 2040.
| ERR | 5% | 10% | 20% | 50% |
|---|---|---|---|---|
| Cumulative difference of tobacco-related premature deaths (million) | 0.85 | 0.79 | 0.68 | 0.36 |