
Table 1.
The physical parameters of filter rods.
| Code | Tow specifications | Pressure drop (Pa) | Length (cm)a | Circumference (cm) |
|---|---|---|---|---|
| Rb | 3.0Y/32000 | 2900 | 12.0 | 2.42 |
| F001 | 3.0Y/35000 | 3293 | 12.0 | 2.42 |
| F002 | 3.0Y/35000 | 2680 | 10.0 | 2.42 |
| F003 | 3.0Y/34000 | 2800 | 10.0 | 2.41 |
| F004 | 3.0Y/34000 | 2700 | 10.0 | 2.41 |
| F005 | 3.0Y/34000 | 2800 | 10.0 | 2.41 |
| F006 | 3.0Y/35000 | 2900 | 10.0 | 2.41 |
| F007 | 3.0Y/32000 | 3500 | 10.8 | 2.41 |
| F008 | 4.8Y/22000 | 3400 | 12.0 | 1.98 |
| F009 | 5.1Y/22000 | 3400 | 12.0 | 1.98 |
| F010 | 5.8Y/22000 | 3400 | 12.0 | 1.98 |
| F011 | 5.8Y/26000 | 3400 | 12.0 | 1.98 |
| F012 | 5.8Y/26000 | 3470 | 12.0 | 1.98 |
| F013 | 5.8Y/26000 | 3670 | 12.0 | 1.98 |
| F014 | 5.8Y/26000 | 3725 | 12.0 | 1.98 |
| F015 | 5.8Y/26000 | 4053 | 12.0 | 1.98 |
| F016 | 6.0Y/17000 | 3790 | 12.0 | 1.70 |
| F017 | 8.0Y/15000 | 3140 | 12.0 | 1.70 |
| F018 | 8.0Y/15000 | 3400 | 12.0 | 1.70 |
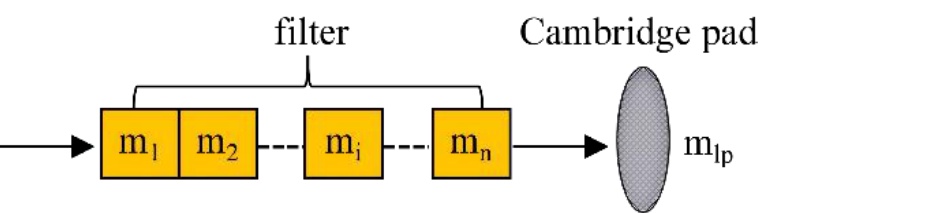
Figure 1.
Schematic diagram of smoke aerosol particles filtration in the filter.
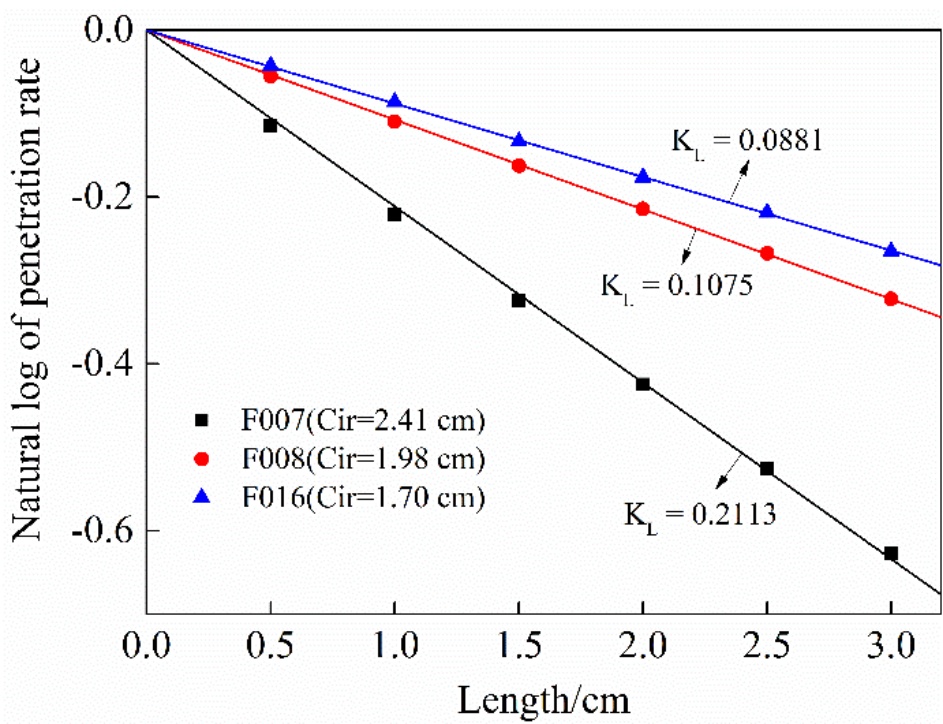
Figure 2.
Relation between the natural logarithm of smoke aerosol particles penetration rate and filter length.
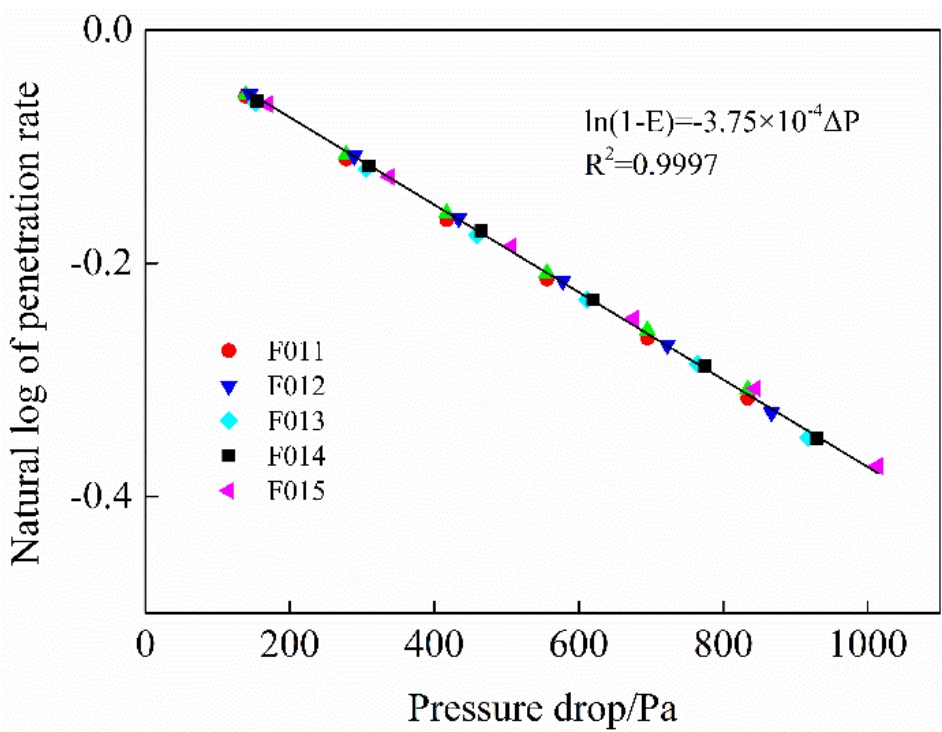
Figure 3.
Relation between the natural logarithm of smoke aerosol particles penetration rate and filter pressure drop.
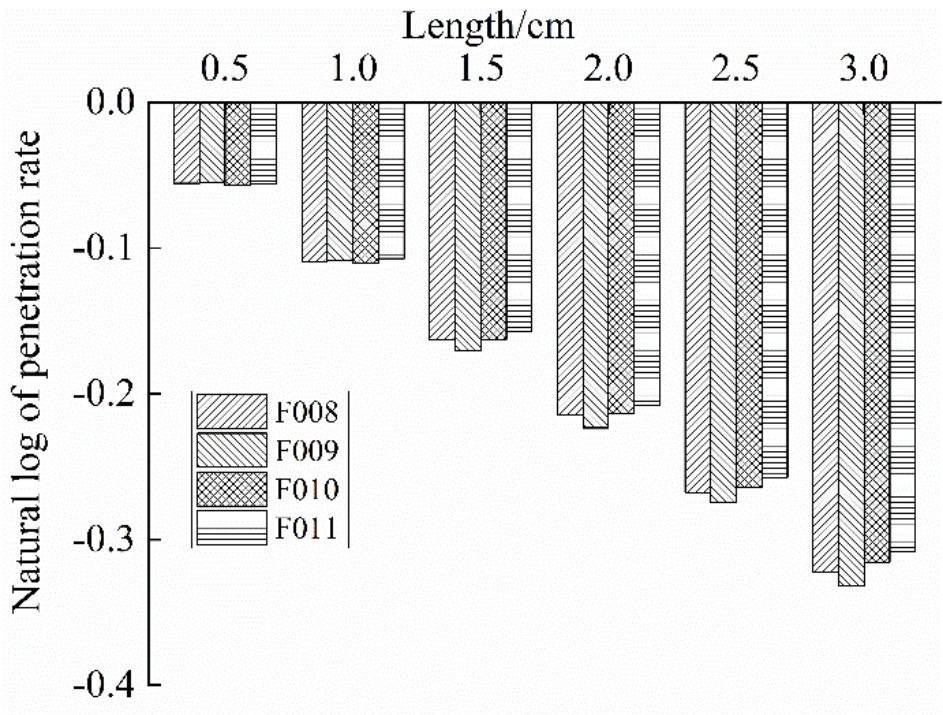
Figure 4.
Relation between the natural logarithm of smoke aerosol particles penetration rate and tow specifications.
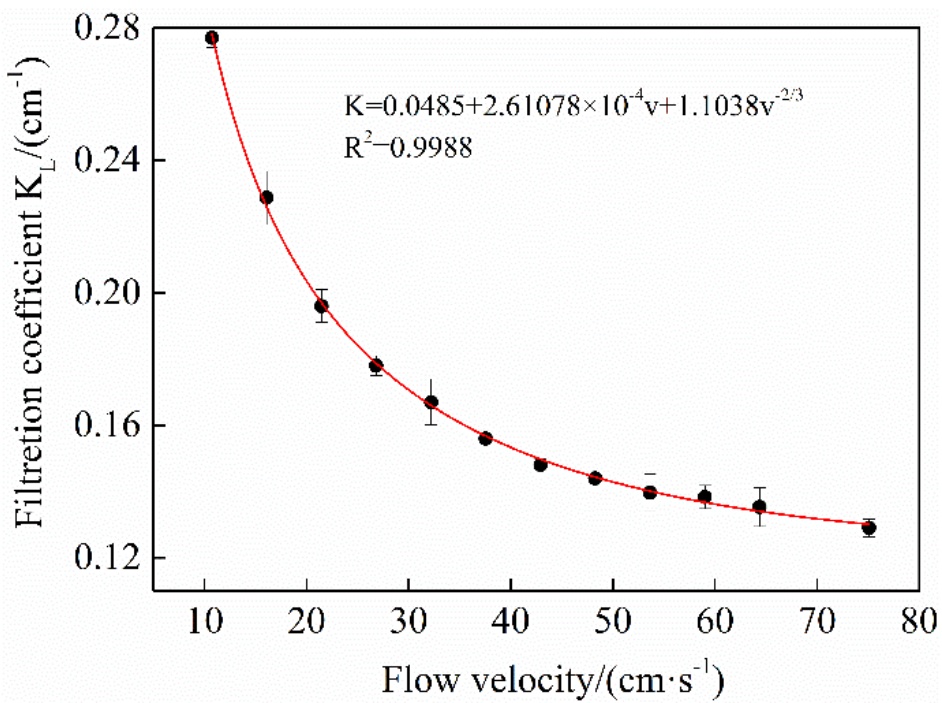
Figure 5.
Relation between filtration coefficient of smoke aerosol particles and flow velocity.
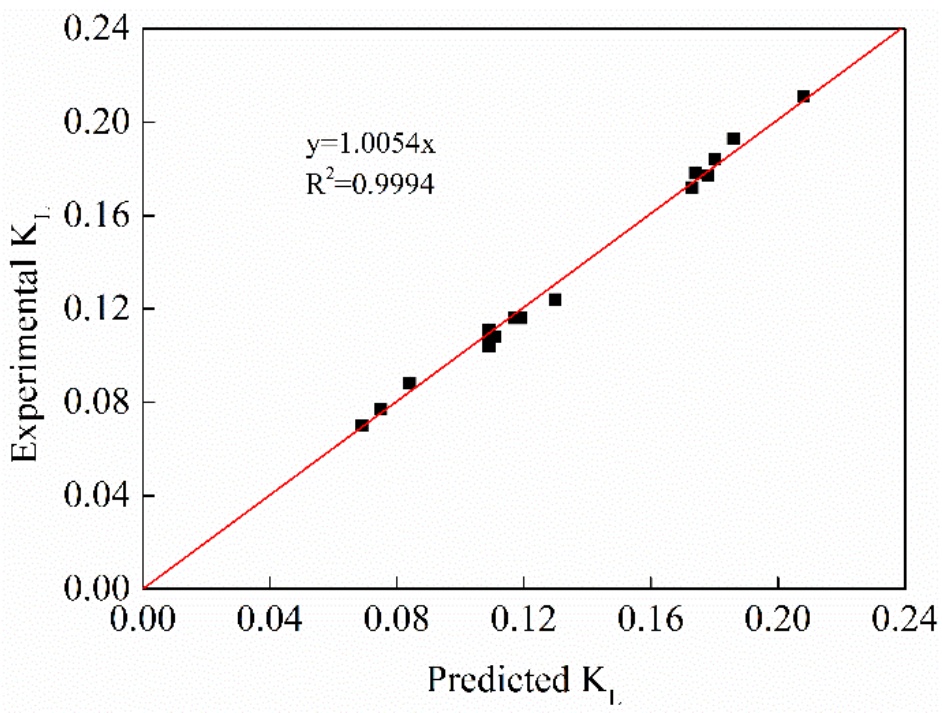
Figure 6.
Experimental values and predicted values of filtration coefficient on smoke aerosol particles.
Table 2.
Reported values (28) and predicted values of filtration efficiencies on “tar” in filters.
| Code | Circumference (cm) | Length (cm) | Pressure drop (cm × H2O) | Reported value of “tar” filtration efficiency (%) | Predicted value of “tar” filtration efficiency (%) | Deviation (%) |
|---|---|---|---|---|---|---|
| 1 | 2.485 | 2.100 | 109.0 | 55.6 | 57.1 | −2.66 |
| 2 | 2.192 | 2.100 | 138.0 | 53.0 | 53.4 | −0.71 |
| 3 | 2.349 | 2.100 | 107.0 | 52.0 | 50.9 | 2.05 |
| 4 | 2.476 | 1.500 | 55.0 | 36.4 | 34.0 | 6.64 |
| 5 | 2.476 | 2.100 | 90.0 | 51.0 | 49.9 | 2.13 |
| 6 | 2.476 | 2.700 | 113.0 | 56.6 | 57.4 | −1.40 |
| 7 | 2.490 | 2.100 | 67.0 | 44.0 | 40.7 | 7.47 |
| 8 | 2.448 | 1.500 | 42.0 | 27.2 | 26.5 | 2.70 |
| 9 | 2.448 | 2.100 | 57.0 | 36.9 | 34.6 | 6.27 |
| 10 | 2.448 | 2.700 | 76.0 | 43.3 | 42.7 | 1.46 |
| 11 | 2.352 | 2.100 | 98.0 | 47.4 | 48.0 | −1.31 |
| 12 | 2.475 | 2.100 | 66.0 | 41.9 | 39.7 | 5.16 |
| 13 | 2.574 | 2.100 | 62.0 | 45.6 | 41.2 | 9.75 |
| 14 | 2.481 | 2.100 | 61.0 | 43.7 | 37.6 | 14.01 |
| 15 | 2.438 | 2.438 | 50.0 | 32.3 | 30.8 | 4.65 |
| 16 | 2.438 | 2.438 | 68.0 | 40.8 | 38.9 | 4.72 |
| 17 | 2.336 | 2.336 | 61.0 | 35.8 | 33.0 | 7.94 |
| 18 | 2.480 | 2.480 | 54.0 | 36.9 | 34.1 | 7.65 |
| 19 | 2.588 | 2.588 | 44.0 | 36.5 | 31.8 | 13.00 |
| 20 | 2.479 | 2.479 | 48.4 | 33.2 | 31.1 | 6.21 |
| 21 | 2.481 | 2.481 | 126.0 | 57.9 | 61.6 | −6.35 |
| 22 | 2.341 | 2.341 | 117.0 | 53.1 | 53.2 | −0.16 |
| 23 | 2.475 | 2.475 | 133.0 | 55.2 | 63.3 | −14.72 |
| 24 | 2.475 | 2.475 | 144.0 | 61.2 | 66.2 | −8.24 |
| 25 | 2.475 | 2.475 | 187.0 | 69.9 | 75.6 | −8.14 |
| 26 | 2.441 | 2.441 | 93.0 | 50.3 | 49.1 | 2.37 |
| 27 | 2.479 | 2.300 | 65.0 | 45.2 | 38.9 | 13.98 |
| 28 | 2.479 | 2.900 | 76.0 | 47.8 | 43.8 | 8.43 |
| 29 | 2.470 | 2.300 | 50.0 | 32.3 | 31.3 | 3.18 |
| 30 | 2.584 | 2.300 | 80.0 | 49.6 | 49.3 | 0.61 |
| 31 | 2.477 | 2.300 | 70.0 | 44.5 | 41.1 | 7.67 |
| 32 | 2431 | 2.300 | 57.0 | 34.1 | 33.6 | 1.49 |
| 33 | 2.431 | 2.900 | 71.0 | 38.9 | 39.9 | −2.69 |
| 34 | 2.339 | 2.300 | 89.0 | 41.0 | 43.8 | −6.79 |
| 35 | 2.469 | 2.300 | 63.0 | 35.8 | 37.6 | −5.09 |
| 36 | 2.588 | 2.300 | 70.9 | 42.0 | 45.4 | −8.02 |