
1. INTRODUCTION
Fiber filters demonstrate high efficiency in capturing aerosol particles owing to their porous structure, while simultaneously maintaining a low pressure drop. Consequently, these filters are now extensively utilized across diverse fields, including air purification, industrial dust removal, and medical respiratory protection (1,2,3,4). As an innovative fiber filter material, cellulose acetate filters exhibit irreplaceable advantages in applications such as wastewater treatment or air purification, and in cigarette manufacturing, attributed to their unique properties – ease of processing, high biological safety, and thermal stability (5,6,7). Notably, cellulose acetate filters have become a pivotal technological strategy for reducing “tar” and other harmful components in cigarette smoke (8), the filtration properties of the filters directly affect the release of harmful smoke particulate matter, such as “tar” and nicotine. Investigating the filtration characteristics of particulate matter in cellulose acetate filters and then developing the corresponding prediction model for the filtration can provide a basis for parameter optimization during the filter design process. This will not only save time and material costs but also facilitate the iterative enhancement of cigarette filter designs towards precise harm control and digital design advancements.
However, current research on the filtration of smoke particulate matter by cellulose acetate filters has predominantly concentrated on experimental measurements (9,10,11,12). Norman et al. (9) utilized an ultraviolet (UV) spectrophotometric method to measure the amount of dry particulate matter captured by both the Cambridge pad and the cigarette filter, and subsequently determined the dry particulate matter filtration efficiency. Similarly, Shepperd et al. (10) employed the same UV method to quantify the “tar” filtration efficiency of cigarette filters. Wen et al. (11) utilized gas chromatography-flame ionization detector (GC-FID) to measure the nicotine content in both the filter and total particulate matter, thereby obtaining the nicotine filtration efficiency of filters. Nevertheless, these studies are confined to experimental measurement techniques. To obtain the filtration characteristics of filter samples with varying design parameters, experiments need to be repeatedly conducted, which is time-consuming and results in resource wastage. Establishing a prediction model for the filtration of particulate matter by filters can effectively address these issues.
Since particulate matter in smoke primarily propagates within the cigarette in the form of aerosol particles, numerous studies have explored the filtration of aerosol particles by fiber filters based on fluid dynamics theory (13,14,15,16,17,18). However, due to factors such as inter-fiber interactions, discrepancies between fiber shape/orientation and classical models, as well as the polydisperse nature of cigarette smoke aerosol particles (19–20), significant challenges remain in accurately predicting filtration efficiency. Therefore, employing empirical or semi-empirical filtration models to study the filtration processes of smoke aerosol particles still holds practical value. Keith et al. (21) designed and developed an aerosol generator to produce pyrene aerosol and studied the filtration efficiency of the aerosol versus particle size for various types of filters and at various flow rates. Nevertheless, the particle size stability and distribution range of this aerosol are different from those of cigarette smoke aerosol particles, thereby posing challenges for this method to accurately mirror the filtration behavior of smoke aerosol particles within filters. Dwyer et al. (22) introduced a particulate efficiency apparatus with an aerosol delay tube to allow vapor-liquid equilibrium to become established before the aerosol challenged the filter. By measuring the weight gains of the cigarette filter and the particulate filter pad, they analyzed the effects of filter length, filter pressure drop, and aerosol flow rate on particulate filtration. Although this approach minimized the influence of vapor condensation, it overlooked vapor adsorption onto cellulose acetate fibers and altered particle size distributions due to the equilibration time of the delay tube. These factors collectively lead to the inability to obtain accurate filtration properties of smoke aerosols. Additionally, the study solely focused on the filtration performance of king-size filters with a circumference of 2.47 cm, restricting its applicability in predicting the filtration efficiency of regular and superslim cigarette filters.
Solanesol, a high-content component in cigarette smoke with a boiling point of 686 °C and low volatility, serves as a typical marker for smoke particulate matter (23–24). This compound mainly exists in the form of particles in cigarette smoke aerosols. To eliminate interference from vapor-phase condensation/adsorption and mitigate the effects of smoke aging on aerosol particle size, thereby enabling the establishment of an accurate prediction model for the filtration of smoke aerosol particles by cellulose acetate filters, this study employed solanesol as a smoke aerosol particle marker, conducted cigarette puffing using a single-port smoking machine, and performed quantitative analysis of solanesol captured by the filter and Cambridge pad via HPLC-DAD (high-performance liquid chromatography-diode array detector). The influence of filter length, pressure drop, tow specifications (filament denier, cross-section shape, total denier), and flow velocity on the filtration of fresh smoke aerosol particles in cellulose acetate filter were systematically investigated. Based on these findings, a prediction model for the filtration of smoke aerosol particles by cellulose acetate filters was developed, incorporating parameters of filter circumference, pressure drop, and flow velocity, and subsequently validated through experimental testing. The model was further extended to predict the filtration efficiency of “tar”, demonstrating its applicability and accuracy in predicting particulate matter filtration across diverse unknown filter samples. This work can not only provide technical support for designing cigarettes of low “tar” and other harmful components, but also provides valuable guidance for the development of aerosol filtration models in the atmospheric and industrial fields.
2. EXPERIMENTAL
2.1. Cigarette samples
Cigarette samples with conventional cellulose acetate filters of various circumference, length, pressure drop and tow specifications were prepared for testing throughout the experiments. The filter rod design specifications are shown in Table 1.
Table 1.
The physical parameters of filter rods.
| Code | Tow specifications | Pressure drop (Pa) | Length (cm)a | Circumference (cm) |
|---|---|---|---|---|
| Rb | 3.0Y/32000 | 2900 | 12.0 | 2.42 |
| F001 | 3.0Y/35000 | 3293 | 12.0 | 2.42 |
| F002 | 3.0Y/35000 | 2680 | 10.0 | 2.42 |
| F003 | 3.0Y/34000 | 2800 | 10.0 | 2.41 |
| F004 | 3.0Y/34000 | 2700 | 10.0 | 2.41 |
| F005 | 3.0Y/34000 | 2800 | 10.0 | 2.41 |
| F006 | 3.0Y/35000 | 2900 | 10.0 | 2.41 |
| F007 | 3.0Y/32000 | 3500 | 10.8 | 2.41 |
| F008 | 4.8Y/22000 | 3400 | 12.0 | 1.98 |
| F009 | 5.1Y/22000 | 3400 | 12.0 | 1.98 |
| F010 | 5.8Y/22000 | 3400 | 12.0 | 1.98 |
| F011 | 5.8Y/26000 | 3400 | 12.0 | 1.98 |
| F012 | 5.8Y/26000 | 3470 | 12.0 | 1.98 |
| F013 | 5.8Y/26000 | 3670 | 12.0 | 1.98 |
| F014 | 5.8Y/26000 | 3725 | 12.0 | 1.98 |
| F015 | 5.8Y/26000 | 4053 | 12.0 | 1.98 |
| F016 | 6.0Y/17000 | 3790 | 12.0 | 1.70 |
| F017 | 8.0Y/15000 | 3140 | 12.0 | 1.70 |
| F018 | 8.0Y/15000 | 3400 | 12.0 | 1.70 |
2.2. Smoke collection and sample preparation
The cigarettes were smoked on a single-channel smoking machine (Zhengzhou Jiade Electromechanical Technology Co., Ltd., Zhengzhou, China) under the conditions of a 2-sec puff duration, 4 puffs/min and 10 puffs per cigarette. After the puffing was completed, the cigarette filter was detached. The Cambridge pad was removed after capturing mainstream smoke from four cigarettes.
Using a fully automatic multi-functional segmented cigarette cutting machine (Zhengzhou Jiade Electromechanical Technology Co., Ltd., Zhengzhou, China), the filters of the four cigarettes were cut transversely into 0.5 cm segments each. The corresponding filter segments from the tobacco end to the mouth end of all four cigarettes were merged. The merged filter segments were then placed into separate 25 mL conical flasks, followed by the addition of 10 mL methanol and 30 min of ultrasonication. Simultaneously, the Cambridge pad was transferred into a 50 mL conical flask, supplemented with 20 mL methanol, and subjected to 30 min of ultrasonication. The resulting extracts were filtered through a nylon syringe filter with a pore size of 0.22 µm and transferred to a storage bottle. Sequentially, the puff volume was changed to 15, 20, 25, 30, 35, 40, 45, 50, 55, 60, and 70 mL, while keeping all other parameter settings and experimental procedures unchanged, in order to obtain the filtration data of solanesol in smoke by the filter under different puff volumes.
Cigarettes with an average mass of ± 20 mg and an average draw resistance of ± 30 Pa were selected as test samples. All samples were allowed to condition for 48 h at 60 ± 5% relative humidity and at a temperature of 22 ± 2 °C before testing.
2.3. Instrument analysis
Solanesol was quantified using HPLC-DAD (Agilent 1200, Santa Clara, CA, USA) method based on the procedure outlined in reference (25). More specifically, the separation was performed on a Waters XBridge C18 column (4.6 × 75 mm, 3.5 μm, Waters Corporation, Milford, MA, USA) with methanol (HPLC grade, ≥ 99.9%, Merck KGaA, Darmstadt, Germany) as the mobile phase under isocratic elution at a flow rate of 1.0 mL/min. The column oven temperature was maintained at 30 ℃, the injection volume was 10 μL, the detection wavelength was set to 210 nm, and the run time was 9 min.
The standard stock solution for solanesol (≥ 97.0%, TCI (Shanghai) Development Co., Ltd., Shanghai, China) was prepared in methanol at a concentration of 500 mg/L. Subsequently, solvent working calibration solutions of 100, 50, 30, 20, 10, 4, 2, and 1 mg/L were prepared by appropriate dilution of the standard stock solution with methanol.
2.4. Filtration and penetration efficiencies
As shown in Figure 1, it is assumed that the filter is transversely divided into n segments of equal length, where mi represents the mass of smoke aerosol particles filtered by the ith filter segment, and mlp denotes the mass of smoke aerosol particles captured by the Cambridge pad. The arrow indicates the direction of smoke aerosol flow.
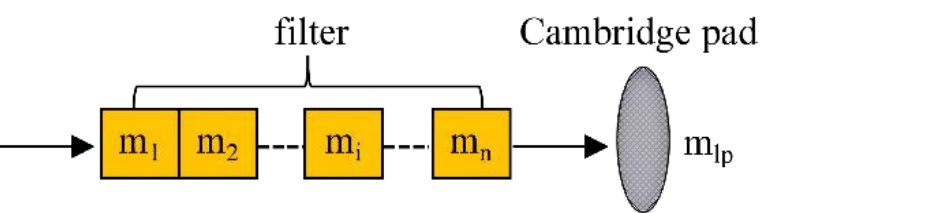
Figure 1.
Schematic diagram of smoke aerosol particles filtration in the filter.
Based on the mass (mi) filtered by each filter segment and the mass (mlp) captured by the Cambridge pad, the filtration efficiency (E) and penetration rate (1 – E) from the 1st to the ith filter segment can be calculated using the following formulas respectively:
3. RESULTS AND DISCUSSION
3.1. Effect of filter length on smoke aerosol particles filtration
Reference 22 indicates that the filtration of aerosol particle by filters follows the principles of first-order kinetic equations. Consequently, the relationship between aerosol particle penetration rate (1–E) and filter length (L) can be expressed by Equation [3]:
where KL represents the filtration coefficient. Under a puff volume of 35 mL, the relationship between solanesol penetration rate and the filter length of cigarettes with different circumferences (king-size, regular, and superslim) was investigated, as illustrated in Figure 2. For filters of different circumferences, the natural logarithm of the solanesol penetration rate exhibits a linear relationship with filter length, with the line passing through the origin, which is consistent with the description of Equation (3), and also indicates that there is no influence of vapor phase condensation/adsorption. The slope of the fitting curve represents the filtration coefficient, revealing that king-size cigarette filters demonstrate the highest filtration coefficient while superslim filters show the lowest. This indicates that larger filter circumferences result in lower smoke aerosol particles penetration rate per unit filter length – or equivalently, higher filtration efficiency.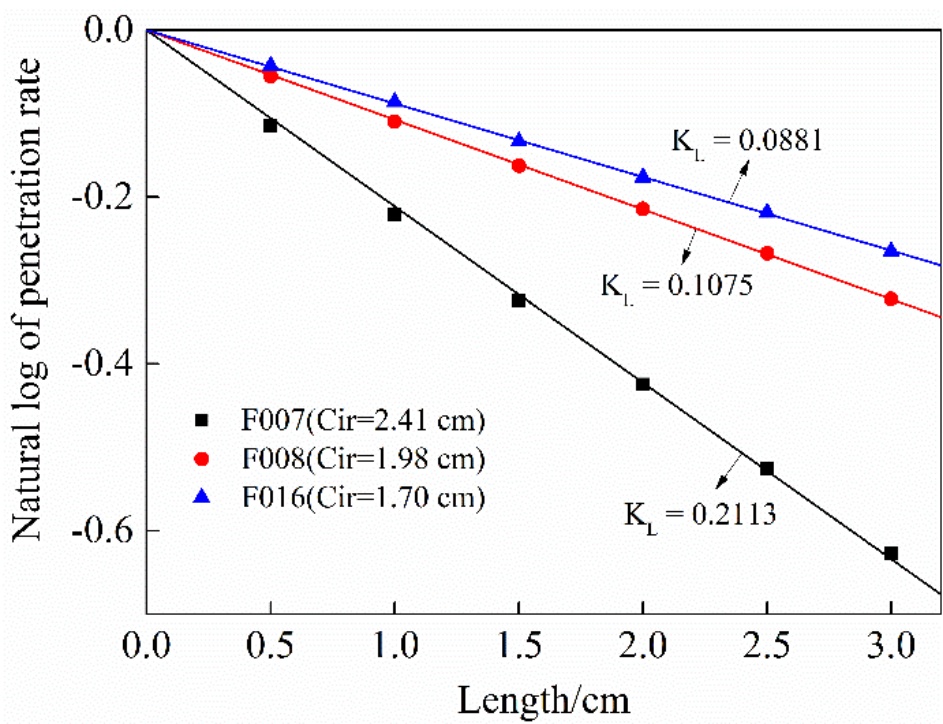
Figure 2.
Relation between the natural logarithm of smoke aerosol particles penetration rate and filter length.
3.2. Effect of filter pressure drop on smoke aerosol particles filtration
For a given filter rod, when the puff flow rate remains constant, the pressure drop (ΔP) across the filter is linearly proportional to its length. Based on this relationship, the length variable in Equation [3] can be substituted with the pressure drop variable, thereby deriving the relationship between aerosol particle penetration rate (1 – E) and filter pressure drop (ΔP), as expressed in Equation [4]:
where Kp represents the filtration coefficient per unit pressure drop. Under a puff volume of 35 mL, the relationship between solanesol penetration rate and pressure drop was analyzed for five filter rods with identical circumferences but varying pressure drops, as presented in Figure 3. Data points marked with the same symbol represent measurements from the same filter at different lengths. As shown in the figure, all data points for the five filter rods align along a single straight line, indicating that under identical puff volumes, filters with the same circumference but different pressure drops exhibit a consistent linear correlation between the natural logarithm of smoke aerosol particles penetration rate and filter pressure drop. In other words, at a constant puff flow rate, filters with varying pressure drops share identical Kp values.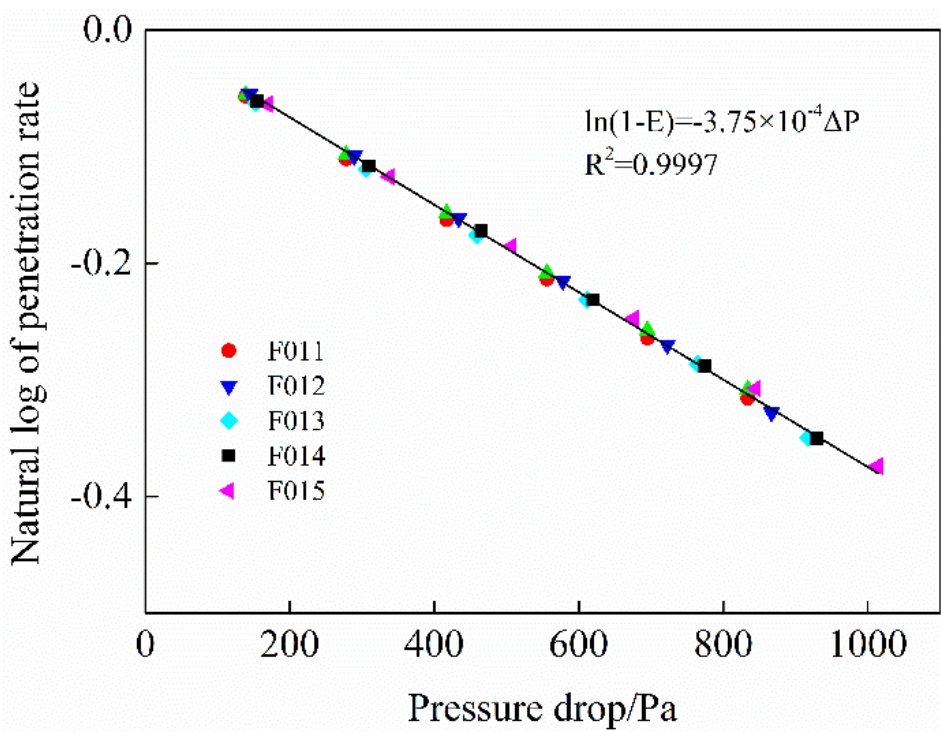
Figure 3.
Relation between the natural logarithm of smoke aerosol particles penetration rate and filter pressure drop.
Further, by combining Equations [3] and [4], we can obtain:
Given the invariance of Kp under identical puff flow rates, the filtration coefficient per unit length (KL) exhibits linear proportionality to the pressure drop per unit length (ΔP/L) across different filter rods. Consequently, for any filter rod with a constant circumference, the smoke aerosol particles filtration efficiency can be predicted based on its pressure drop characteristics.
3.3. Effect of filter tow specifications on smoke aerosol particles filtration
As illustrated in Figure 4, the smoke aerosol particles filtration efficiencies of four filter rods – each with identical pressure drops and circumferences but differing tow specifications – were assessed at a puff volume of 35 mL across various filter lengths. It is evident that at a constant filter length, the filters made of four kinds of tow specifications exhibited nearly identical smoke aerosol particles penetration efficiencies, indicating comparable filtration efficiencies. Therefore, when pressure drops are equivalent, tow specifications have no significant impact on smoke aerosol particles filtration performance.
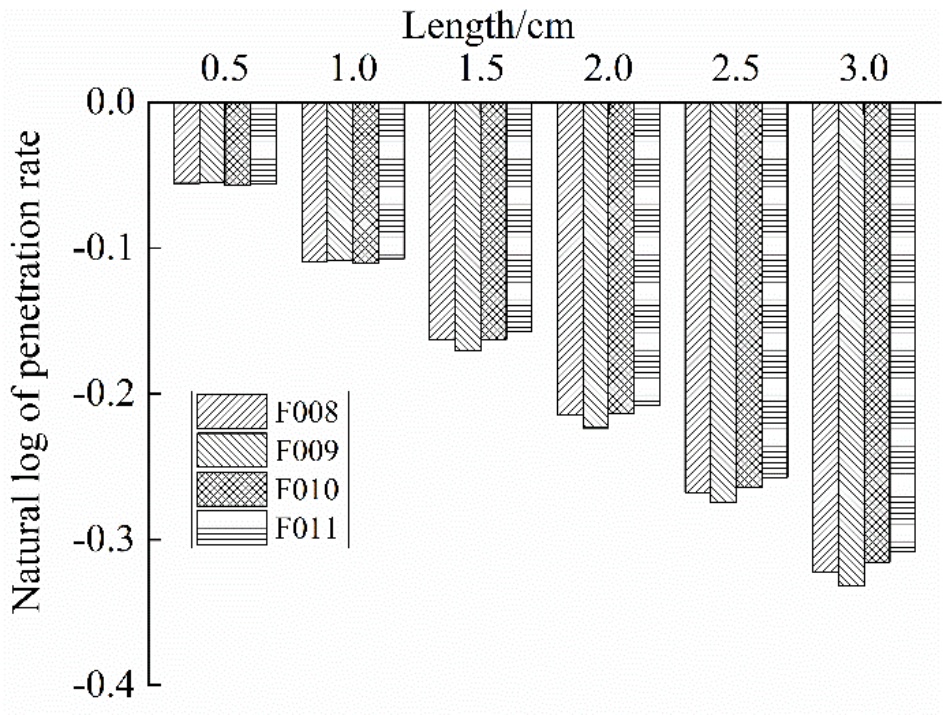
Figure 4.
Relation between the natural logarithm of smoke aerosol particles penetration rate and tow specifications.
3.4. Effect of flow velocity on smoke aerosol particles filtration
Magee et al. (26) consider diffusion, interception, and impaction as the dominant filtration mechanisms of filters for aerosol particles, and developed a relationship describing the filtration efficiency of a filter and the flow rate (Q) of the aerosol passing through it:
The first term on the right-hand side of this equation (C0L) represents the interception factor, which is independent of flow rate; the second term (C1LQ) is the impaction contribution; and the third term (C2LQ−2/3) accounts for the diffusion.
By substituting the expression of ln(1 – E) in Equation [3], namely −KLL, into the left-hand side of Equation [6], the following expression for the relationship between the filtration coefficient and flow rate of aerosol was obtained:
For a given filter rod with a fixed cross-sectional area, the flow rate is directly proportional to the flow velocity. Therefore, the flow rate term (Q) in Equation 7 can be equivalently expressed in terms of flow velocity (v), resulting in Equation [8]:
An investigation was carried out using cigarette samples rolled with a reference filter rod R to explore the variation pattern of the solanesol filter filtration coefficient within the puff volume range of 10 to 70 mL. Additionally, based on the cross-sectional area of the filter rod, the corresponding average flow velocities under different puff volumes were calculated, and the data of the filtration coefficient and flow velocity were plotted in Figure 5. The data in the figure indicate that as the flow velocity increases, a gradual decrease is observed in the filtration coefficient of smoke aerosol particles. Specifically, the filtration coefficient of smoke aerosol particles drops markedly at flow velocities between 10 and 40 cm/s, whereas the rate of decline slows considerably when the flow velocity rises from 40 to 80 cm/s.
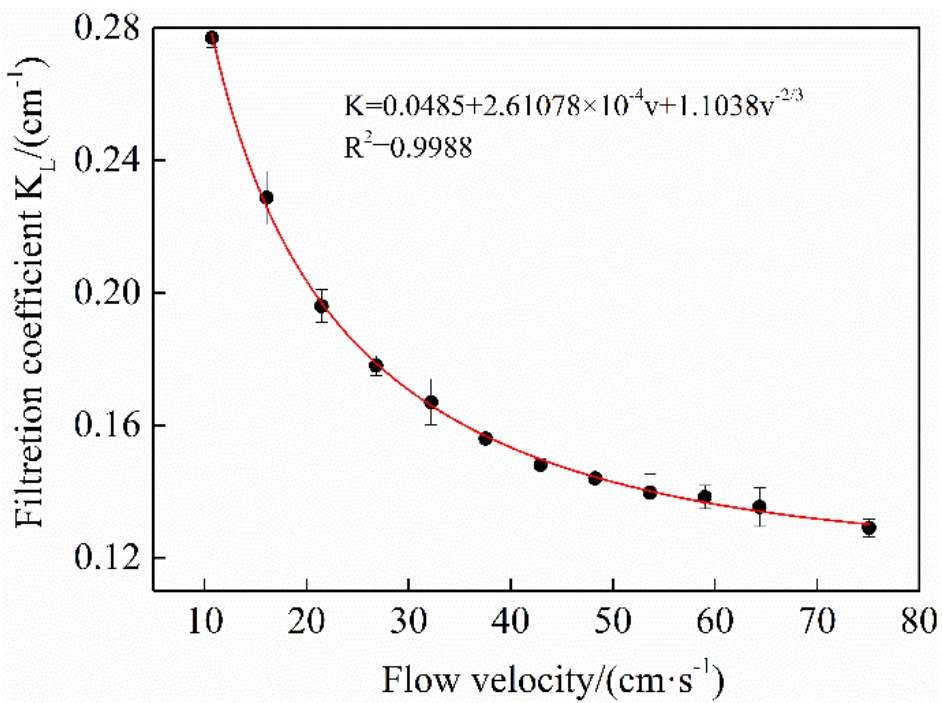
Figure 5.
Relation between filtration coefficient of smoke aerosol particles and flow velocity.
The data presented in Figure 5 were analyzed using least-squares fitting, as outlined in Equation [8], to ascertain the coefficients. Following this analysis, a formula was derived that characterizes the relationship between the smoke aerosol particles filtration coefficient and flow velocity for the reference filter rod R:
3.5. Filtration prediction model for smoke aerosol particles in cellulose acetate filters
From the aforementioned analysis, it is evident that at a constant flow velocity, the filtration coefficient is linearly proportional to the pressure drop per unit length of the filter rod. Assuming that the pressure drop per unit length of the reference filter rod R is denoted as ∆PR, and that of the unknown filter rod is denoted as ∆Px, the filtration coefficient of the unknown filter rod x can be derived as follows:
However, in accordance with the stipulations outlined in GB/T 22838.5-2024 (27), the pressure drop across filter rods is assessed at a standard flow rate of 17.5 mL/s. Consequently, when there is a discrepancy between the circumferences of the reference filter rod and the unknown filter rod, their respective flow velocities will differ. In such instances, Equation [10] cannot be directly utilized to determine the filtration coefficient of the unknown filter rod. Instead, it is essential to calibrate the pressure drop values for both filter rods to ensure they are measured at an equivalent flow velocity.
Assume that the circumferences of the reference filter rod and the unknown filter rod are CR and Cx, respectively. Given that filter rods can be approximated as cylinders, their cross-sectional areas (AR and Ax) can be derived from their circumferences. Under a constant flow rate of 17.5 mL/s, the flow velocities (vR and vx) for the reference and unknown filter rods can be calculated using the formula v = Q/A, where Q represents the flow rate and A is the cross-sectional area. Therefore, the pressure drop per unit length of the reference filter rod (∆P′R) and the unknown filter rod (∆P′x) at a uniform flow velocity can be expressed as shown in Equation [11] and [12], respectively:
Thus, the corrected filtration coefficient for the unknown filter rod is determined as follows:
As shown in Table 1, ∆PR = 242 Pa/cm and CR = 2.42 cm. When Cx = CR, Equation [13] becomes identical to Equation [10]. Therefore, Equation [13] enables the prediction of the filtration coefficient for filter rod samples with varying circumferences and pressure drops at any arbitrary flow velocity.
Furthermore, by substituting the filtration coefficient predicted by Equation [13] and the length of the unknown filter rod (L) into Equation [3], the filtration efficiency of smoke aerosol particles in the filter rod can be determined, as expressed in Equation [14].
3.6. Verification of the prediction model for the filtration of smoke aerosol particles
As presented in Table 1, some king-size, regular, and superslim filter rod samples were selected. The smoke aerosol particles filtration coefficients for samples numbered F001 to F018 were experimentally determined using the methodologies outlined in Sections 2.2 to 2.3 and processed using the data analysis approach described in Section 2.4. Simultaneously, the filtration coefficients of these unknown filter rods were predicted by using Equation [13]. With the predicted values from the filtration model plotted on the x-axis and the experimental values on the y-axis, the data were visualized in Figure 6. Linear regression analysis of the data in Figure 6 yielded a straight line with a slope of 1.0054 passing through the origin, and the coefficient of determination (R2) exceeded 0.999. Further calculations revealed that the relative deviations between predicted and experimental filtration coefficients for all samples remained below 5%. These findings demonstrated that the filtration model exhibited excellent predictive capability for smoke aerosol particles filtration coefficients across filter rod samples of varying pressure drops and circumferences.
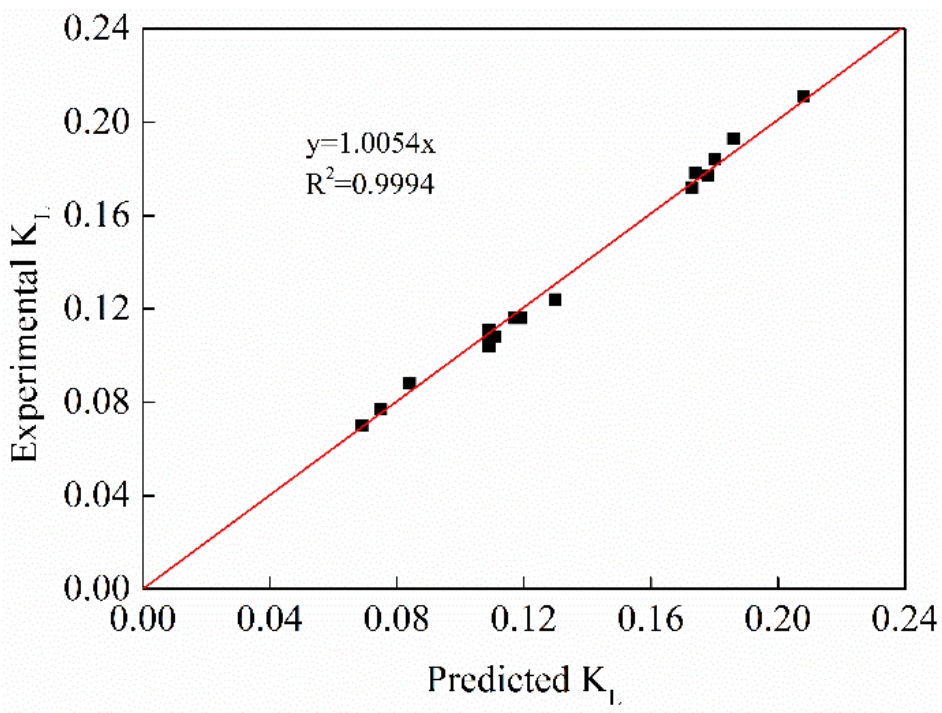
Figure 6.
Experimental values and predicted values of filtration coefficient on smoke aerosol particles.
3.7. Application of the filtration model in the prediction of “tar” filtration efficiency
To verify the applicability and accuracy of the established prediction model for smoke aerosol particles filtration in predicting the filtration efficiency of smoke particulate matter by cellulose acetate filters, this model was combined with the first-order kinetic filtration equation to predict the “tar” filtration efficiencies of various filter rod samples reported in Reference (28). The predicted values were then compared with the values from the reference, as summarized in Table 2. The data indicate that the deviations between predicted and reported values remain below 15% for all samples, with 89% of the samples exhibiting prediction deviations of less than 10%. These findings demonstrate that the filtration model developed in this study can accurately predict the “tar” filtration efficiency of filter rod samples. Therefore, the results confirm the model’s suitability for predicting the filtration efficiency of smoke particulate matter by cellulose acetate filters.
Table 2.
Reported values (28) and predicted values of filtration efficiencies on “tar” in filters.
| Code | Circumference (cm) | Length (cm) | Pressure drop (cm × H2O) | Reported value of “tar” filtration efficiency (%) | Predicted value of “tar” filtration efficiency (%) | Deviation (%) |
|---|---|---|---|---|---|---|
| 1 | 2.485 | 2.100 | 109.0 | 55.6 | 57.1 | −2.66 |
| 2 | 2.192 | 2.100 | 138.0 | 53.0 | 53.4 | −0.71 |
| 3 | 2.349 | 2.100 | 107.0 | 52.0 | 50.9 | 2.05 |
| 4 | 2.476 | 1.500 | 55.0 | 36.4 | 34.0 | 6.64 |
| 5 | 2.476 | 2.100 | 90.0 | 51.0 | 49.9 | 2.13 |
| 6 | 2.476 | 2.700 | 113.0 | 56.6 | 57.4 | −1.40 |
| 7 | 2.490 | 2.100 | 67.0 | 44.0 | 40.7 | 7.47 |
| 8 | 2.448 | 1.500 | 42.0 | 27.2 | 26.5 | 2.70 |
| 9 | 2.448 | 2.100 | 57.0 | 36.9 | 34.6 | 6.27 |
| 10 | 2.448 | 2.700 | 76.0 | 43.3 | 42.7 | 1.46 |
| 11 | 2.352 | 2.100 | 98.0 | 47.4 | 48.0 | −1.31 |
| 12 | 2.475 | 2.100 | 66.0 | 41.9 | 39.7 | 5.16 |
| 13 | 2.574 | 2.100 | 62.0 | 45.6 | 41.2 | 9.75 |
| 14 | 2.481 | 2.100 | 61.0 | 43.7 | 37.6 | 14.01 |
| 15 | 2.438 | 2.438 | 50.0 | 32.3 | 30.8 | 4.65 |
| 16 | 2.438 | 2.438 | 68.0 | 40.8 | 38.9 | 4.72 |
| 17 | 2.336 | 2.336 | 61.0 | 35.8 | 33.0 | 7.94 |
| 18 | 2.480 | 2.480 | 54.0 | 36.9 | 34.1 | 7.65 |
| 19 | 2.588 | 2.588 | 44.0 | 36.5 | 31.8 | 13.00 |
| 20 | 2.479 | 2.479 | 48.4 | 33.2 | 31.1 | 6.21 |
| 21 | 2.481 | 2.481 | 126.0 | 57.9 | 61.6 | −6.35 |
| 22 | 2.341 | 2.341 | 117.0 | 53.1 | 53.2 | −0.16 |
| 23 | 2.475 | 2.475 | 133.0 | 55.2 | 63.3 | −14.72 |
| 24 | 2.475 | 2.475 | 144.0 | 61.2 | 66.2 | −8.24 |
| 25 | 2.475 | 2.475 | 187.0 | 69.9 | 75.6 | −8.14 |
| 26 | 2.441 | 2.441 | 93.0 | 50.3 | 49.1 | 2.37 |
| 27 | 2.479 | 2.300 | 65.0 | 45.2 | 38.9 | 13.98 |
| 28 | 2.479 | 2.900 | 76.0 | 47.8 | 43.8 | 8.43 |
| 29 | 2.470 | 2.300 | 50.0 | 32.3 | 31.3 | 3.18 |
| 30 | 2.584 | 2.300 | 80.0 | 49.6 | 49.3 | 0.61 |
| 31 | 2.477 | 2.300 | 70.0 | 44.5 | 41.1 | 7.67 |
| 32 | 2431 | 2.300 | 57.0 | 34.1 | 33.6 | 1.49 |
| 33 | 2.431 | 2.900 | 71.0 | 38.9 | 39.9 | −2.69 |
| 34 | 2.339 | 2.300 | 89.0 | 41.0 | 43.8 | −6.79 |
| 35 | 2.469 | 2.300 | 63.0 | 35.8 | 37.6 | −5.09 |
| 36 | 2.588 | 2.300 | 70.9 | 42.0 | 45.4 | −8.02 |
4. CONCLUSIONS
The influences of filter length, pressure drop, tow specifications, and flow velocity on smoke aerosol particle filtration by cellulose acetate filters were investigated. The results revealed that filter length, pressure drop, and flow velocity significantly affected filtration efficiency. Specifically, filter length and pressure drop per unit filter length exhibited a positive correlation with smoke aerosol particle filtration efficiency, while flow velocity demonstrated a negative correlation. In contrast, tow specifications had minimal impact on smoke aerosol particle filtration. Based on the relationship between aerosol filtration coefficients and flow velocities established for the reference filter rod, combined with the calibration of pressure drop per unit filter length for unknown filter rods, a prediction model for smoke aerosol particle filtration coefficients of unknown filter rods was developed. Model validations of smoke aerosol particle filtration coefficients were conducted for filter rod samples with varying circumferences and pressure drops. The results confirmed that the developed filtration model could accurately predict the smoke aerosol particle filtration coefficients of actual filter rod samples. By integrating the developed filtration model with a first-order kinetic filtration equation, “tar” filtration efficiencies were predicted for filter rod samples reported in (28). The close agreement between predicted values and those reported demonstrated the model’s accuracy in predicting “tar” filtration efficiencies. Therefore, the prediction model for smoke aerosol particle filtration by cellulose acetate filters developed in this study exhibits broad application potential and provides robust technical support for optimizing cigarette filter designs. However, this model is not applicable to the filtration prediction of volatile smoke components, nor can it be directly extended to evaluate the filtration performance of filters with special structures or alternative materials. Developing dedicated models for the above scenarios is our ongoing work. Nevertheless, the modeling strategy demonstrated in this work provides valuable methodological guidance for developing predictive models of other filter types or smoke components. This research will also offer valuable guidance for developing aerosol filtration models in atmospheric and industrial fields.
Notes
[4] CREDIT STATEMENTS
Ruihong Liu: Writing – review & editing, writing – original draft, visualization, methodology, investigation, formal analysis, conceptualization;
Jizhao Guo: Writing – review & editing, visualization, methodology, investigation, formal analysis;
Xuehui Sun: Project administration, supervision;
Shuwei Guo: Investigation, formal analysis;
Zhihua Liu: Resources, supervision, formal analysis;
Zhenhua Yu: investigation, validation;
Chao Wang: Conceptualization, project administration, supervision;
Peijian Sun: Data curation, formal analysis;
Shaodong Hu: Data curation, formal analysis;
Fuwei Xie: Project administration, supervision;
Baoshan Yue: Conceptualization, project administration, supervision.
ACKNOWLEDGMENTS
This work was supported by the China National Tobacco Corporation.