
Table 1.
Relative deviation of element concentration between initial and aged devices (re-analysis of Salazar et al. (1)). The contrasted behavior across elements is compatible with distinct source terms, including baseline/storage-driven contributions for some metals and operation-driven release for others.
| ELF Bar Flavored | 2,256% | 6,748% | — | 35% | 22% | −3% |
| ELF Bar Clear | 1,380% | 3,700% | −40% | 74% | 215% | −66% |
| ELF Bar 0% Nicotine | 3,210% | 6,054% | — | −10% | −99% | 21% |
| Flum Pebble Flavored | 2,256% | 1,408% | — | 162% | −59% | −28% |
| Flum Pebble Clear | 1,129% | 294% | 120% | 27% | −14% | −42% |
| ESCO Bar Flavored | 884% | −13% | 2% | 29% | 291% | 40% |
| ESCO Bar Clear | 503% | 70% | 2% | 23% | 15% | 38% |
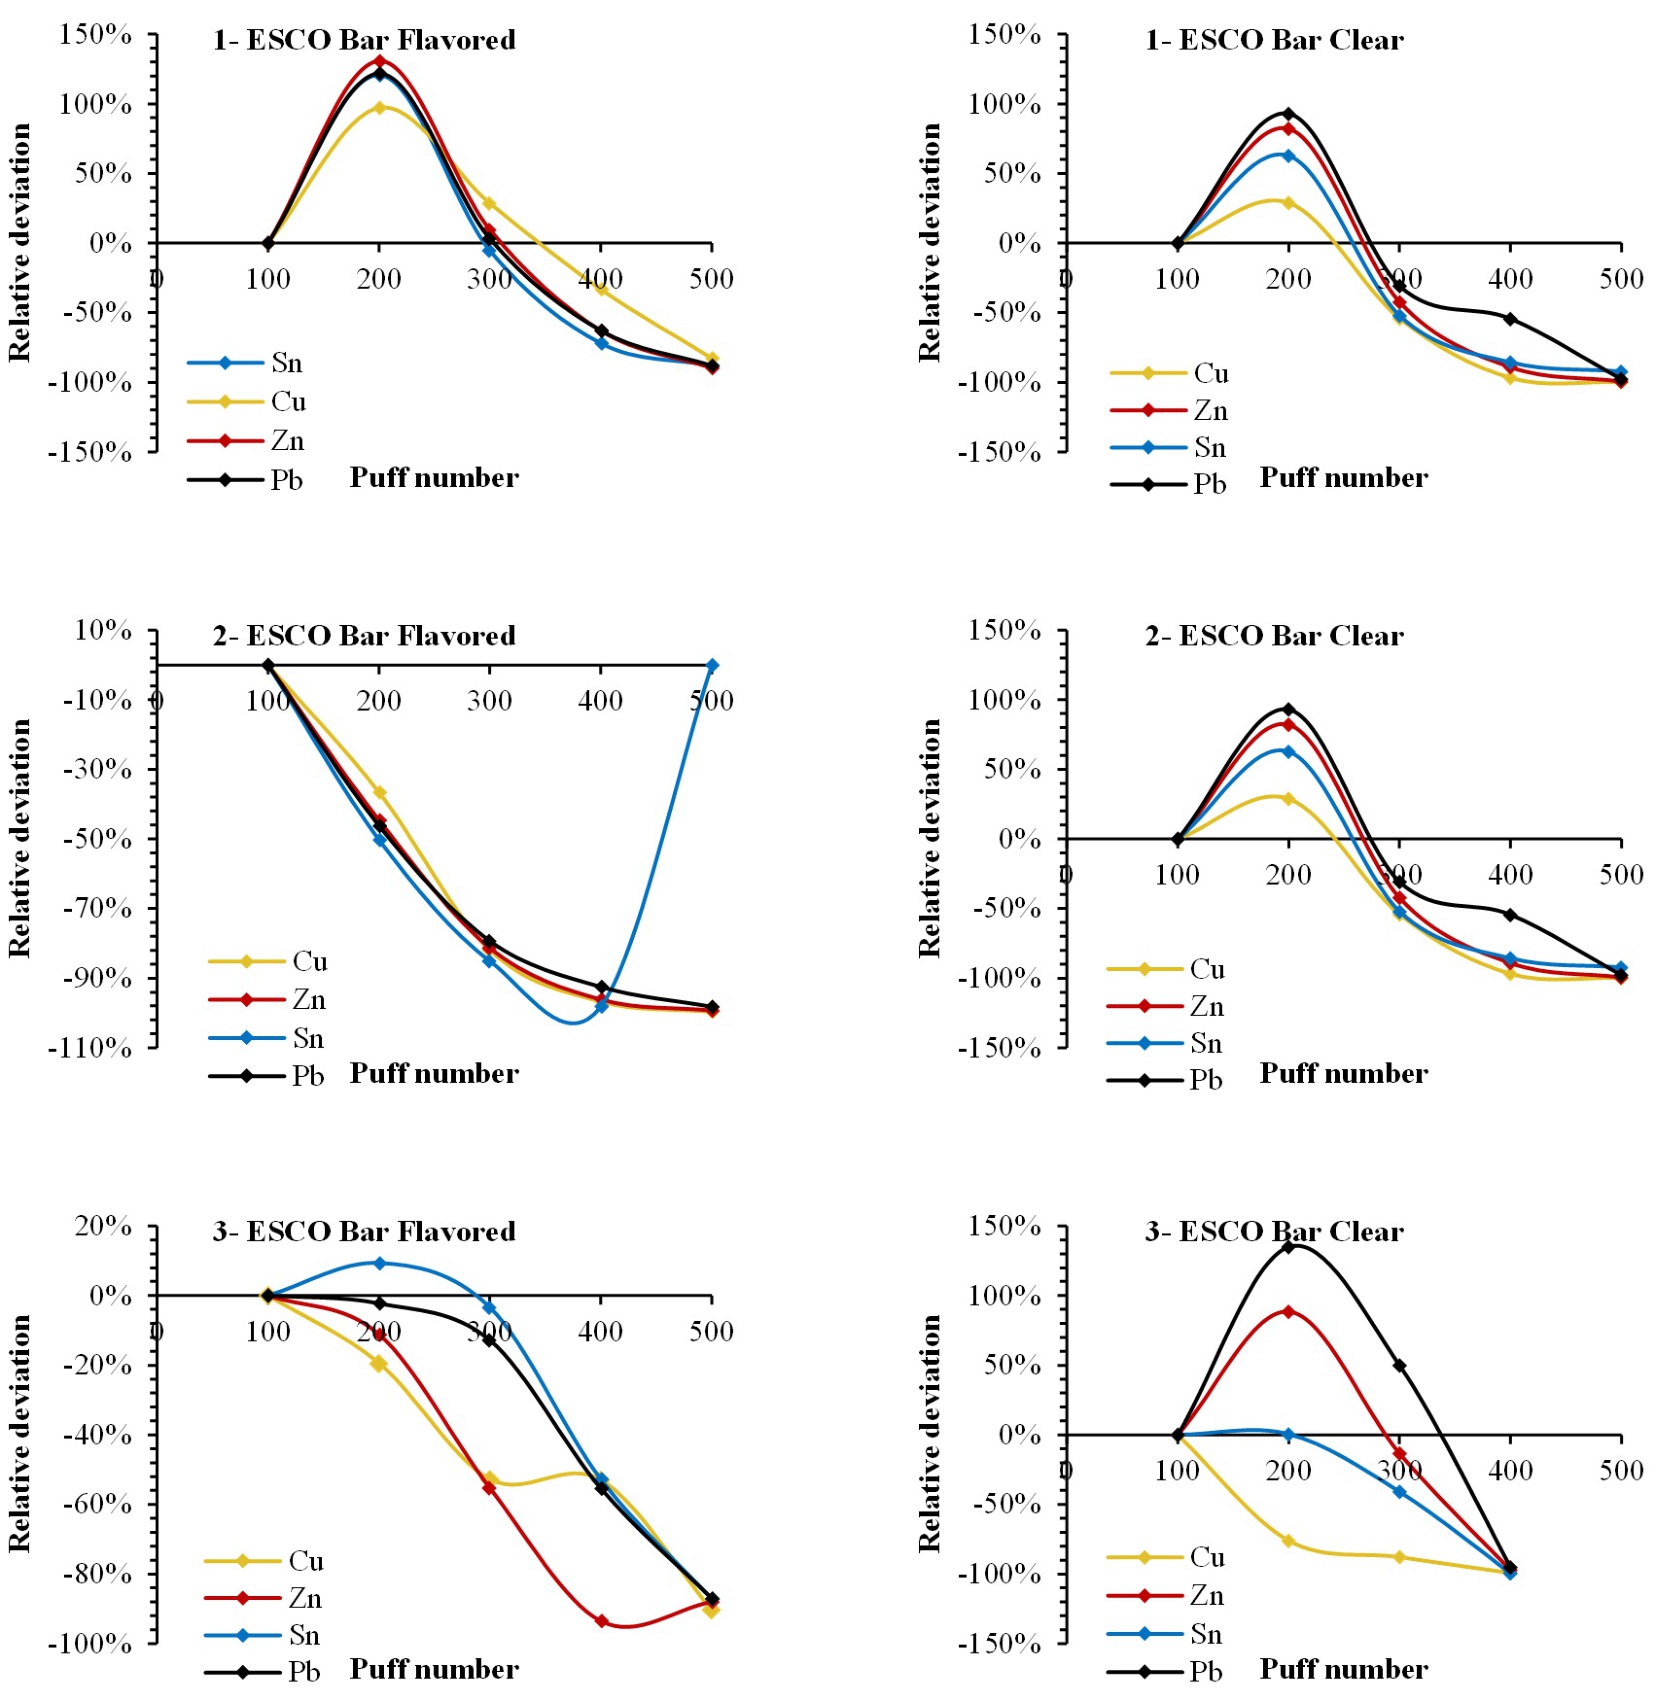
Figure 1.
Relative deviation from initial masses of Cu, Zn, Sn and Pb versus puff number for the six ESCO Bar devices (re-analysis of Salazar et al. (1)). These patterns are consistent with a strong baseline contribution and heterogeneous initial liquid rather than a stable emission regime.
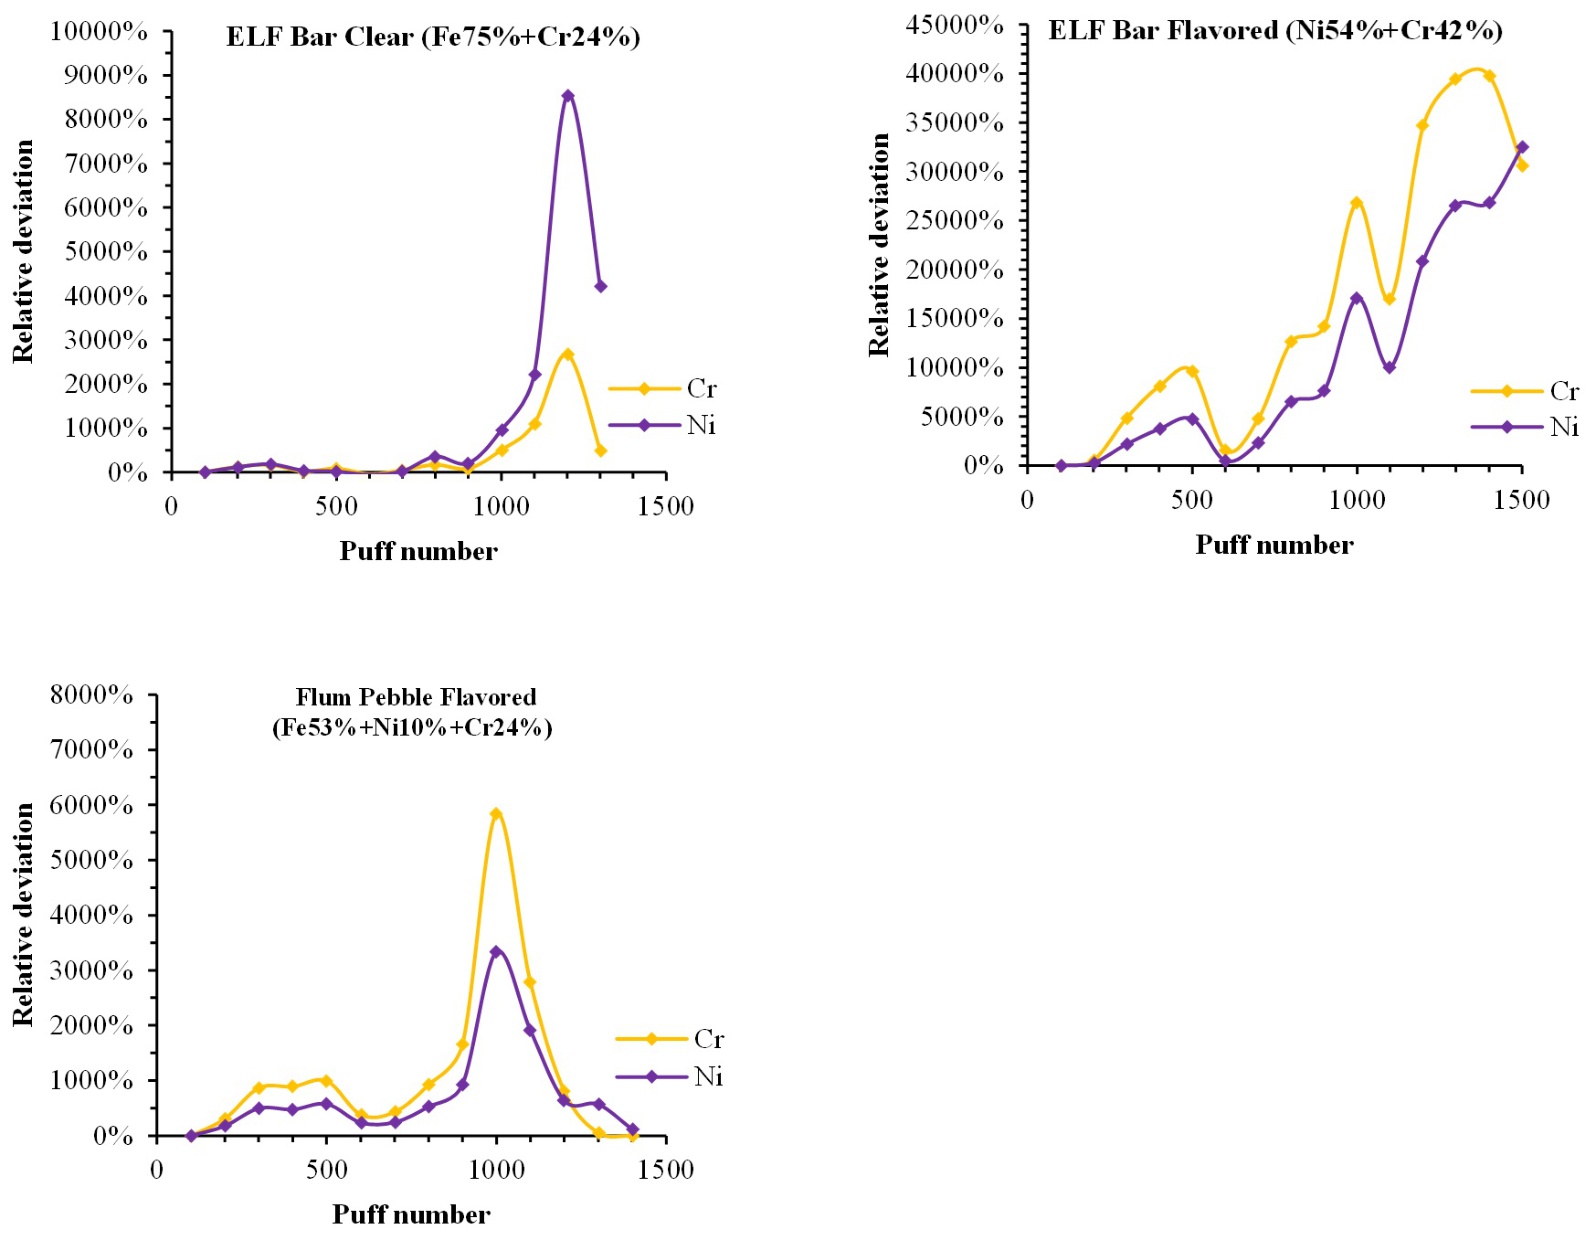
Figure 2.
Relative deviation from initial quantities of Cr and Ni for devices tested beyond 100 puffs (re-analysis of Salazar et al. (1)). The puff-dependent evolution of Cr/Ni is consistent with operation-driven release and device-state effects.
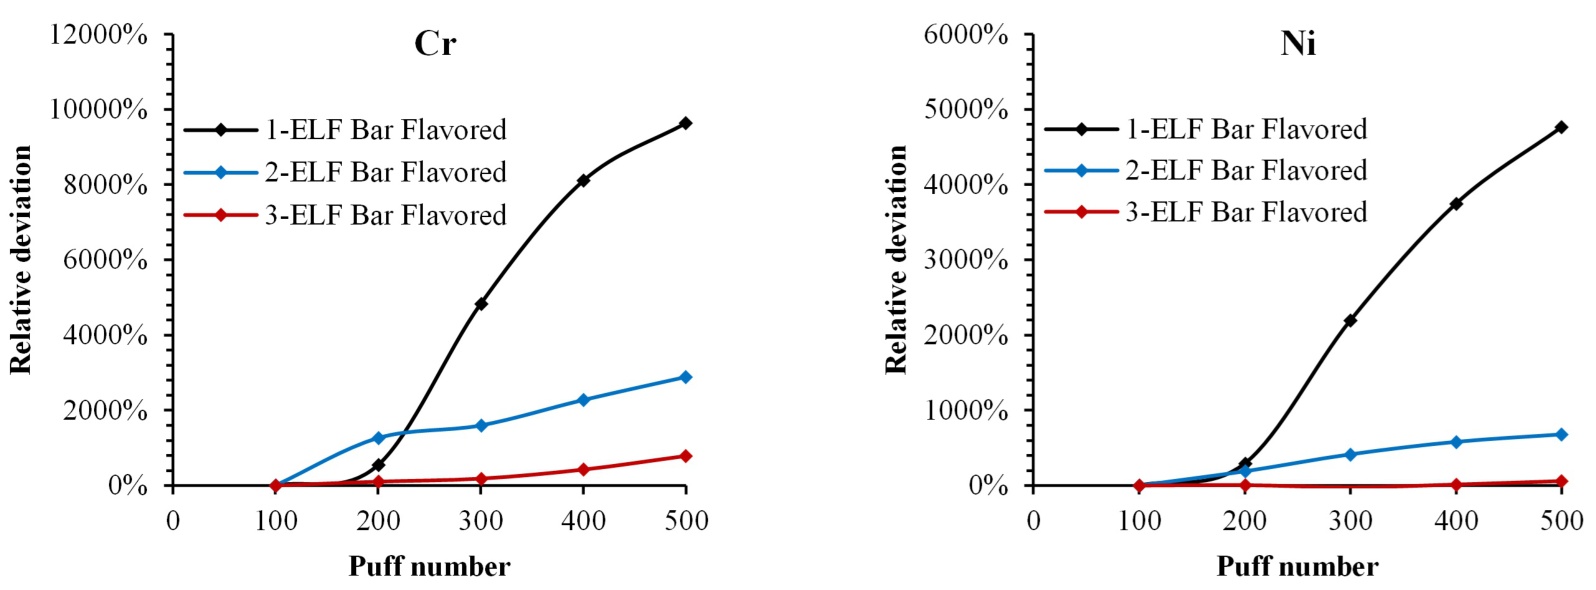
Figure 3.
Relative deviation from initial quantities of Cr and Ni versus puff number for three ELF Bar devices (re-analysis of Salazar et al. (1)). Divergence between replicates with puff progression indicates non-stationary behavior and end-of-life variability.
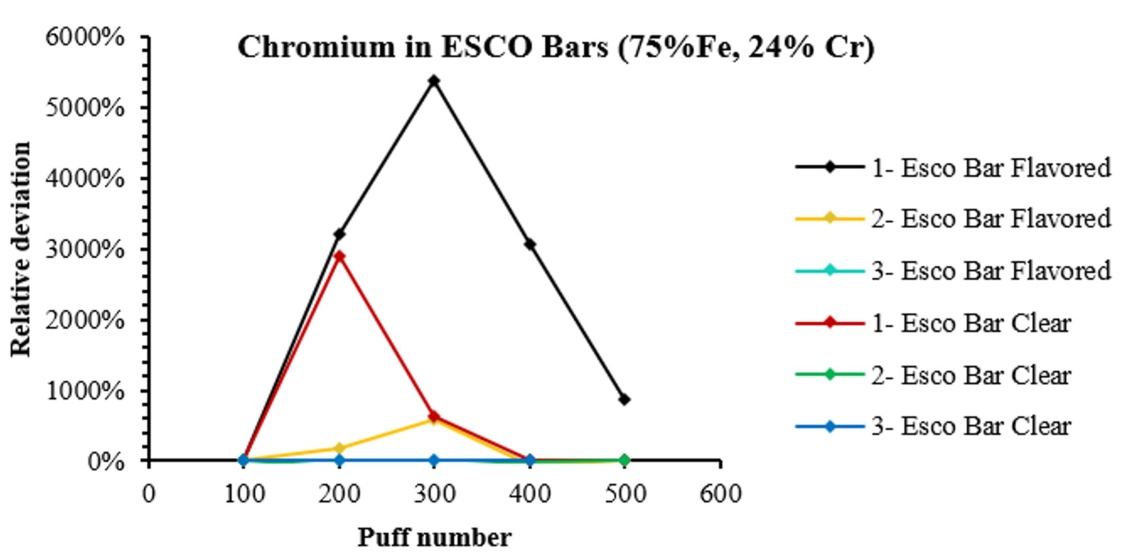
Figure 4.
Relative deviation from initial quantities of Cr versus puff number for three ESCO Bar devices (re-analysis of Salazar et al. (1). The differences between replicates support that device condition and ageing can substantially influence inferred emissions.
Table 2.
Comparison between estimated puff capacities and marketed capacities of the products tested by Salazar et al. (re-analysis of Salazar et al. (1)). The gap between estimated and marketed capacities supports that malfunction/end-of-life behavior can occur earlier than assumed, which constrains realistic exposure-duration scenarios.
| Devices | Volume (mL) | Density (g/mL) | Mean (mg/puff) | Estimated puff | Marketed puff |
|---|---|---|---|---|---|
| ELF Bar Flavored | 9.5 | 1.13±0.00 | 7.72±0.99 | 1,391 | 5,000 |
| ELF Bar Clear | 9.5 | 1.13±0.00 | 7.59±0.67 | 1,414 | 5,000 |
| ELF Bar 0% Nicotine | 9.5 | 1.13±0.01 | 8.22±0.79 | 1,306 | 5,000 |
| Flum Pebble Flavored | 14 | 1.13±0.00 | 8.31±0.07 | 1,904 | 6,000 |
| Flum Pebble Clear | 14 | 1.11±0.00 | 8.54±0.69 | 1,820 | 6,000 |
| ESCO Bar Flavored | 6 | 1.14±0.01 | 5.95±1.38 | 1,150 | 2,500 |
| ESCO Bar Clear | 6 | 1.12±0.00 | 4.10±2.67 | 1,639 | 2,500 |
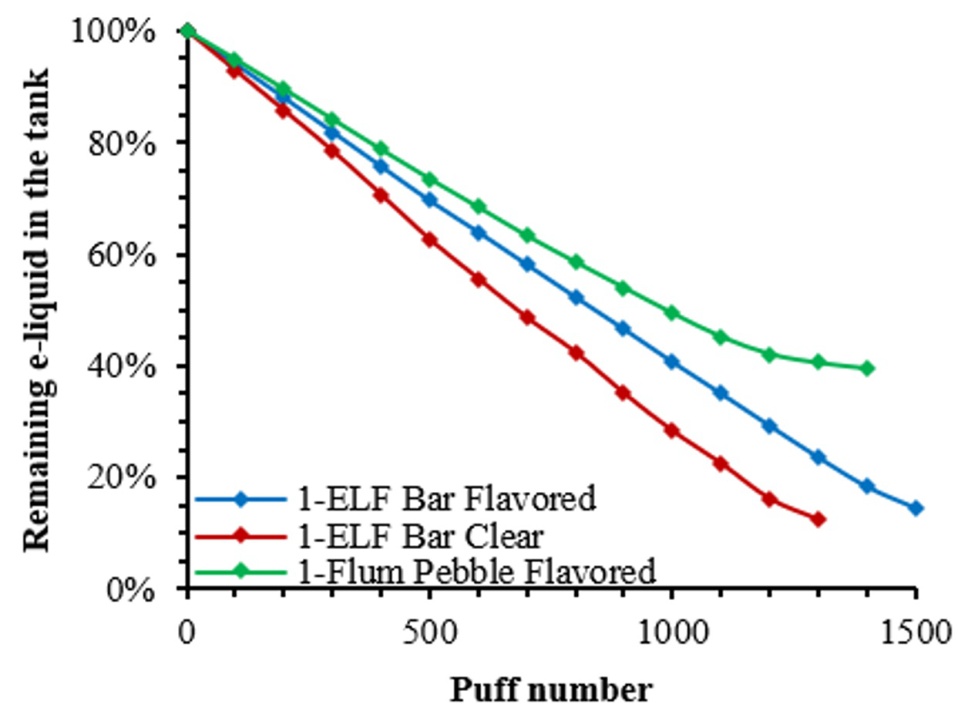
Figure 5.
Percentage of total vaporized e-liquid mass versus puff number for each device (re-analysis of Salazar et al. (1)). The non-constant consumption profile constrains exposure reconstruction and complicates comparisons based on a single assumed “mass-per-puff”.
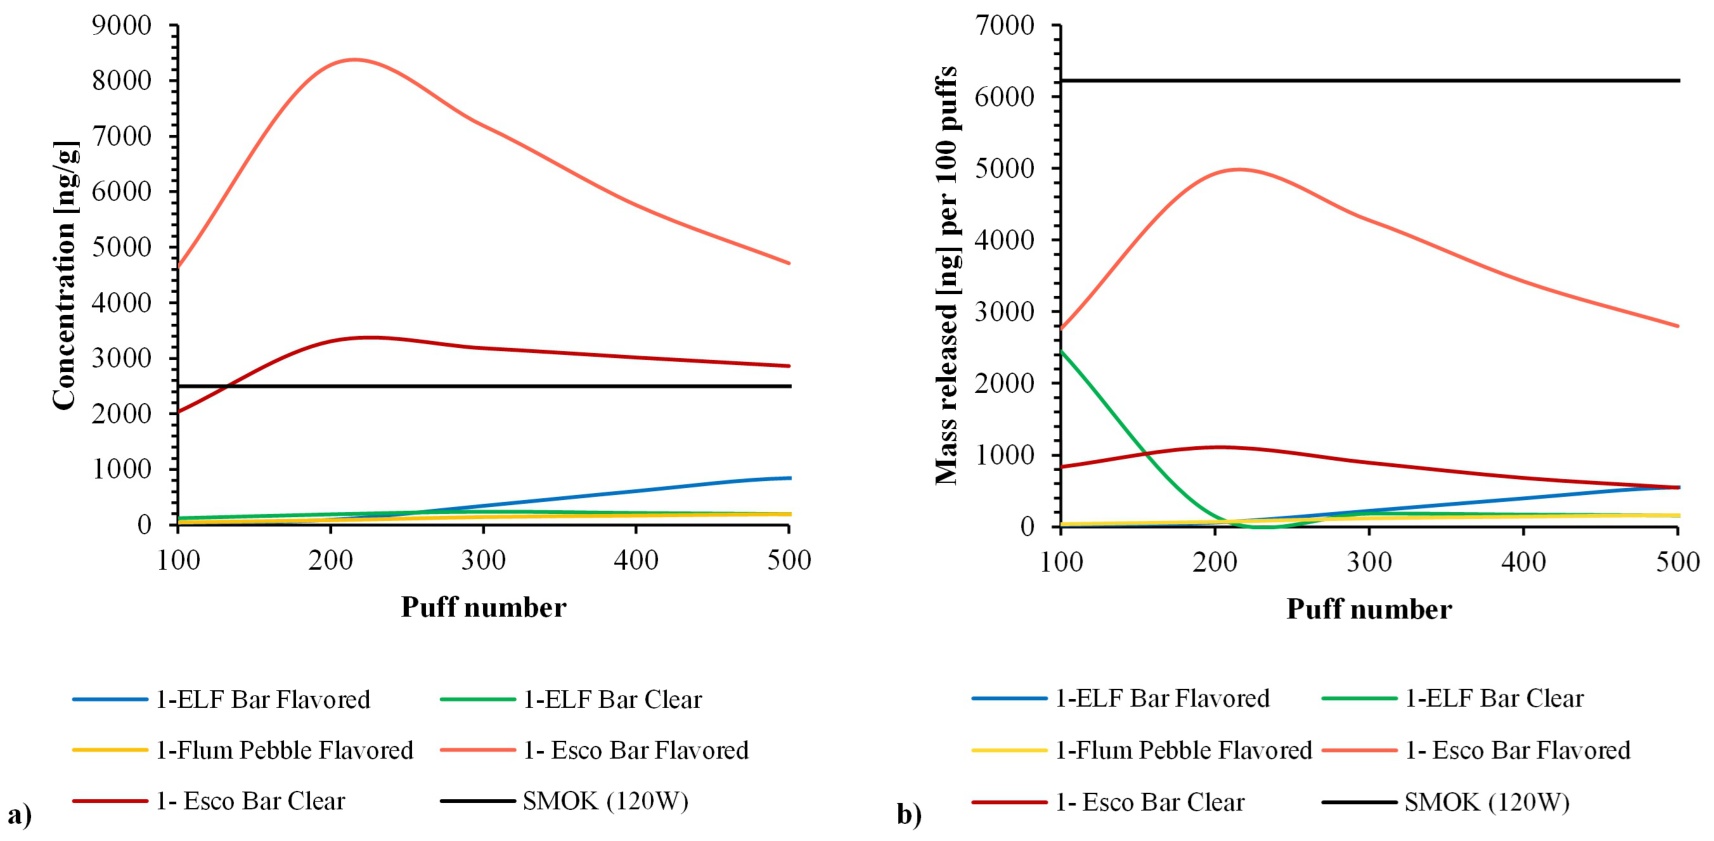
Figure 6.
Comparison of interpretation of metal released expressed in liquid concentration or in mass released (without information from Zhao et al. (20), SMOK mass of e-liquid vaporized is assumed at 25 mg per puff at 120 W). The same underlying dataset can support different conclusions depending on whether results are interpreted as concentrations or as emitted mass yields.
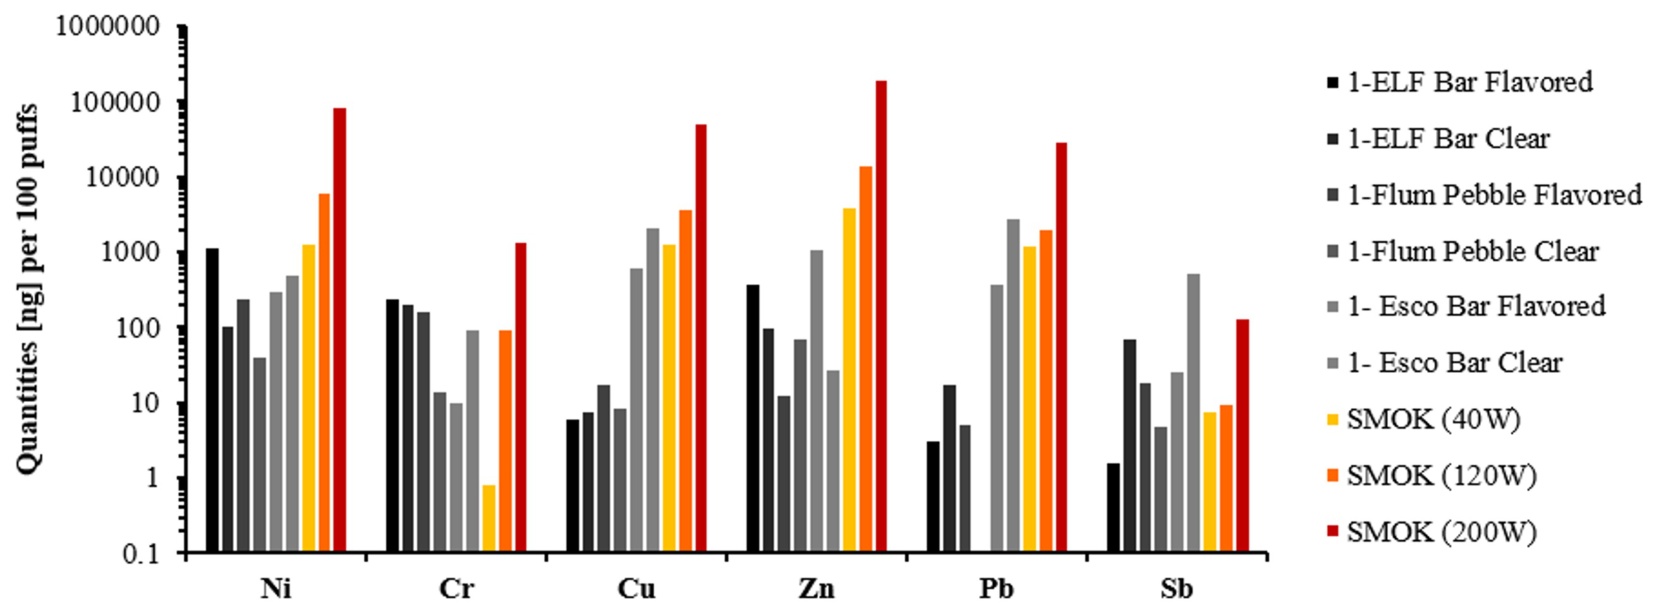
Figure 7.
Mass yields of released elements in the disposable products (re-analysis of Salazar et al. (1)) compared with SMOK results reported by Zhao et al. (20). Expressing results as yields improves interpretability for contextualization, while emphasizing that operating regime alignment remains necessary for strict comparisons.
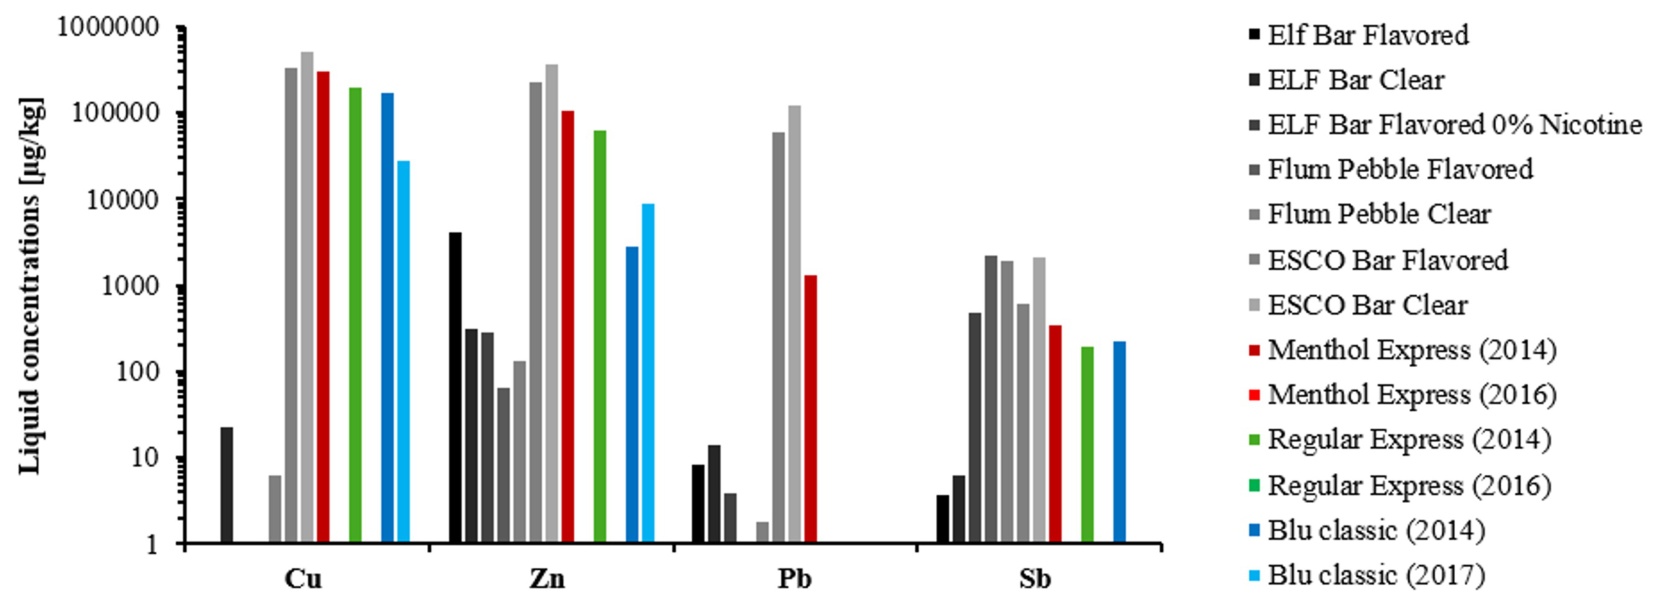
Figure 8.
Initial concentrations of released elements in the disposable products (re-analysis of Salazar et al. (1)) compared with new and old devices from Gray et al. (8). Overlap with “old device” conditions is consistent with storage-time effects and baseline contamination contributing to measured levels.
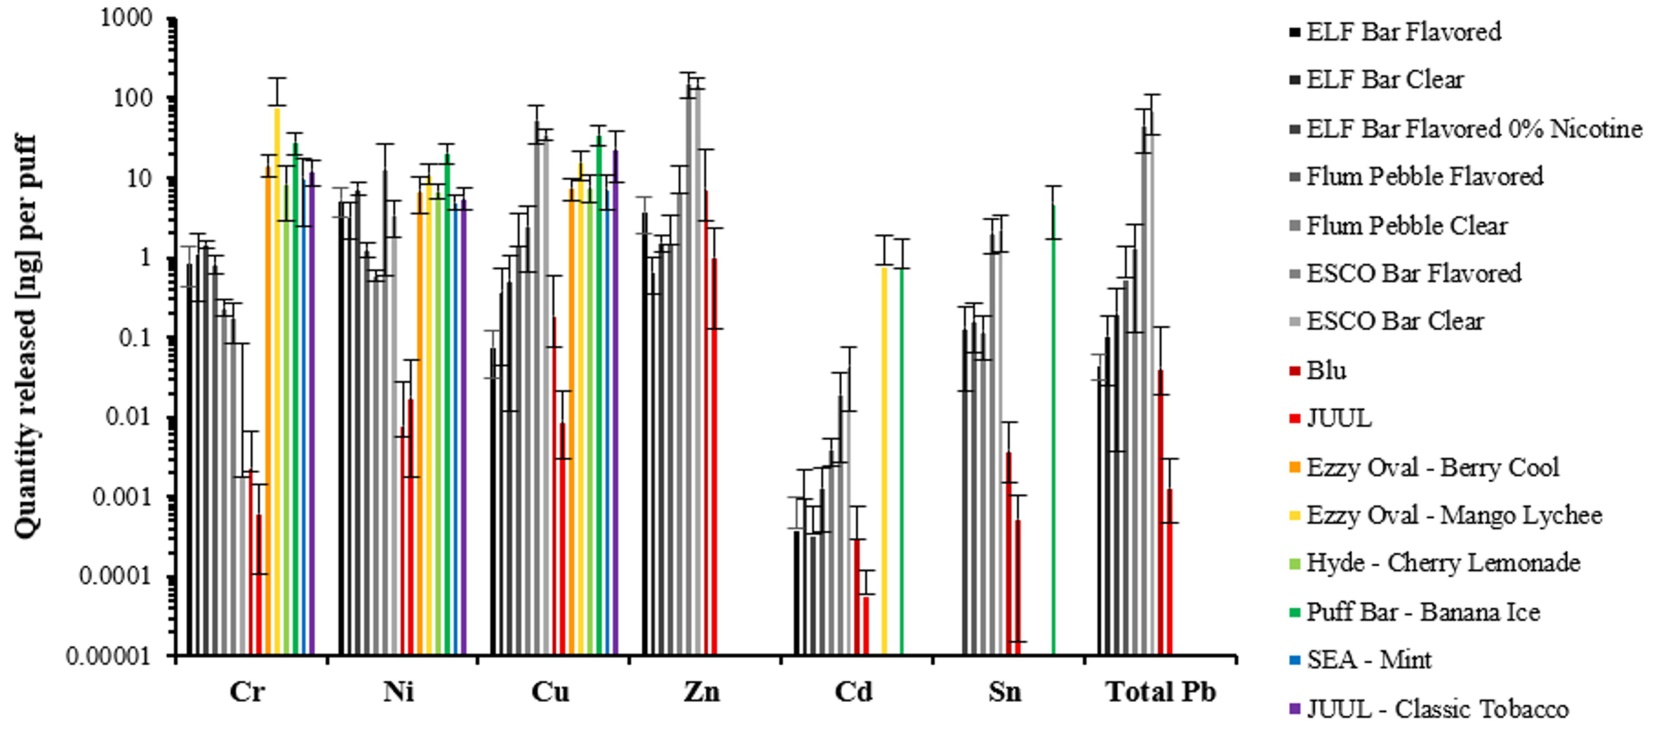
Figure 9.
Mass yields of released elements in the disposable products (re-analysis of Salazar et al. (1)) compared with results from Zhao et al. (20) (MyBlu and JUUL) and from Talih et al. (25) (Ezzy Oval – Berry Cool, Ezzy Oval – Mango Lynchee, Hyde – Cherry Lemonade, Puff Bar – Banana Ice, SEA – Mint, JUUL – Classic Tobacco). Error bars are deviations between same samples.
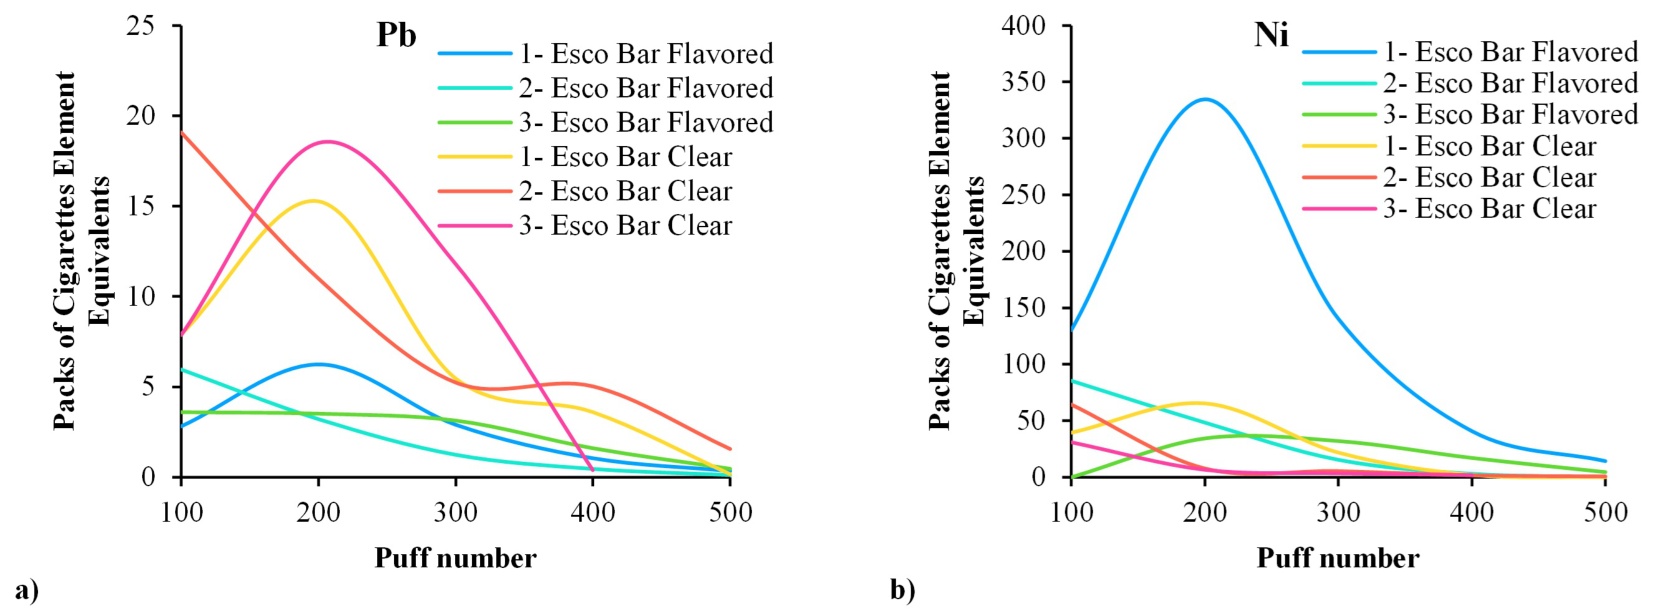
Figure 10.
Evolution of “equivalent cigarette packs” estimated from Pb and Ni released per 100 puffs for ESCO Bar devices (re-analysis of Salazar et al. (1)).
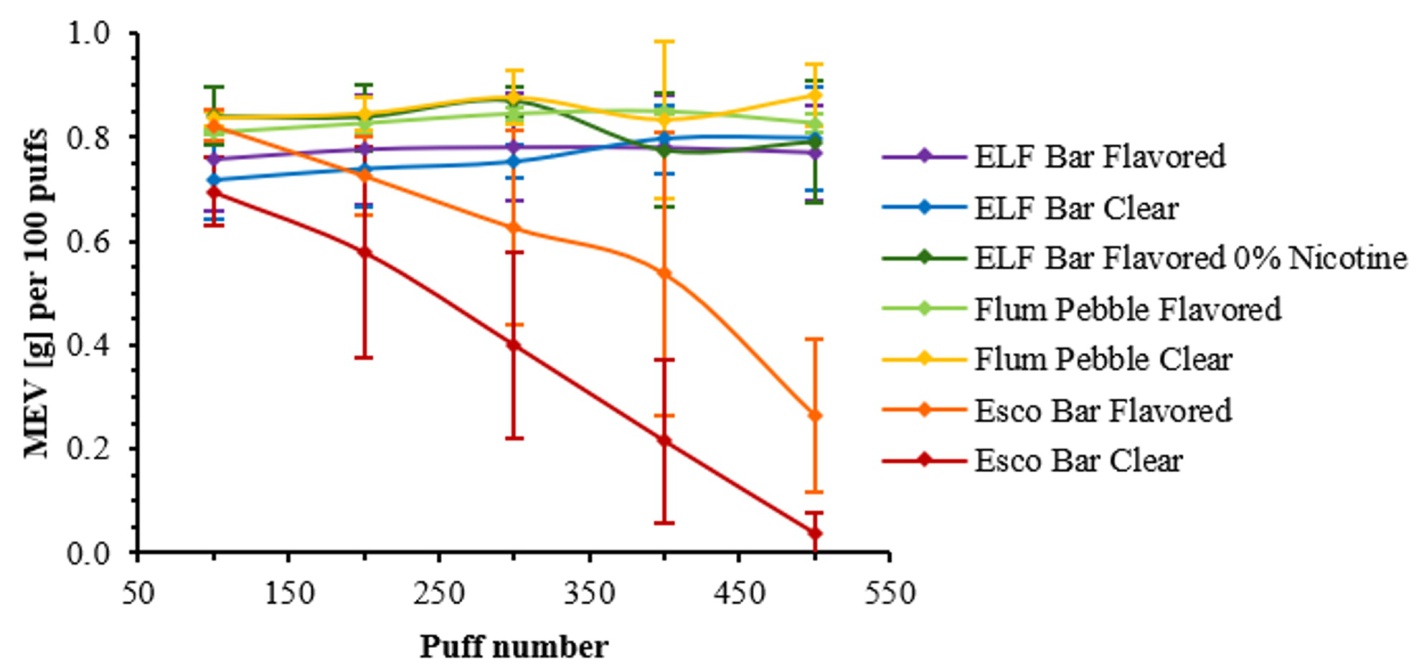
Figure 11.
Masses of e-liquid vaporized per 100 puffs determined by multiplying element concentrations (Table S3 in (1)) and element masses (Table S11 in (1)) for the seven devices tested in triplicate. Error bars are deviations between same samples.
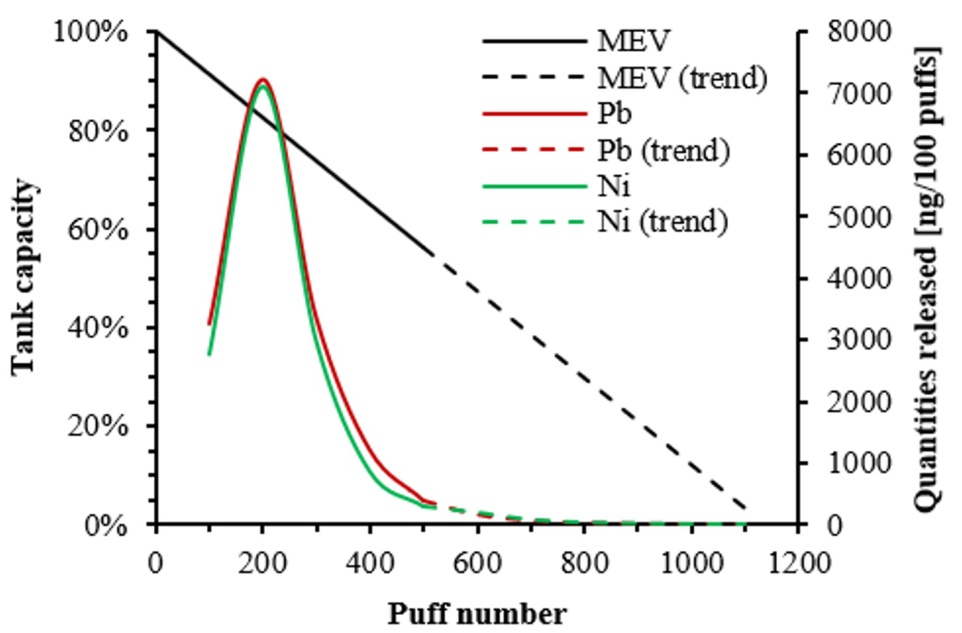
Figure 12.
Puff-course of Pb and Ni release versus puff number for device 1-EscoBar Flavored (re-analysis of Salazar et al. (1)). Distinct dynamics for Pb and Ni are consistent with different source terms, with Pb more influenced by baseline conditions and Ni more influenced by operation.
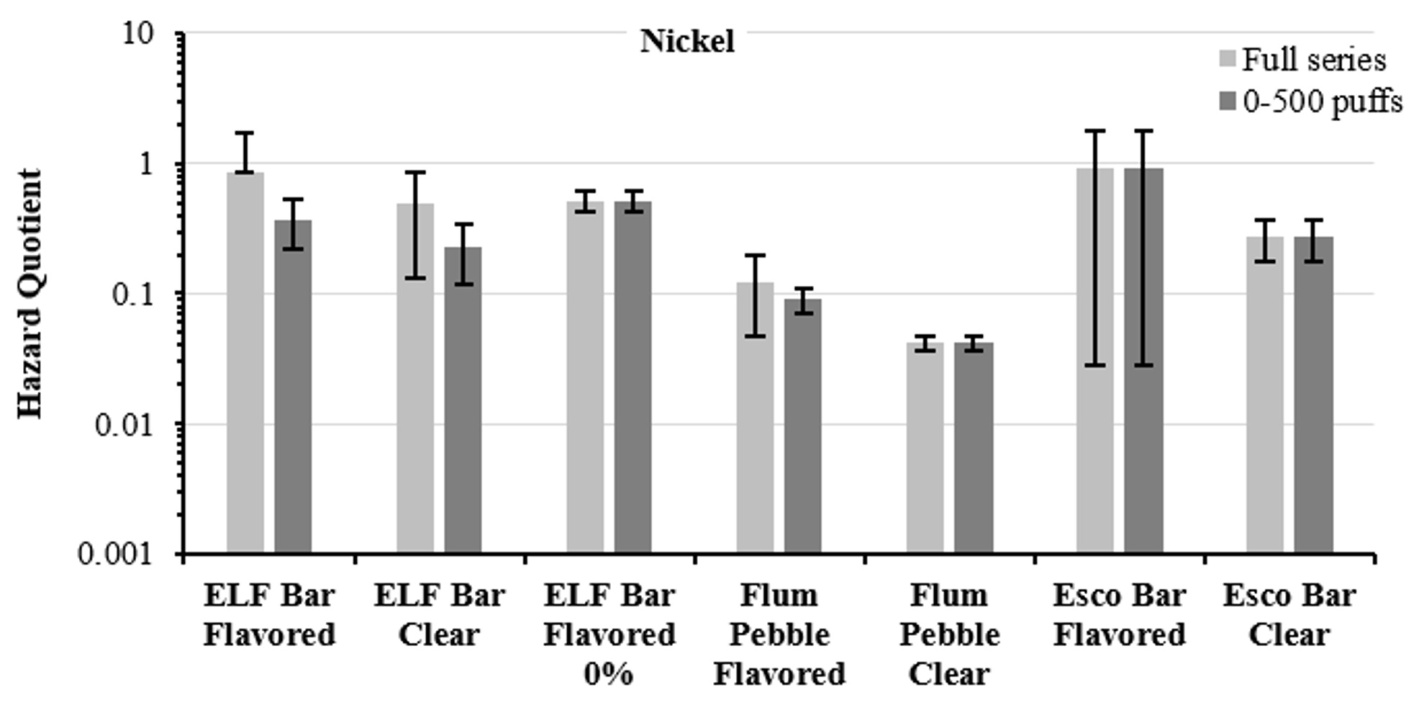
Figure 13.
Hazard quotient estimates for nickel under a 2-week scenario (re-analysis of Salazar et al. (1)). Short-duration scenarios can shift the apparent drivers of HQ, particularly when restricting to early puff windows (0-500 puffs). Error bars are deviations induced by average concentrations used.
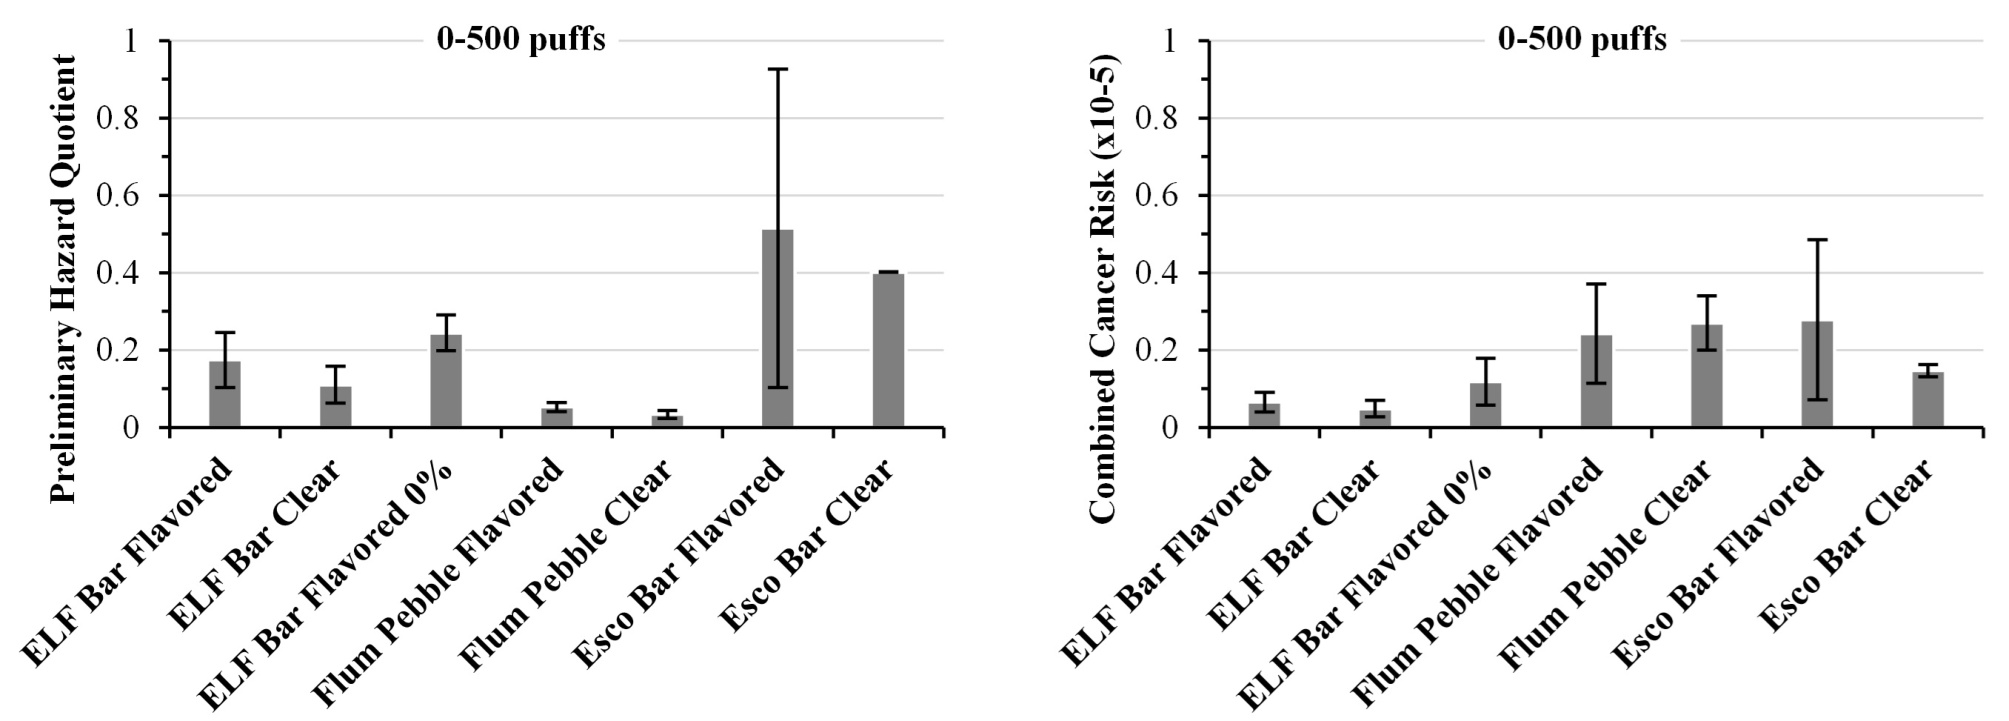
Figure 14.
Preliminary hazard quotient and combined cancer risk estimates restricted to the 0–500 puff window (re-analysis of Salazar et al. (1)). Restricting the window changes combined indicators, illustrating the impact of end-of-life behavior on risk interpretation.