
Table 1.
Methodology differences between PATH Waves 5–7.
| Wave 5 | Wave 5.5 | Wave 6 | Wave 7 | |
|---|---|---|---|---|
| Dates of administration | Dec 1, 2018 – Nov 30, 2019 | July 3, 2020 – Dec 31, 2020 | Mar 1, 2021 – Nov 30, 2021 | Jan 6, 2022 – April 2, 2023 |
| Survey mode: self-administered | 100% | 0% | 33.9% | 95.1% |
| Survey mode: telephone interview | 0% | 100% | 66.1% | 2.8% |
| Survey mode: Web interview | ─ | ─ | ─ | 3.1% |
| Age range | 12–17 | Not analyzed | 14–17 | 12–17 |
| Full sample (N) | 11,976 | Not analyzed | 5,585 | 10,650 |
| Comparable across waves (N). Age 14–17 AND self-administered | 8,797 | Not analyzed | 1,616 | 6,829 |
| Not comparable across waves (N). Ages 12–13 OR telephone OR web survey | 3,179 | Not analyzed | 3,969 | 3,821 |
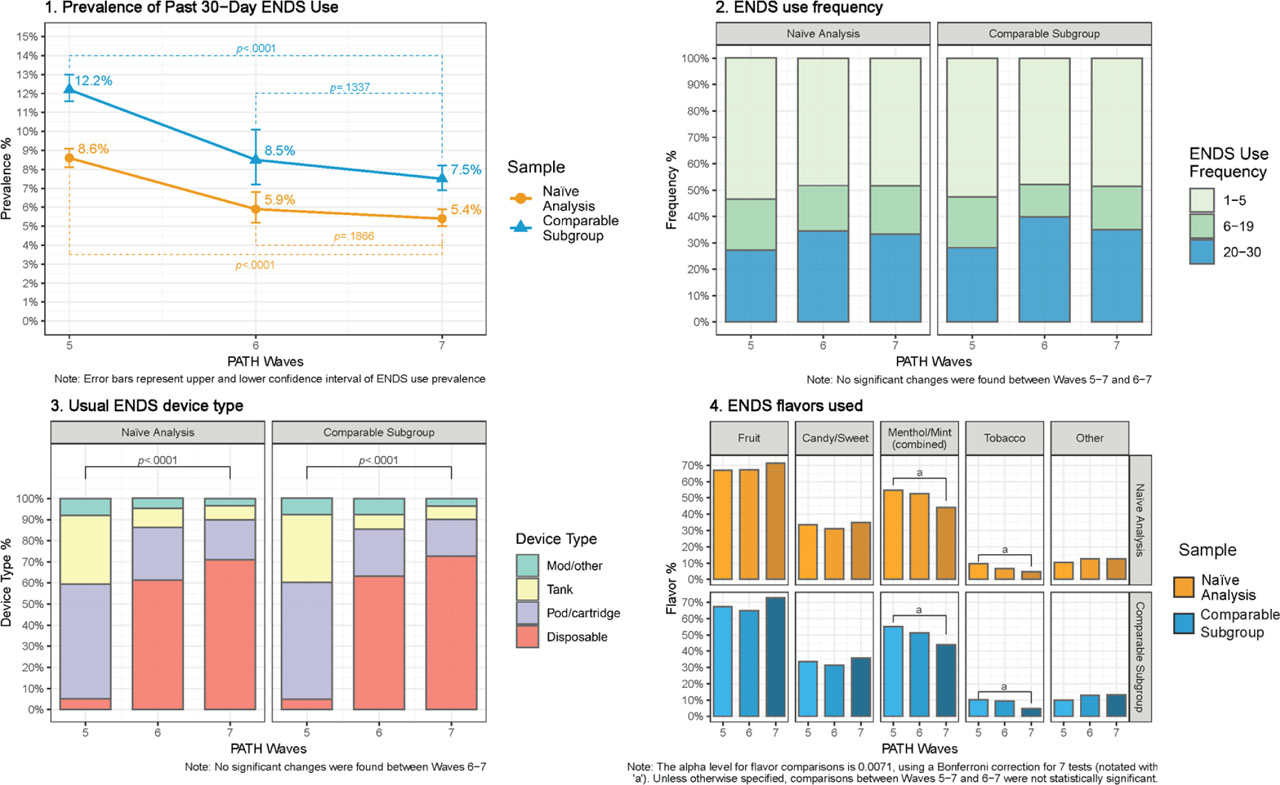
Figure 1.
Youth ENDS use prevalence and patterns of use, PATH Waves 5–7.
Table 2.
Usual/last-used ENDS brand, naïve analysis and comparable-subgroup analysis, PATH Waves 5–7.
| Wave 5 (∼2019) | Wave 6 (∼2021) | Wave 7 (∼2022) | p-value c,d (W5→7) | p-value c,d (W6→7) | ||
|---|---|---|---|---|---|---|
| Naïve analysis a | No regular brand | 62.4% | 45.3% | 44.2% | NA e | NA |
| Naïve analysis | Most common named brands |
|
|
|
|
|
| Naïve analysis | All other listed brands | 1.9% | 4.1% | 5.6% | NA | NA |
| Naïve analysis | Other brand (not listed) | 3.2% | 11.6% | 10.8% | < 0.0001 | 0.6954 |
| Comparable subgroup b | No regular brand | 62.7% | 51.3% | 43.2% | NA | NA |
| Comparable subgroup | Most common named brands |
|
|
|
|
|
| Comparable subgroup | All other listed brands | 1.8% | 2.4% | 5.1% | NA | NA |
| Comparable subgroup | Other brand (not listed) | 3.1% | 3.7% | 10.5% | < 0.0001 | 0.0128 |
a Naïve analysis includes all youth participants, regardless of methodological differences between waves.
b Comparable subgroup analysis includes only youth participants aged 14–17 who self-administered the survey.