
STATEMENT OF SIGNIFICANCE
Population Assessment of Tobacco and Health (PATH) is the most widely-used national longitudinal survey of nicotine and tobacco product use and is essential for youth surveillance. However, there is at least one known methodological artifact that limits comparability across waves, which is essential for accurate surveillance efforts. We previously documented an artifact in e-cigarette use prevalence resulting from a COVID-related change in survey administration mode (from self-completed to telephone interview). We document an additional artifact in the current manuscript, in which differences in youth age ranges across waves produce spurious differences in prevalence. Specifically, this analysis reports that the methodological differences in PATH indeed complicate the wave-to-wave comparisons of youth e-cigarette use prevalence, leading to an overestimation of prevalence due to a higher age distribution in Wave 6. Its impact on the patterns of e-cigarette use was minimal. These results inform researchers about essential data analysis steps that must be taken for accurate surveillance of youth nicotine and tobacco use.
INTRODUCTION
Ongoing surveillance of youth use of nicotine and tobacco products is a public health priority, especially for the most commonly used product, electronic nicotine delivery systems (ENDS) (1). The nationally-representative Population Assessment of Tobacco and Health (PATH) survey (2) is a main source of data for research on nicotine and tobacco product behavior, including trends over time (3,4,5).
Accordingly, accurate data analysis and interpretation of findings are paramount to the integrity of ongoing research on youth ENDS use. However, there are important methodological differences that complicate comparisons across waves of PATH. Specifically, previous analyses documented two methodological differences that impact youth ENDS use prevalence estimates in Waves 5.5 (∼2020) and 6 (∼2021): survey mode and age range (6).
Regarding survey mode differences, PATH is typically self-administered by participants in a secure home setting on a laptop with privacy and security features (through Wave 5, ∼2020), but due to COVID restrictions, this changed to telephone interviews during Wave 5.5 (∼2020; 100% telephone interview) and and for some participants in Wave 6 (∼2021; approximately two-thirds telephone interviews) (2, 6, 7). Reported ENDS use was significantly lower in telephone interviews than in self-completed assessments, likely due in part to social desirability bias (6). This survey-mode artifact has a substantial impact on the interpretation of youth ENDS use trends: a naïve comparison appears to show a large decline in ENDS use prevalence from Waves 5 to 5.5 followed by an uptick in Wave 6, but analyzing within survey modes shows a more modest decline followed by a plateau (6). That is, the interpretation of youth ENDS use trends qualitatively differs based on whether or not the survey-mode difference is accounted for.
Regarding differences in age range across waves, typically PATH samples participants aged 12–17 for the youth survey (7–8). As PATH is a longitudinal survey, most waves enroll new participants at the younger end of this age range to maintain a similar age range as previous participants age up – either through previously-sampled “shadow” youth or through the Wave 4 and 7 replenishment samples. However, there were very few newly-enrolled youth (∼12–13 years) at Waves 5.5 and 6, resulting in an older minimum age (∼14–17 years) of the youth sample compared to other waves (6,7,8). This age difference likely introduces an artifact in estimates of youth ENDS use prevalence, as ENDS use is more common at older ages. That is, youth ENDS use prevalence estimates may be inflated for Waves 5.5 and 6 in analyses that are naïve to the age-range difference; it is unknown whether this artifact could also impact patterns of ENDS use (i.e., frequency, device type, flavor, and brand use).
Previous studies using PATH to assess youth patterns of ENDS use often fall short in fully accounting for methodological differences, such as the age range (9), survey mode (10, 11), or both (12). Previous analysis documentting PATH’s survey mode artifact in Waves 5.5 and 6 touches on the existence of the age-range difference (6); however, it was unable to examine its precise impact on prevalence estimates due to the lack of younger ages (12–13 years) in these waves. The recently released Wave 7 (∼2022) affords the opportunity to examine age-related changes in ENDS use prevalence, as it includes a replenishment sample that restores the full youth age range (12,13,14,15,16,17), making it approximately comparable (∼95% similar) to Wave 5 with respect to both survey mode and age range. Specifically, we compare naïve vs. methodologically-comparable analyses (i.e., among youth with the same age range and survey mode) of changes in youth ENDS use prevalence and patterns of use over the prior 1 year (i.e., Waves 6–7, ∼2021–2022) and 3 years (i.e., Waves 5–7, ∼2019–2022).
METHODS
Data
PATH restricted-use files from youth Waves 5 (∼2019; N = 11,976), 6 (∼2021; N = 5,585), and 7 (∼2022; N = 10,650) were analyzed. Wave 5.5 (∼2020) was not included in the current analysis as it was 100% telephone interview (7–8), making it fully incomparable with the other waves, as it was previously reported (6). Wave 7 included a replenishment sample and initiated a third survey mode, a web interview (administered to 3.1% of participants). This secondary data analysis was determined exempt from ethical oversight.
Measures
Prevalence of past 30-day ENDS use was assessed as any use of ENDS in the past 30 days (P30D).
Patterns of ENDS use included frequency of use, device type, flavor, and brand. Frequency of ENDS use was derived from the number of days in P30D the participant reported using ENDS, and was categorized here as 1–5, 6–19, and 20+ days in P30D.
Youth reporting P30D ENDS were asked to characterize the device type usually used as “disposable,” “replaceable filled cartridges” (pod/cartridge), “tank,” “mod,” or “something else.” Current analyses combined “mod” and “something else” into a single category due to low endorsement rates. The question structure changed from a single-choice (i.e., the device type used most often) to select-all-that-apply (i.e., any use of each device type, with those using more than one type being asked which was used most often) starting in Wave 6.
ENDS flavor was assessed as check-all-that-apply among youth reporting P30D ENDS use. Wave 5 assessed mint and menthol as a combined category, but these flavors were assessed separately at Waves 6 and 7.
Usual/last-used ENDS brand is a PATH-derived variable that assesses usual brand among P30D users who have a usual brand, and last-used brand among those who do not have a usual brand (including those who used ENDS only once). We restricted analyses to the four most common brands at each wave, as well as “no regular brand” and “don’t know”/“refused to answer.”
Analyses
Rates of P30D ENDS use and patterns of ENDS use were compared in the prior 1-year (i.e., Waves 6–7, ∼2021–2022) and 3-year (i.e., Waves 5–7, ∼2019–2022) periods, both naïvely (i.e., in the full youth sample from each wave, without accounting differences in age range and survey modes) as well as among the subgroup of youth who were comparable across all waves, i.e., youth aged 14–17 who self-administered the survey (Table 1).
Table 1.
Methodology differences between PATH Waves 5–7.
| Wave 5 | Wave 5.5 | Wave 6 | Wave 7 | |
|---|---|---|---|---|
| Dates of administration | Dec 1, 2018 – Nov 30, 2019 | July 3, 2020 – Dec 31, 2020 | Mar 1, 2021 – Nov 30, 2021 | Jan 6, 2022 – April 2, 2023 |
| Survey mode: self-administered | 100% | 0% | 33.9% | 95.1% |
| Survey mode: telephone interview | 0% | 100% | 66.1% | 2.8% |
| Survey mode: Web interview | ─ | ─ | ─ | 3.1% |
| Age range | 12–17 | Not analyzed | 14–17 | 12–17 |
| Full sample (N) | 11,976 | Not analyzed | 5,585 | 10,650 |
| Comparable across waves (N). Age 14–17 AND self-administered | 8,797 | Not analyzed | 1,616 | 6,829 |
| Not comparable across waves (N). Ages 12–13 OR telephone OR web survey | 3,179 | Not analyzed | 3,969 | 3,821 |
To examine how age-range differences may impact both point estimates and trends over time, interactions between age group (12–13 vs. 14–17) and wave were examined in those interviewed in-person; for these analyses, only the prior 3-year period (Waves 5–7) were analyzed, i.e., excluding Wave 6 which lacked the younger age group.
SAS version 9.4 (Cary, NC, USA) was used for all analyses, and the provided weights were used with balanced repeated replication as recommended by the PATH team to adapt a longitudinal survey design to compare cross-sections and to account for the presence of some respondents in more than one wave (8). Listwise deletion was used for missing data. Weighted frequencies are provided to estimate prevalences and Rao-Scott chi-square tests were used to compare differences in these across waves 5, 6 and 7. Logistic regression models were used to study the interaction of age and wave with least squares means used to estimate the prevalence controlling for the interaction. Because significance testing for ENDS flavor and brand was done as a series of dummy-coding (one response vs. all others), Bonferroni correction was applied to these p-values.
RESULTS
The survey-mode and age-range differences primarily affect PATH Wave 6 (Table 1); since Wave 7 returned nearly entirely (∼95%) to self-administration and the newly-enrolled replenishment sample restored the typical age range of 12–17, Waves 5 and 7 are approximately comparable with respect to these methodological differences. The small percentage of web and telephone interviews did not appreciably change the overall Wave 7 estimates (see Supplementary Table 1 using PATH W7 public-use data).
Prevalence of youth ENDS use
Figure 1 shows the naïve vs. methodologically-comparable estimates of youth P30D ENDS use and use patterns over Waves 5–7. Results showed a statistically-significant decline in P30D youth ENDS use over the prior 3 years for both the naïve (8.6% to 5.4%, p < 0.0001) and comparable-subgroup analyses (12.2% to 7.5%, p < 0.0001; see Figure 1, Panel 1); a significant decline between Waves 5–6 has been previously reported (6). In the prior 1-year period (Waves 6–7), P30D ENDS use declined, but not significantly, according to both analyses (naïve analysis: 5.9% to 5.4%, p = 0.1886; comparable-subgroup analysis: 8.5% to 7.5%, p = 0.1337). However, point estimates were considerably higher in the comparable-subgroup analysis at all time points.
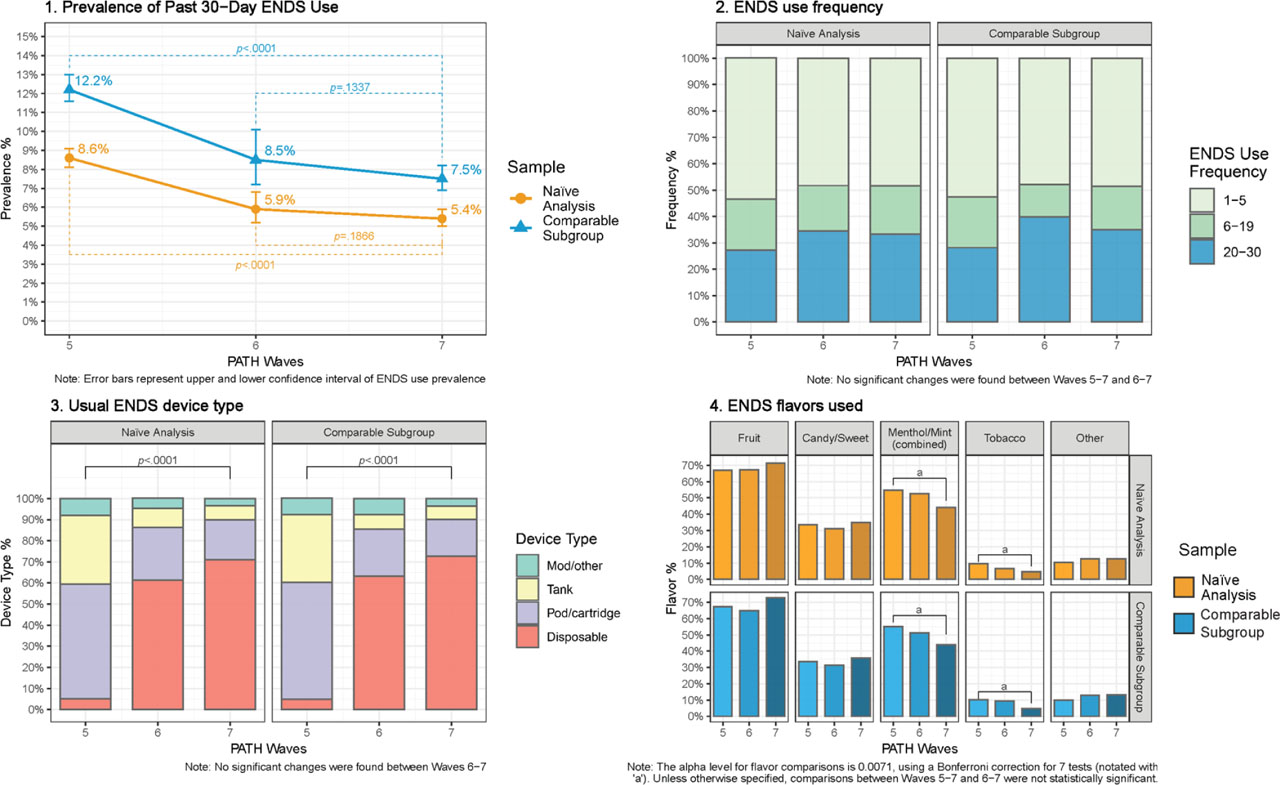
Figure 1.
Youth ENDS use prevalence and patterns of use, PATH Waves 5–7.
For the rates of P30D ENDS use, the interaction between age and wave over the prior 3 years was significant (p < 0.0001). Specifically, P30D ENDS use was significantly more common among youth aged 14–17 compared to those aged 12–13 in both Waves 5 and 7 (Wave 5: 12.2% vs. 1.2%; Wave 7: 7.5% vs. 1.7%, p < 0.0001). However, compared to youth aged 14–17 participating in Wave 5, the comparable age group in Wave 7 reported decreased rates of P30D ENDS use (12.2% in Wave 5 to 7.5% in Wave 7), while it was modestly increased among cohorts aged 12–13 in each wave (1.2% to 1.7%). Controlling for this interaction resulted in a net non-significant main effect of wave, p = 0.3214).
Patterns of ENDS use
Frequency of ENDS use (Figure 1, Panel 2) did not significantly change over the prior 1-year or 3-year periods in either analysis and point estimates were generally similar across the naïve vs. comparable-subgroup analyses (differences of ∼5.0 percentage points or less; same rank order of frequency groups). With respect to device type (Figure 1, Panel 3), there was a large shift over the prior 3 years away from pod/cartridge and tank devices and towards disposable devices, which largely occurred during the first of those 3 years (i.e., Waves 5–6), as previously reported (13). Device type patterns were approximately stable over the prior 1 year in both the naïve and comparable-subgroup analyses (differences < 2.0 percentage points). Use of fruit- and candy/sweet-flavored ENDS were fairly consistent across all waves analyzed, reported by 70% and 33% of youth reporting P30D ENDS use, in both naïve and comparable-subgroup analyses (Figure 1, Panel 4). However, there were significant changes in the use of other flavors over the prior 3 years: use of menthol/mint significantly decreased (from ∼55% to ∼44%, in both naïve and comparable-subgroup analyses) and the use of tobacco flavor, which was uncommon, fell by approximately half (from ∼10% to ∼5%, p < 0.0001). These declines in use of menthol/mint and tobacco flavors appear to have continued over the prior year, though the comparisons did not reach statistical significance, possibly due to lower sample size in Wave 6 (see Table 1).
With respect to usual/last-used brand (Table 2), JUUL declined over the prior 3 years as reported previously (13) as Vuse, Hyde, and Puff Bar increased; brand use was similar over the 1 year prior to Wave 7. Neither brand endorsement rates nor changes over time were materially different across naïve vs. comparable-subgroup analyses.
Table 2.
Usual/last-used ENDS brand, naïve analysis and comparable-subgroup analysis, PATH Waves 5–7.
| Wave 5 (∼2019) | Wave 6 (∼2021) | Wave 7 (∼2022) | p-value c,d (W5→7) | p-value c,d (W6→7) | ||
|---|---|---|---|---|---|---|
| Naïve analysis a | No regular brand | 62.4% | 45.3% | 44.2% | NA e | NA |
| Naïve analysis | Most common named brands |
|
|
|
|
|
| Naïve analysis | All other listed brands | 1.9% | 4.1% | 5.6% | NA | NA |
| Naïve analysis | Other brand (not listed) | 3.2% | 11.6% | 10.8% | < 0.0001 | 0.6954 |
| Comparable subgroup b | No regular brand | 62.7% | 51.3% | 43.2% | NA | NA |
| Comparable subgroup | Most common named brands |
|
|
|
|
|
| Comparable subgroup | All other listed brands | 1.8% | 2.4% | 5.1% | NA | NA |
| Comparable subgroup | Other brand (not listed) | 3.1% | 3.7% | 10.5% | < 0.0001 | 0.0128 |
a Naïve analysis includes all youth participants, regardless of methodological differences between waves.
b Comparable subgroup analysis includes only youth participants aged 14–17 who self-administered the survey.
Additional interaction analyses examined how age-range differences may be associated with trends in patterns of use over the prior 3 years. For most flavors, there was no interaction between age range and wave, with the sole exception of tobacco flavor, where the mean effects of age group and wave were significant as was their interaction (p < 0.05 for all with a Bonferroni correction of 5 flavor comparisons), reflecting the fact that the effect of age on use of tobacco-flavored ENDS varied by wave, while the effects on use of other flavors use did not.
With respect to device type, an interaction of age range and wave was found only with trends in pod/cartridge ENDS products: while there was no main effect on use of cartridges overall (i.e., across waves), there was an interaction between age and wave (p = 0.0055) such that youth aged 14–17 showed larger declines in use of cartridges over the prior 3 years (55.6% to 17.5%) than youth aged 12–13 (30.8% vs. 24.8%, respectively). Age was not significantly associated with endorsement rates in other device types or their trends over time.
Finally, with respect to JUUL as usual/last-used brand, there were strongly significant main effects of both age and wave as well as their interaction (p < 0.0001 for all) on estimates of JUUL as usual/last-used ENDS brand. Specifically, at Wave 5, youth aged 12–13 (vs. 14–17) were more likely to report JUUL as their usual/last-used brand (29.2% vs. 23.7%, respectively). However, in addition to an overall decline in use of JUUL as usual/last-used brand over the prior 3 years (p < 0.0001), this age difference reversed in Wave 7 (p < 0.0001 for interaction between age and wave), when no 12–13-year-olds reported JUUL use (vs. 5.4% of 14–17-year-olds).
DISCUSSION
This analysis extends previous analyses (6) documenting methodological artifacts in PATH that impact estimates of youth ENDS use prevalence, here focusing on the impact of Wave 6 youth being older than usual (14–17 vs. 12–17), in combination with the previously-reported survey-mode difference. Estimated rates of P30D ENDS use differ substantially between naïve analyses and comparable-subset analyses, with higher prevalence among self-interviewed and older (ages 14–17) youth. In addition to age group having an effect on estimated rates of P30D ENDS use, it also had an effect on age-specific trends (i.e., an interaction between age and wave) such that older youth showed larger declines over the prior 3 years. Methodological differences generally impacted patterns of ENDS use (including frequency of use, device type, flavors, and usual brand) to a lesser degree, in that both patterns of use and trends over time were similar across naïve vs. comparable-subgroup analyses. Age range did, however, impact both point-estimates and trends across time in the use of tobacco-flavored ENDS, use of JUUL as usual/last-used brand (such that 12–13-year-olds had larger declines in JUUL use over the prior 3 years), and use of pod/cartridge device types (such that 14–17-year-olds had larger declines in pod/cartridge use).
These analyses are consistent with prior work in PATH (6) and NYTS (National Youth Tobacco Survey) (14, 15) showing that COVID-related changes in survey methodology introduce artifacts that complicate comparisons across waves. The survey-mode artifact seems to be at least partly explained by social desirability bias (6, 14), as youth who interact with a live person to give their responses are less likely to report on sensitive behaviors including ENDS use (16, 17). The current analysis extends this work to highlight the impact of an age-range difference which further complicates prevalence comparisons, as Wave 6’s relative absence of younger participants (∼12–13 years) who are less likely to use ENDS, may result in higher apparent rates of P30D ENDS use, all else (including survey mode) being equal.
On the other hand, patterns of ENDS use are not sub-stantially impacted by methodological changes across waves, suggesting that among youth who use ENDS, those who are willing to disclose that behavior in the survey also go on to also report their detailed patterns of use in similar fashion. That is, social desirability may impact the initial reporting of ENDS use but does usually appear to bias responses to more detailed questions on patterns of use once the participant has initially disclosed ENDS use.
A similar phenomenon may apply to age, whereby older youth (14–17 vs. 12–17) are more likely to use ENDS, but among those who do use ENDS, patterns of use are similar. There were some exceptions, notably use of tobacco flavor (but no other flavors), use of JUUL as usual/last-used brand (though other brands could not be evaluated), and use of pod/cartridge ENDS (but not other device types). The reason why age impacted the rates of P30D ENDS use and trends of these specific patterns of use is unclear, but could be due to the diversification of the ENDS market: younger youth (12–13) may have initiated after the proliferation of non-tobacco flavors and disposable devices, explaining their lower use of tobacco flavor and pod/cartridge ENDS (and accordingly, use of JUUL, a brand that sells pod/cartridge products) over the prior year. Similarly, migrating to flavors also explains the steeper decline in use of tobacco flavor and pod/cartridge devices among older youth (14,15,16,17).
Trends in patterns of use over time are consistent with other analyses of US youth. In particular, there has been a large shift away from pod/cartridge devices and towards disposable device types since 2020 (10, 13, 18), and the current analysis shows that this trend continues in PATH Wave 7. Use of common brands has changed accordingly, i.e., away from JUUL in Wave 5 to Puff and Hyde in Waves 6 and 7 (brands that sell disposables). Use of fruit and candy/sweet flavors remains consistently high. Frequency continues to be bimodally distributed—with approximately 33–40% (across analyses) using frequently (i.e., 20+ days in P30D), just under half using on only 1–5 days per week, and few using on an intermediate number of days—consistent with youth use of nicotine/tobacco products in general (19).
Additionally, the youth ENDS use trends in this analysis broadly align with those of other nationally-representative surveys of US youth, including NYTS and Monitoring the Future (MTF), which also show a substantial decline in youth ENDS use since 2019–2020 (20, 21) and a shift towards disposable ENDS and away from pod/cartridge-based ENDS (22, 23). However, it is important to note that while trends are consistent across surveys, point estimates vary due to methodology differences (sampling strategy, survey mode, etc.). For example, PATH’s estimates of youth P30D ENDS use prevalence are consistently lower than NYTS’s (8.6% vs. 20.0%, respectively, in the 2019 peak; and 5.4% vs. 9.4% in W7/2022 (24–25). Thus, cross-survey inference should not seek to reconcile small discrepancies in estimates but rather focus on trends and approximate estimates (provided survey methodology is consistent over time).
Though the current findings are specific to the U.S. with respect to specific trends in youth ENDS use, the methodological implications are relevant to youth surveillance efforts globally. Namely, these findings highlight the importance of maintaining the same survey methodology over different waves so that trends can be derived accurately. If changes in survey methodology do occur, this can create artifacts that could be misinterpreted as changing trends, e.g., different prevalence due to non-equivalent age ranges of participants as shown here, or due to COVID-related changes to survey mode in PATH (6) and NYTS (14–15). Thus, it is essential for the study team to test for, and document, any artifacts due to survey administration so that researchers can account for them when analyzing data. However, even when the study team has documented methodology changes that prevent direct comparisons across waves – such as the COVID-related change to survey mode in NYTS 2021 (14–15) and several large changes to Canadian youth surveillance surveys (26) – researchers sometimes fail to account for these and inappropriately infer trends (27–28). Researchers, therefore, also have a responsibility to be cognizant of, and account for, such artifacts when analyzing data from these surveys.
Limitations include the self-reported nature of data, which may be inaccurate due to recall bias and (as discussed above) social desirability bias. Additionally, there is the possibility of a self-selection bias in the survey mode in Wave 6, as some participants who were eligible for in-person self-administered survey completion nevertheless elected a telephone interview. Unfortunately, there is no data indicating which telephone-interviewed participants elected vs. were assigned a telephone interview. Regardless of this possible self-selection, however, there remains a significant difference in ENDS use prevalence by survey mode that future research should take into account.
CONCLUSIONS
Methodological differences in survey mode and age range complicate comparisons of youth ENDS use prevalence in PATH Waves affected by COVID-related changes and, generally to a lesser extent, patterns of ENDS use (i.e., frequency of use, usual device type, flavors, and brands). Future analyses of PATH trends in youth ENDS use behaviors that include Waves 5.5 and 6 must account for survey mode and age; or alternatively, only directly compare Waves 5 and Wave 7, which are approximately equivalent.
Notes
[7] Supplementary material SUPPLEMENTARY INFORMATION
This publication contains supplementary material available on the Journal’s website.
[8] Financial disclosure FINANCIAL SUPPORT
This study was funded by Juul Labs, Inc. Juul Labs, Inc. had an opportunity to comment on the near-final draft of the study, but did not have any role in data management, analysis, interpretation of data, manuscript preparation, or decision to submit the manuscript for publication.
[9] ETHICAL APPROVAL AND INFORMED CONSENT
This is a secondary analysis of the anonymized PATH data. The PATH study was conducted by Westat, Inc. and approved by Westat’s institutional review board. This secondary data analysis of PATH data was determined exempt from IRB oversight by a qualified IRB. All analyses were performed in accordance with the relevant guidelines and regulations.
[10] DECLARATION OF INTEREST
Through Pinney Associates (PA), authors AS, SK, and MH consult to Juul Labs, Inc (JLI) on nicotine vapor products to advance tobacco harm reduction. Additionally, AS serves as a scientific advisor to the Global Forum on Nicotine (GFN) in exchange for travel support to the annual GFN conference and a small honorarium. In the past 3 years, PA has also consulted to Philip Morris International (PMI) solely on US regulatory pathways for non-combustible, non-tobacco nicotine products. PA does not consult on combustible tobacco products. In the past 3 years, AS has also consulted on behavioral science to the Center of Excellence for the Acceleration of Harm Reduction (CoEHAR), which received funding from the Global Action to End Smoking (GA). Neither PMI, GFN, CoEHAR, nor GA had any role in, or oversight of, this manuscript.
[11] DATA AVAILABILITY
The restricted-use data files from the Population Assessment of Tobacco and Health (PATH) Study were used: https://www.icpsr.umich.edu/web/NAHDAP/studies/36231. Researchers may obtain access to the restricted-use data by submitting an application to the Inter-University Consortium for Political and Social Research (ICPSR).
[12] CREDIT STATEMENTS
AS: Conceptualization, Investigation, Project administration, Writing - original draft, Writing - review and editing; MJH: Data curation, Formal analysis, Methodology, Software, Writing - review and editing; SK: Conceptualization, Investigation, Visualization, Writing - review and editing; SS: Supervision, Investigation, Methodology, Writing - review and editing.