
1. INTRODUCTION
Nicotine pouch products are modern oral nicotine products that do not contain tobacco leaf and are intended for adult use (1,2,3,4,5,6,7). Instead of tobacco leaf, these products contain ingredients such as microcrystalline cellulose, pH adjusters, stabilizers, sweeteners, flavor additives, and nicotine (either tobacco-derived or synthetic) (8,9,10). Differences in the particle size of these products may be one physical characteristic that results in differences in product performance (11,12,13). Three analytical techniques, including sieving, dynamic image analysis, and laser diffraction, are commonly used across laboratories to characterize particle size distributions (PSD). The results of these methods are a combination of the size and shape of the particles in the sample (14).
Sieving is a traditional and widely used method for particle size analysis, where particles are separated based on size by passing them through a series of sequentially smaller mesh screens (15, 16). The largest particles collect on the top sieve, while the smallest accumulate at the bottom of the stack in a catch pan. Separation occurs through mechanical actions such as shaking, tapping, vibrating, or other movements applied to the sieve stack. The results are typically presented as mass-based distributions, with the resolution of the analysis determined by the total number of sieves in the stack. While sieving is cost-effective and easy to understand compared to other methods, it is labor-intensive and time-consuming, making it less efficient for processing high sample volumes (16).
Dynamic image analysis (DIA) is a modern technique that captures and analyzes high-resolution images of individual particles in motion to directly measure their size and shape (17). In practice, particles are dispersed in a fluid, an airstream, or through free fall and pass through a detection zone equipped with a light source and a high-speed camera. The camera records the silhouettes created (or shadows cast) as particles pass through the path of the light source. These images are then processed using various algorithms to extract shape and size characteristics, which are used to generate a particle size distribution plot and distribution intercepts (17, 18).
Examples of shape characteristics include the diameter of an equivalent circle (or equal projection of a circle) and the Feret minimum or maximum (the minimum or maximum diameter of two parallel tangents around the particle). The size distributions can be weighted by count, surface area, or volume, with volume-weighted results being the most commonly used. DIA offers high sensitivity and is particularly suited for applications where detailed shape characteristics are critical. The results are comprehensive and widely applicable, but they can be influenced by the sampling and dispersion methods used. Additionally, the particle size range is constrained by the resolution of the camera, making this technique traditionally unsuitable for particles smaller than 2 μm (19, 20).
Laser diffraction is an indirect technique that determines particle size by analyzing the relationship between the size of a particle and the angle and intensity of scattered laser light, as described by the Mie Theory (21). This method requires relatively small sample sizes compared to traditional techniques like sieving and enables rapid measurements with high throughput. The results are typically volume-weighted and rely on the assumption that particles are spherical, similar to the equivalent projection of a circle (EQPC) used in DIA. For accurate measurements, knowledge of the refractive index of the particles being tested is essential. Despite these limitations, laser diffraction offers a broad dynamic range, typically spanning from 0.1 μm to 2000 μm. However, the resolution can be affected by the overlap of scattering patterns, which may limit the precision of measurements for certain particle size distributions (22,23,24).
Discrepancies in methodology, sample preparation, and instrumentation can lead to variability in results, particularly when analyzing materials of differing physical states – such as dry and wet fillers. To address this, a proficiency testing (PT) program was organized involving eight laboratories. Each laboratory analyzed four nicotine pouch filler samples, two dry (CP1 and CP3) and two wet (CP2 and CP4), using each laboratories’ routine PSD method. Four laboratories performed sieving, two performed dynamic image analysis, and two performed laser diffraction. Each laboratory was asked to perform its standard particle size method and to provide the particle size distributions and the distribution intercepts at 10%, 50%, and 90%, or the Dx[10], Dx[50], and Dx[90], respectively. The results were then compared to determine if there were differences between laboratories within each method and between different methods. Particle size is important in nicotine pouch products because it affects manufacturing consistency and product quality of the filler, and differences between analytical technologies can lead to significant variation in measured particle size values. This study evaluates inter-laboratory performance, compares method-specific trends, and identifies areas for standardization and improvement in PSD analysis.
MATERIALS AND METHODS
Nicotine pouch products and reagents
Four nicotine pouch fillers without pouch material were used in this proficiency study with the product description and manufacturers for each product summarized in Table 1. Two of the products tested (CP1 and CP3) were dry nicotine pouch fillers (no added moisture), and two of the products tested (CP2 and CP4) were wet nicotine pouch fillers (nicotine pouch filler with added moisture). The designation “CP” refers to commercial products, as all samples were commercially manufactured nicotine pouch fillers obtained directly from the product manufacturers listed in Table 1 prior to being pouched. Each commercial product was sourced from a single production lot of each filler and was not processed further prior to distribution to the participating laboratories. The use of commercially produced nicotine pouch filler was intentionally selected over laboratory-prepared control or reference materials to capture both analytical method differences and inherent variability typical of commercial nicotine pouch fillers. All products were kept at ambient conditions and shipped to the participating laboratories by the manufacturer. Each participating laboratory used the samples as received and ran its standard particle size method to report data.
Sieving analysis methods
Four laboratories (Labs 1–4) used sieving analysis as their standard method. Labs 1, 2, and 4 used a Retsch AS 200 vibratory sieve shaker (Haan, Germany). Lab 3 participated in sieving analysis using a Tyler Ro-Tap Sieve Shaker (Ohio, USA). Sieve pans made of stainless steel and metal screen were used in all cases. The settings for the sieve shaker and stack of sieves pans were different for each laboratory, with the differences described below, and the sieve stacks summarized in Table 2. For Lab 1 the sieve shaker was set to an amplitude of 1.5 mm/”g” with 100 g sample size run for 5 min. Lab 2 used 50 g of sample with the amplitude set to 2.0 mm/”g” for 10 min. Lab 3 set the sieve shaker to 290 vibrations and 156 taps/min for 5 min using 25 g of samples. Lab 4 used 200 g of sample with the amplitude set to 2.0 mm/”g” for 30 min. This laboratory was also the only one to put rubber balls in each pan to aid in breaking up any clumps that might be present in the sample. Only CP1 and CP3 dry nicotine pouch filler samples were run since the wet nicotine pouch filler blocked the sieve screens, leading to unreliable results. Each sample was run in triplicate.
Table 2.
Screen size of sieve stack fractions used by Labs 1–4 for particle size analysis by sieve. The bold values indicate fractions used by all laboratories, with the summary shown in the composite sieve stack used for graphical analysis.
| Sieve screen particle size (μm) | ||||
|---|---|---|---|---|
| Lab 1 | Lab 2 | Lab 3 | Lab 4 | Composite stack |
| 900 | 710 | 500 | 500 | 500 |
| 500 | 500 | 420 | 250 | 250 |
| 400 | 355 | 355 | 200 | 125 |
| 300 | 250 | 250 | 125 | Catch (<125) |
| 250 | 180 | 180 | 100 | |
| 200 | 125 | 125 | 75 | |
| 150 | 90 | Catch (<125) | 63 | |
| 125 | 63 | 45 | ||
| 100 | Catch (<60) | Catch (<45) | ||
| 90 | ||||
| Catch (<90) | ||||
Dynamic image analysis methods
The second method used for this study was dynamic image analysis (DIA) conforming to ISO standards for DIA and graphical representations (17, 18). Labs 5 and 6 performed image analysis using the QICPIC DIA system with a vibrating sample tray (VIBRI) from Sympatec (Pennington, NJ, USA). Each laboratory used a different module to disperse the sample into the DIA system, with the differences noted below.
For Lab 5, an air dispersion module (RODOS) with a pressure of 0.3 bar and a vacuum of 45 mbar was used. The QICPIC used by Lab 5 was equipped with an LED light source, a camera system with an M5 lens with a measuring range of 1.8–3755 μm, and a sensor that captures images at an 85 Hz frame rate. The results were calculated as the Feret minimum with distributions weighted by volume (q3). Lab 6 used a gravity-fall dispersion module (GRADIS) fitted with a 4.0 mm cuvette. The QICPIC used by Lab 6 was equipped with a pulsed laser light source, a camera system with a M8 lens with a measuring range of 20–6820 μm, and a sensor that captures images at a 25 Hz frame rate. The result outputs were calculated as the equal projection of a circle (EQPC) with distributions weighted by volume (q3).
Laser diffraction methods
Laser diffraction was carried out by Labs 7 and 8, with both laboratories using a Mastersizer 3000 with an AERO-S sample feeder (Malvern Panalytical, Malvern, UK). For Lab 7, 20 g of dry filler (CP1 and CP3) and 10 g of wet filler (CP2 and CP4) were used per replicate, with six replicates performed per sample. The instrument settings were 2.5 bar air pressure for dry filler (CP1 and CP3) and 3.8 bar air pressure for wet filler (CP2 and CP4); feed rate of 5% for CP1, 10% for CP3, and 70% for CP2 and CP4; and measurement time of 10 s for dry filler and 15 s for wet filler. The Dx[10], Dx[50], and Dx[90] were calculated, as well as distributions using 12 pans measured as a fraction percent.
For Lab 8, 5 g of filler was used, with six replicates performed per sample. The instrument settings were the same for all samples and are as follows: 1 bar air pressure for all fillers with a feed rate between 0.1 and 15% and a measurement time of 10 s for background and 40 s for the filler samples. The feed rate was optimized for each product for consistent particle size measurements. The Dx[10], Dx[50], and Dx[90] were calculated, as were distributions using 101 bins as the distribution percent.
RESULTS AND DISCUSSION
Sieving analysis results
The classical method for particle size analysis is sieving, where the particles are separated based on size by passing through a series of screens of decreasing mesh size. The results of these experiments are mass-related distributions (typically weight percent). This method was employed by the greatest number of laboratories (four), each using different sieve stack configurations as detailed in Table 2. Only the dry products (CP1 and CP3) were analyzed, since wet samples would clog the sieve screens, and drying them would alter the particle size compared to their original wet state in the pouch. The distribution intercepts at 10%, 50%, and 90% (Dx[10], Dx[50], and Dx[90]) for each laboratory are summarized in Table 3 and discussed as follows. For Labs 1–4, the Dx[50] values were close at 315.3 μm, 325.4 μm, 314.3 μm, and 315.2 μm for CP1, respectively. For CP3, the Dx[50] values for Labs 1–4 were 288.7 μm, 278.3 μm, 277.7 μm, and 299.2 μm. The percent differences for the Dx[50] values across the four laboratories were 3.5% and 7.5% for CP1 and CP3, respectively.
Table 3.
Sieving particle size results for dry nicotine pouch filler. The values represent the average of intercepts at 10%, 50%, and 90% of three replicates (n = 3) and the error represents one standard deviation (1 σ).
| Particle size (μm) | ||||
|---|---|---|---|---|
| Value | Lab 1 | Lab 2 | Lab 3 | Lab 4 |
| CP1 – Dry filler 1 | ||||
| Dx[10] | 129.7 ± 7.0 | 143.1 ± 3.4 | 139.1 ± 10.6 | 131.7 ± 3.7 |
| Dx[50] | 315.3 ± 14.2 | 325.4 ± 2.0 | 314.3 ± 24.0 | 315.2 ± 12.9 |
| Dx[90] | 652.3 ± 29.9 | 623.2 ± 3.3 | 500.0 ± 0.0 | 534.8 ± 6.4 |
| CP3 – Dry filler 2 | ||||
| Dx[10] | 165.0 ± 8.7 | 151.2 ± 0.9 | 161.9 ± 10.1 | 156.4 ± 1.1 |
| Dx[50] | 288.7 ± 8.1 | 278.3 ± 2.0 | 277.7 ± 4.4 | 299.2 ± 4.8 |
| Dx[90] | 438.0 ± 10.4 | 434.7 ± 2.5 | 416.0 ± 0.7 | 469.2 ± 5.1 |
Slightly higher differences were observed in the Dx[10], where there was a 9.8% difference for CP1 with a range of 129.7–143.1 μm between laboratories. A similar 8.7% difference was observed for CP3, where the results ranged 151.2–165.0 μm. The sieve pan with the smallest screen size was not the determining factor, nor was the presence of rubber balls (only used by Lab 4) to break up clumps. The largest differences were seen in the Dx[90] with 26.4% difference for CP1 and 12.0% difference for CP3 between the highest and lowest values. However, higher values were observed with more sieve pans being closer to the Dx[90] value being used.
Since the four laboratories used different sieve stacks to produce results, a common sieve stack was needed to visualize and compare the distributions. To generate this common sieve stack, 500, 250, and 125 μm sieve pans and a catch pan for particles less than 125 μm were used by all four laboratories, with the weight percent between two composite sieve pans added together to create a common composite bin. For example, in the case of Lab 2, the weight percent of the 710 μm and 500 μm sieve pans were added together for the 500 μm composite bin; the 355 μm and 250 μm weight percents were added together for the 250 μm composite bin; the 180 μm and 125 μm weight percents were added together for the 125 μm composite bin; and the 90 μm, 63 μm, and catch pan weight percents were added together for the composite catch pan. The resulting composite pan distributions were then displayed as distributions as shown in Figure 1. For both CP1 and CP3, the results are consistent across all four laboratories, suggesting that the differences observed in the statistical analysis of the intercept values are driven by the sieve pan size and the number of sieves selected (discussed in detail later).
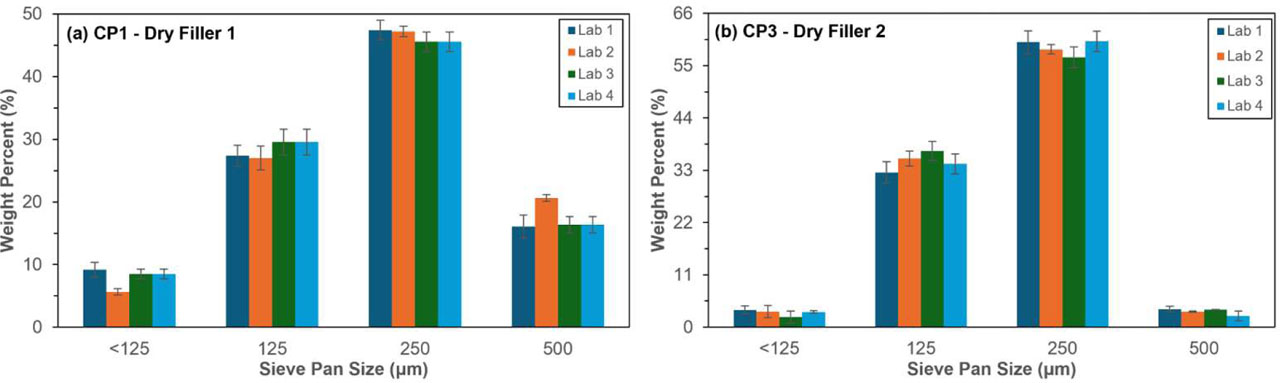
Figure 1.
Sieving particle size distributions using a consolidated sieve stack for dry nicotine pouch fillers (a) CP1 and (b) CP3. Each bar graph is the average of three replicates (n = 3) and the error bars represent one standard deviation (1 σ).
Dynamic image analysis results
Dynamic image analysis (DIA) captures images of particles in motion and analyzes their shape and size. The results derived from this method can be different from those of other methods due to random particle orientation. DIA was performed by Labs 5 and 6, with each laboratory using a separate sample introduction module to the DIA camera and different shape parameters for calculations, but with both laboratories using volume-weighted results. The results for the intercepts for both laboratories are summarized in Table 4. The distributions for dry products (CP1 and CP3) are shown in Figure 2 and wet products (CP2 and CP4) are shown in Figure 3.
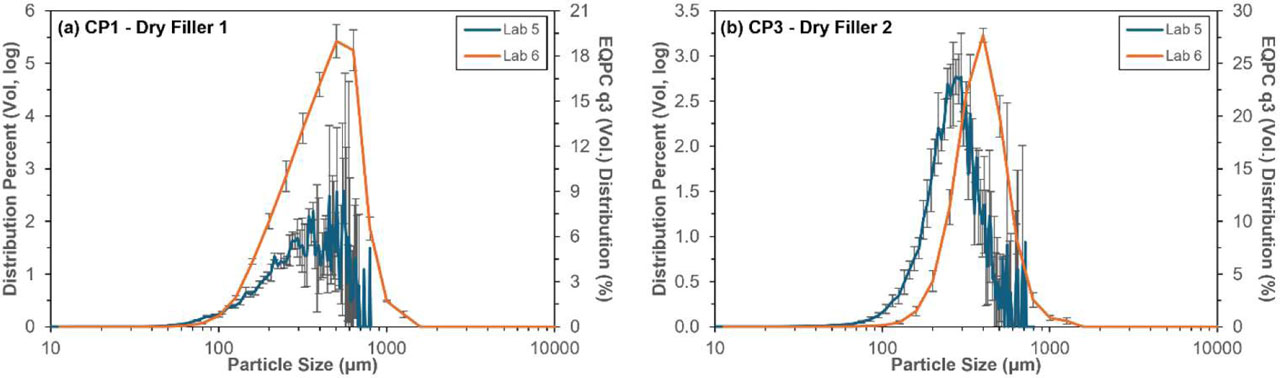
Figure 2.
Dynamic image analysis particle size distributions (PSD) plots for dry nicotine pouch fillers (a) CP1 and (b) CP3. For Lab 5, distributions are calculated as the Feret minimum diameter with the distribution percent shown and each bar is the average of three replicates (n =3). For Lab 6, distributions are calculated as the equal projection of a circle (EQPC) with the volume-weighted (q3) distribution of six replicates (n = 6) shown. The error bars represent one standard deviation (1 σ).
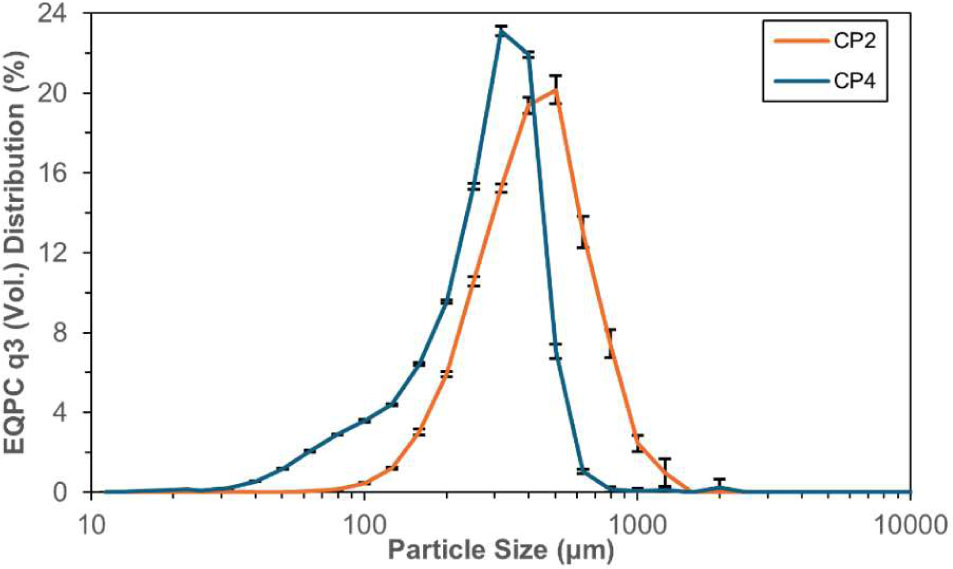
Figure 3.
Dynamic image analysis particle size distribution (PSD) plots for wet nicotine pouch products (CP2 and CP4). Distributions are calculated as the equal projection of a circle (EQPC) with the volume-weighted (q3) distributions of six replicates (n = 6) shown. The error bars represent one standard deviation (1 σ). Results performed by Lab 6.
Table 4.
Dynamic image analysis particle size results for nicotine pouch fillers. The values represent the average of intercepts at 10%, 50%, and 90% of three replicates (n = 3) for Lab 5 and six replicates (n = 6) for Lab 6. The error represents one standard deviation (1 σ). Note that CP2 and CP4 were not tested by Lab 5.
| Particle size (μm) | ||||
|---|---|---|---|---|
| Value | CP1 | CP2 | CP3 | CP4 |
| Lab 5 | ||||
| Dx[10] | 143.97 ± 4.18 | – | 156.76 ± 9.73 | – |
| Dx[50] | 327.66 ± 14.79 | – | 262.25 ± 13.55 | – |
| Dx[90] | 560.68 ± 39.43 | – | 420.29 ± 42.63 | – |
| Lab 6 | ||||
| Dx[10] | 174.65 ± 0.93 | 194.41 ± 2.54 | 216.76 ± 10.49 | 96.50 ± 0.95 |
| Dx[50] | 381.14 ± 15.44 | 373.68 ± 2.40 | 346.38 ± 11.31 | 262.20 ± 0.80 |
| Dx[90] | 625.96 ± 8.33 | 650.36 ± 25.22 | 535.26 ± 24.91 | 394.05 ± 0.55 |
For Lab 5, an air dispersion module was used to introduce the sample into the DIA camera system. The Feret minimum (Feret min, or Fmin), the minimum of multiple diameters taken between two parallel tangent planes at an arbitrary angle (a Feret diameter), was used for all shape calculations in the sample.
For Lab 6, a gravity-fall system was used to introduce the sample into the DIA camera system. The equal projection of a circle (EQPC), the diameter of a circle that has the same area as the image of the particle captured, was used for all shape calculations. This method forces a shape on a particle and does not observe a minimum. This generates EQPC results with larger values compared to using the Fmin shape factor.
The distributions of CP1 (Figure 2(a)) overlap between the two laboratories; while for CP3 (Figure 2(b)), the distribution for Lab 5 was shifted slightly lower compared to Lab 6. This behavior is expected given the use of different shape descriptors and sample introduction modules between the two laboratories. The magnitude of this effect depends on the underlying particle populations. For CP1, the particle size distribution was sufficiently narrow that the differences in shape parameter selection had minimal impact on the resulting distribution. In contrast, CP3 exhibited a broader particle size distribution, increasing sensitivity to shape parameter and dispersion differences and resulting in a shift between laboratories.
These differences are observed in the intercept values, where the Dx[50] values for CP1 showed a 15% difference between 327.66 μm and 381.14 μm for Labs 5 and 6, respectively.
Differences were larger for CP3 (28%) with values of 262.25 μm and 346.38 μm for Labs 5 and 6, respectively. Differences in the capability of methods to capture fine particles are observed through the Dx[10] values. Here, CP1 was 19% higher for Lab 6 (143.97 μm for Lab 5 and 174.65 μm for Lab 6), and CP3 had a 32% difference (156.76 μm for Lab 5 and 216.76 μm for Lab 6). This larger difference may be due to the lens used to capture images as well as the sample introduction module used. The lens used by Lab 5 can focus on particles as small as 1.8 μm, while the limit for Lab 6 was 20 μm. The air dispersion module used by Lab 5 can separate any small agglomerates held together by weak forces, whereas the gravity fall module used by Lab 6 lacks additional force to break apart agglomerates. Unlike sieving, the DIA results for the Dx[90] values had the lowest percent difference. For CP1, the percent difference of the Dx[90] values for Labs 5 and 6 was 11% (560.68 μm and 625.96 μm), and for CP3, the percent difference was 24% for the Dx[90] values of 420.29 μm and 535.26 μm for Labs 5 and 6, respectively. Due to the air dispersion module not being suitable for wet material, Lab 5 was unable to perform DIA measurements on CP2 and CP4. The gravity-fall module used by Lab 6 allowed the wet filler to pass through and separate particles.
The DIA distributions for CP2 and CP4 are shown in Figure 3. Both products have a single mode with a Dx[10] of 194.41 μm for CP2 and 96.50 μm for CP4. The Dx[50] values for CP2 and CP4 were 373.68 μm and 262.20 μm, respectively. The Dx[90] values were 650.36 μm and 394.05 μm, respectively.
Laser diffraction results
During laser diffraction particle size measurements, particles pass through a laser, and the pattern of light scattered is used to measure the particle size. This is an indirect method of particle size determination that is fast and able to measure a wide range of particle sizes, particularly smaller particles (<1 μm). Laser diffraction was the only method capable of measuring all four products. The intercepts at 10%, 50%, and 90% for the laser diffraction results are summarized in Table 5 with the distributions shown in Figure 4. Both Labs 7 and 8 used the same instrumentation, but the distribution output is displayed differently (fraction percent for Lab 7 and distribution percent for Lab 8).
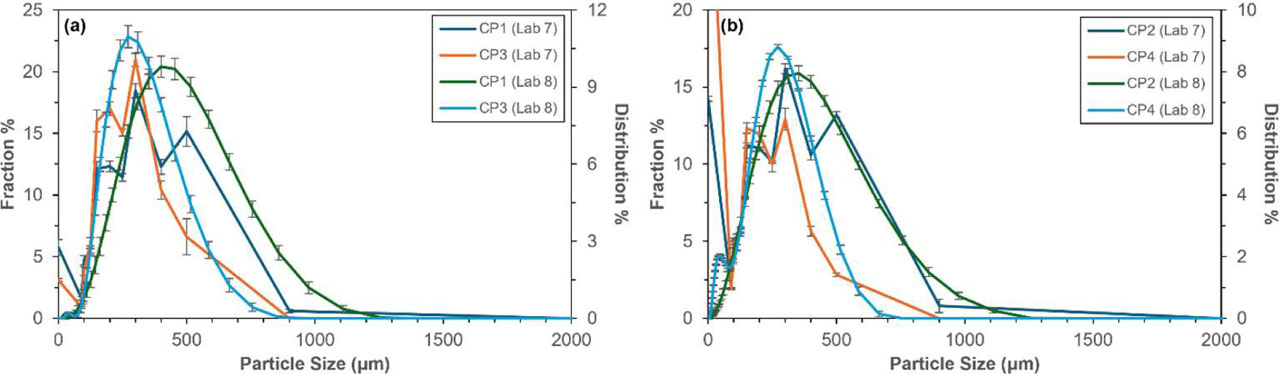
Figure 4.
Laser diffraction particle size distribution (PSD) plots for nicotine pouch fillers where (a) summarizes dry pouch fillers (CP1 and CP3) and (b) summarizes wet pouch fillers (CP2 and CP4). Samples tested by Lab 7 are measured as fraction % and samples tested by Lab 8 are represented as distribution %. Distributions are the average of six replicates (n = 6) shown and the error bars represent one standard deviation (1 σ).
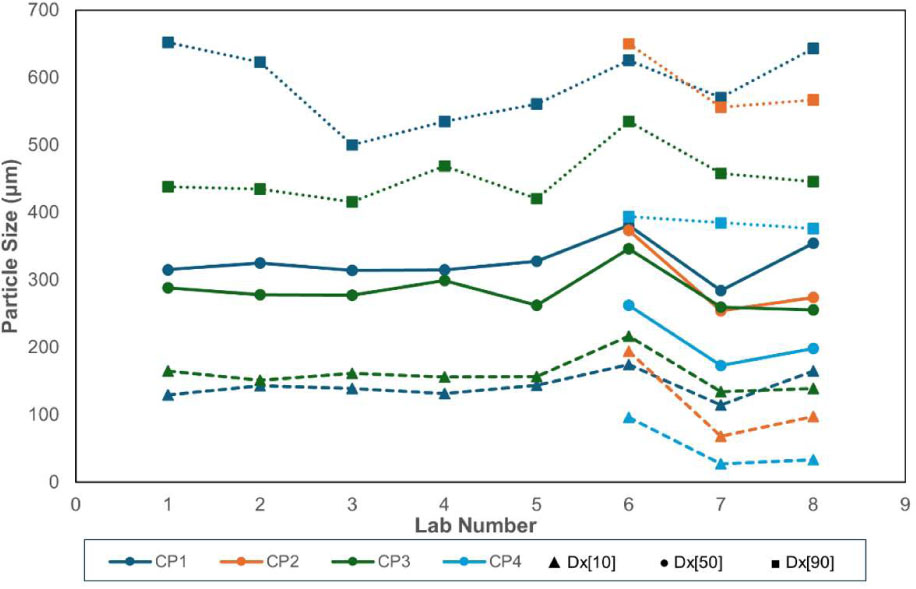
Figure 5.
Graph representing the distribution intercepts at 10%, 50%, and 90% (Dx[10], Dx[50], and Dx[90]) for the four nicotine pouch fillers tested by Labs 1–8. The Dx[10] results are represented as triangles and dashed lines. The Dx[50] results are represented as circles and solid lines. The Dx[90] results are represented as squares and dotted lines. Labs 1–4 performed sieving analysis, Labs 5 and 6 performed dynamic image analysis, and Labs 7 and 8 performed laser diffraction analysis.
Table 5.
Laser diffraction particle size results for nicotine pouch fillers. The values represent the average of intercepts at 10%, 50%, and 90% of six replicates (n = 6) and the error bars represent one standard deviation (1 σ).
| Particle size (μm) | ||||
|---|---|---|---|---|
| Value | CP1 | CP2 | CP3 | CP4 |
| Lab 7 | ||||
| Dx[10] | 114.7 ± 5.2 | 68.2 ± 0.7 | 134.7 ± 3.2 | 27.7 ± 2.6 |
| Dx[50] | 284.2 ± 9.7 | 254.3 ± 2.3 | 259.5 ± 8.0 | 173.5 ± 8.9 |
| Dx[90] | 570.7 ± 13.2 | 556.3 ± 9.6 | 458.3 ± 18.7 | 384.8 ± 4.7 |
| Lab 8 | ||||
| Dx[10] | 165.3 ± 12.2 | 97.8 ± 5.3 | 139.2 ± 5.8 | 33.6 ± 0.2 |
| Dx[50] | 354.8 ± 10.1 | 273.8 ± 4.9 | 255.8 ± 4.8 | 198.2 ± 1.3 |
| Dx[90] | 643.3 ± 14.6 | 567.2 ± 8.9 | 445.5 ± 9.3 | 376.0 ± 4.4 |
The greatest differences between Labs 7 and 8 were seen for product CP1. The Dx[10] was 114.7 μm and 165.3 μm (36% difference), the Dx[50] was 284.2 μm and 354.8 μm (22% difference), and the Dx[90] was 570.7 μm and 643.3 μm (12% difference), respectively. CP3 values were closer between these laboratories, with all differences less than 4%. The Dx[10] values were 134.7 μm and 139.2 μm, the Dx[50] values were 259.5 μm and 255.8 μm, and the Dx[90] values were 458.3 μm and 445.5 μm, respectively. The differences in these values may be explained by looking at the distributions in Figure 4(a). The distributions of Lab 7 are narrower than those of Lab 8, and more particles are captured in the initial bins, which can skew the Dx[10] values lower. This may also explain the higher Dx[90] values since the wider distributions of Lab 8 can skew those values higher.
Similar results are observed with the distributions of the wet products, CP2 and CP4, as shown in Figure 4(b). The initial bins of Lab 7 have more particles captured than Lab 8 compared to the dry product. This results in lower Dx[10] values for Lab 7 (68.2 μm for CP2, and 27.7 μm for CP4) relative to Lab 8 (97.8 μm for CP2 and 33.6 μm for CP4). This calculates to a 36% difference for CP2 and a 19% difference for CP4. The Dx[90] values are higher for CP2 due to the wider distributions of Lab 8; 556.3 μm for Lab 7, and 567.2 μm for Lab 8 (1.9% difference, respectively). The same is not true for CP4, where the value for Lab 7 is higher than Lab 8; 384.8 μm and 376.0 μm (2.3% difference, respectively). The low percent difference would indicate that laser diffraction is an effective technique for wet nicotine pouch product measurements.
Method comparison and statistical analysis
A composite graph of all Dx[10], Dx[50], and Dx[90] for all four products across all eight laboratories is shown in Figure 5. This can be used to give a visual comparison of all results. A statistical analysis of all results was performed by looking at differences within a technique and between techniques, with the box and whisker plots shown in Figure 6 for the dry products and Figure 7 for the wet products. The Tukey means comparisons are summarized in Table 6. Limited data for some methods, such as dynamic image analysis for CP2 and CP4, as well as the limited number of samples tested, suggest that some differences may not be statistically significant but may be of concern, and are therefore included in this discussion.
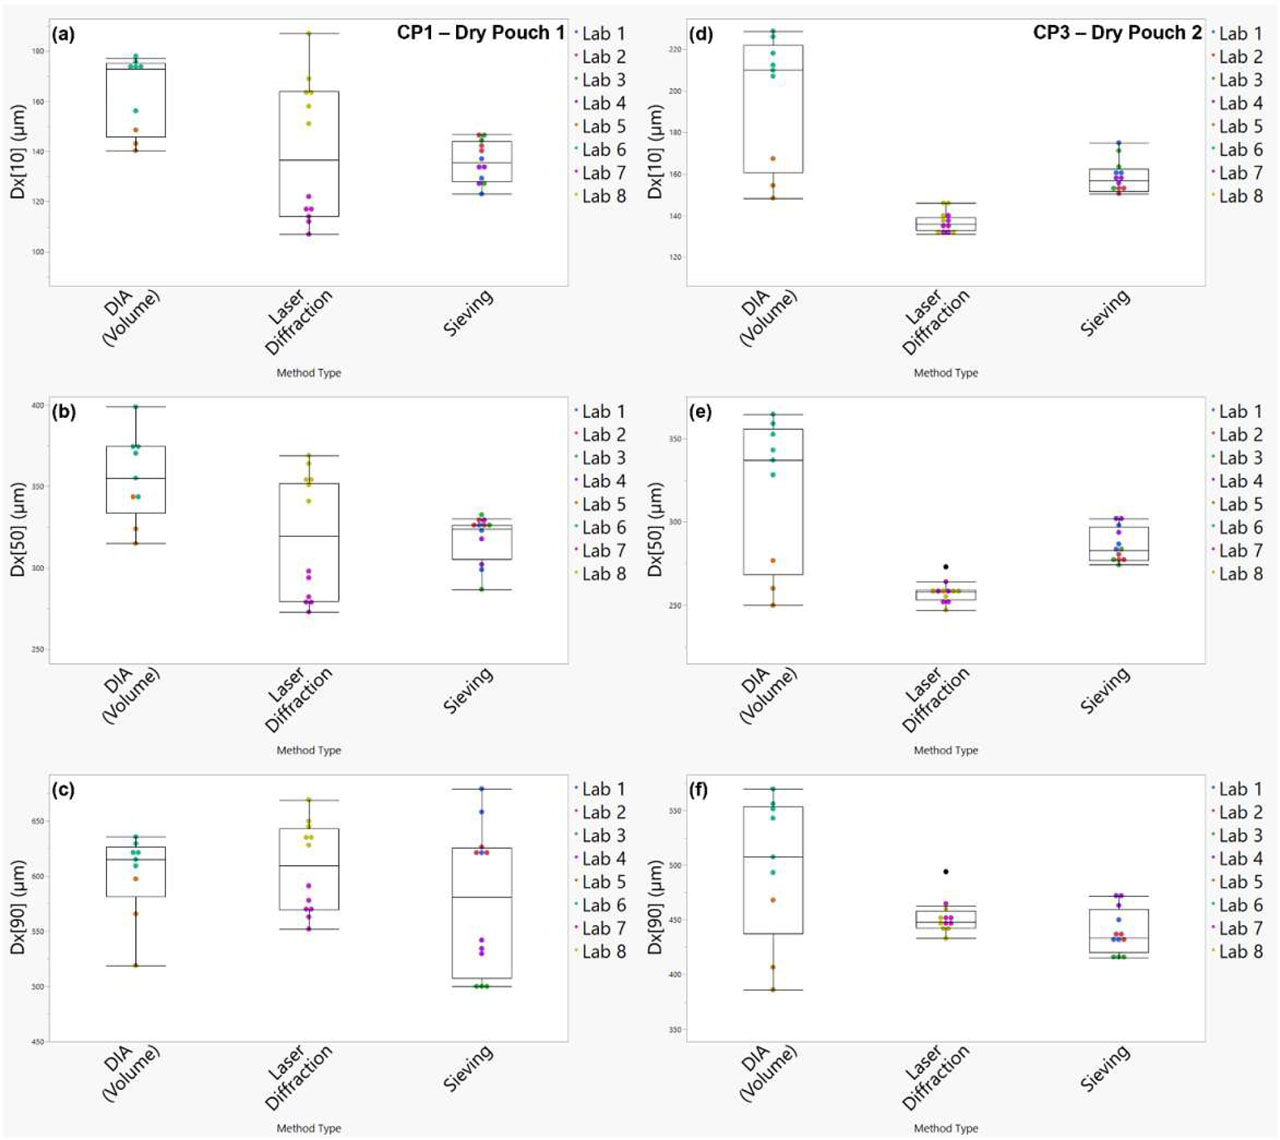
Figure 6.
Box and whisker plots used for particle size method comparison of dry pouch products. Left: CP1 (Dry Pouch Filler 1) (a-c) and right: CP3 (Dry Pouch Filler 2) (d-f) where (a) and (d) show Dx[10] results, (b) and (e) show Dx[50] results, and (c) and (f) show Dx[90] results.
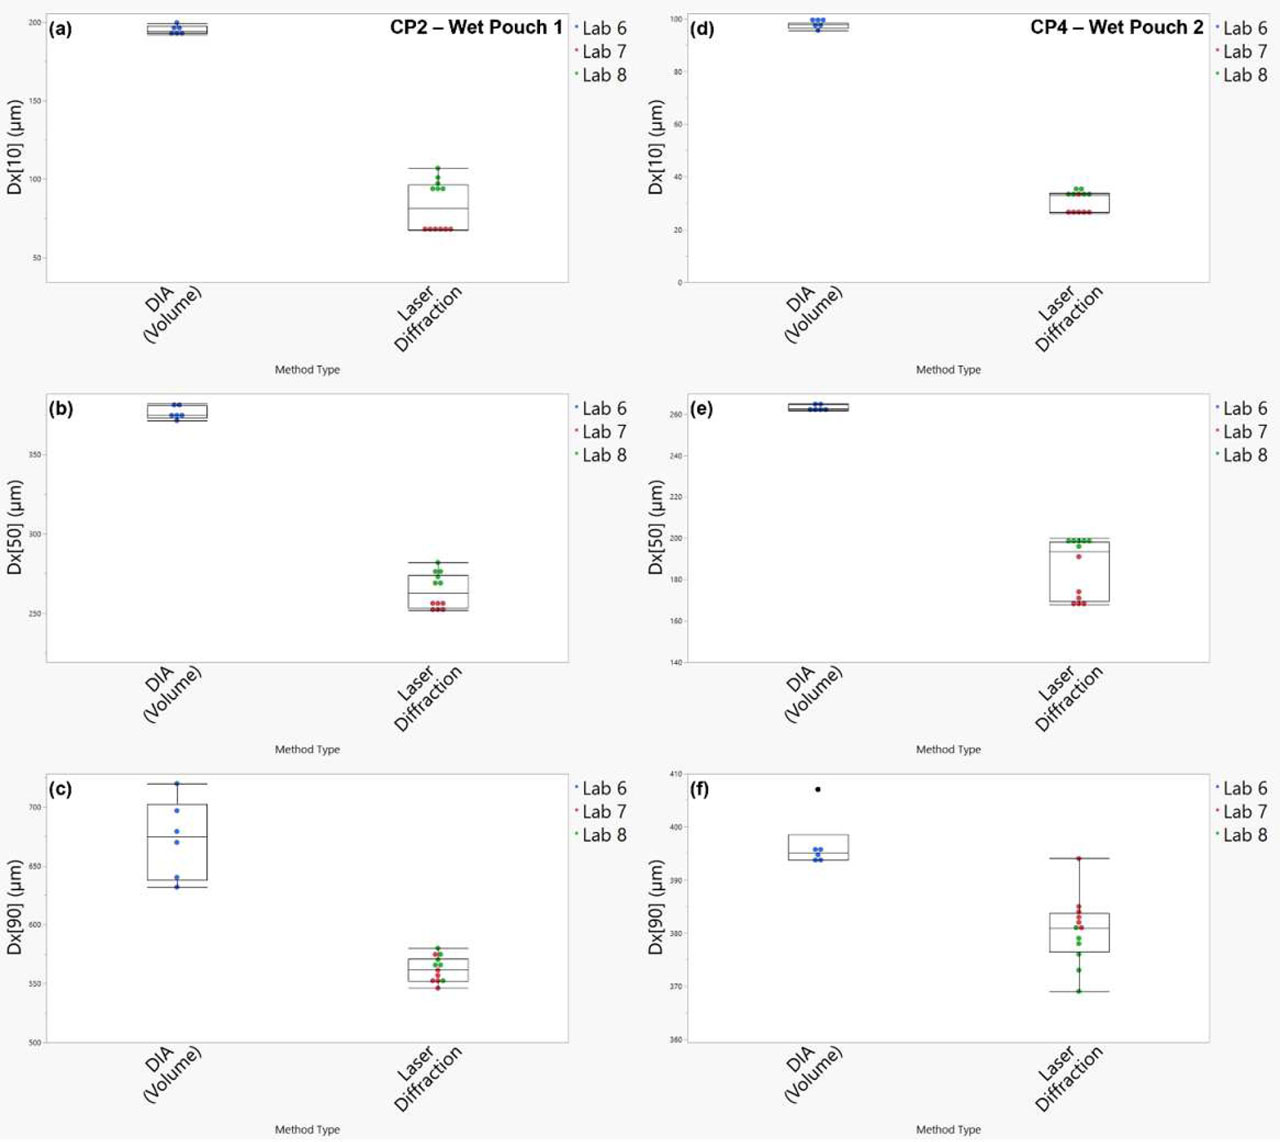
Figure 7.
Box and whisker plots used for particle size method comparison of wet pouch products. Left: CP2 (Wet Pouch Filler 1) (a-c) and right: CP4 (Wet Pouch Filler 2) (d-f) where (a) and (d) show Dx[10] results, (b) and (e) show Dx[50] results, and (c) and (f) show Dx[90] results.
Table 6.
Summary of the results of Tukey means comparison for each distribution intercept to compare differences between particle size methodologies. Levels not connected by the same letter (in different group) are significantly different.
| Mean particle size (μm) | ||||||
|---|---|---|---|---|---|---|
| Dx[10] | Dx[50] | Dx[90] | ||||
| Methodology | Mean | Group | Mean | Group | Mean | Group |
| CP1 – Dry filler 1 | ||||||
| DIA | 162.43222 | A | 355.49111 | A | 607.00000 | A |
| Laser diffraction | 140.00000 | B | 319.50000 | B | 601.49556 | A |
| Sieving | 135.87500 | B | 317.56667 | B | 577.56667 | A |
| CP2 – Wet filler 1 | ||||||
| DIA | 195.03833 | A | 376.17667 | A | 672.88167 | A |
| Laser diffraction | 82.99167 | B | 264.08333 | B | 561.75000 | B |
| CP3 – Dry filler 2 | ||||||
| DIA | 196.88000 | A | 319.03556 | A | 497.84778 | A |
| Laser diffraction | 158.64167 | B | 285.95000 | B | 451.91667 | B |
| Sieving | 136.91667 | C | 257.66667 | C | 439.46667 | B |
| CP4 – Wet filler 2 | ||||||
| DIA | 97.396667 | A | 263.04500 | A | 396.70333 | A |
| Laser diffraction | 30.633333 | B | 185.83333 | B | 380.41667 | B |
Examination of the CP1 results (Figure 6(a)–(c)) reveals statistically significant differences among the particle size analysis methods when all three techniques are considered collectively. Specifically, the Dx[10], Dx[50], and Dx[90] values differed in both absolute magnitude and statistical grouping, reflecting method-dependent measurement behavior. Notably these differences were driven by dynamic image analysis, which was significantly different from both sieving and laser diffraction. In contrast, sieving and laser diffraction were not significantly different from one another for certain distribution intercepts, indicating that these two methods can yield comparable results under specific conditions despite presence of overall inter-method differences. For the Dx[50], the same grouping of dynamic image analysis was significantly different from sieving and laser diffraction, but laser diffraction was the only method with a significant difference within the methods.
All methods were equivalent for the Dx[90], but there was variation within the method for dynamic image analysis and sieving. The equivalence at Dx[90] may reflect a convergence in the detectionoflargerparticle fractions, where methodological differences are less pronounced. The variation within the dynamic image analysis results appears to be within the results of Lab 5, while in all other cases for CP1, the differences within a method are due to differences between laboratories. For the other dry product CP3 (Figure 6(d)–(f)), the Dx[90] showed similar results with dynamic image analysis being significantly different from sieving and laser diffraction (which were equivalent). This pattern reinforces the observation that dynamic image analysis tends to produce higher or more variable values for larger particle intercepts, possibly due to its enhanced sensitivity to particle morphology. However, the Dx[10] and Dx[50] showed that all methods were significantly different. Similarly, there was a significant difference observed within the dynamic image analysis results across all three distribution intercepts. Significant differences within laser diffraction were only observed with the Dx[90] results and were mostly due to an outlier with Lab 7. Overall, these findings emphasize that both methodological and procedural factors must be carefully considered when interpreting inter-laboratory particle size data, and that harmonization of protocols could improve comparability and reproducibility across studies. For the wet products, CP2 (Figure 7(a)–(c)) and CP4 (Figure 7(d)–(f)), both dynamic image analysis and laser diffraction were significantly different across all distribution intercepts. For CP2 there is a significant difference in method variation for both methods. Such inter-method variability suggests that wet samples may present unique challenges, such as agglomeration or inconsistent sample flow, which can affect the reproducibility between laboratories and accuracy of particle size measurements. This is only true for the Dx[50] for CP4; there is no significant difference in within method variation for both the Dx[10] and Dx[90]. These differences may be due to the difficulty in conducting particle size measurements for wet nicotine pouch filler.
CONCLUSIONS
This proficiency study provides a comparison of the three most common particle size analysis techniques (sieving, dynamic image analysis, and laser diffraction) applied to both wet and dry fillers of nicotine pouch products. Each method demonstrated unique advantages and limitations, through evaluation of standard particle size methods across eight participating laboratories. The particle size distributions and Dx[10], Dx[50], and Dx[90] values (distribution intercepts at 10%, 50%, and 90%) provided critical insights into the performance and variability of these techniques. Sieving, a traditional and cost-effective method, demonstrated consistent results for dry fillers, particularly for the Dx[50] value, which represents the median particle size in a unimodal distribution. However, its limitations include its time-consuming nature, hindering high sample throughput, and an unsuitability for wet samples due to clogging. These challenges highlight the need for careful consideration of sample type. Variability in results was influenced by differences in sieve stack configurations, underscoring the importance of standardizing these factors to improve reproducibility for dry nicotine pouches.
Dynamic image analysis (DIA) offered high sensitivity and the ability to characterize both particle size and shape, making it particularly valuable for research and development applications. However, the method exhibited inter-laboratory variability driven by differences in shape parameter settings, sample introduction modules (and therefore sample separation), and the dynamic range of the system due to the optics used. Wet samples also caused challenges due to dispersion issues when using an air dispersion module.
Laser diffraction was shown to be a robust approach capable of analyzing both dry and wet samples across a broad dynamic measurement range. The consistency across laboratories, particularly for wet samples, makes laser diffraction a strong candidate for a standardized testing technology. However, the approach assumes spherical particle shape and accurate refractive index data, which requires refinement for non-spherical particles.
The statistical analysis revealed a significant difference both within and between the three particle size methods, particularly for the Dx[10] and Dx[50] values. These differences were primarily attributed to the inherent limitations of each method and the variability introduced by equipment settings and sample introduction protocols across participating laboratories. For Dx[10], the challenges associated with sieving and DIA in measuring smaller particles were evident. The difference in weighting of bin fractions across methods likely contributed to the observed variability in Dx[50] values. DIA consistently showed a significant difference from sieving and laser diffraction, emphasizing the impact of shape characterization on particle size distribution results. The findings highlight the need for standards to act as a reference for differences between method technologies.
This study underscores the critical importance of selecting the appropriate particle size analysis method based on the specific data application requirements. For nicotine pouch fillers, sieving provided consistent results for dry products, laser diffraction demonstrated robustness for a wide range of particle size sample types (both dry and wet), and DIA offered valuable shape characterization when such information is of interest. However, the observed differences between methods highlight the necessity of accounting for methodological variability when comparing particle size results. Exploring complementary approaches that combine the strengths of multiple techniques may offer a more comprehensive understanding of the particle size distribution of a product.
AUTHOR INFORMATION
[1] Contributed by Author contribution
SP and FA conceived and designed the study, performed data analysis and visualization, and drafted the manuscript. AR conducted statistical analysis and prepared figures. MN, JR, TS, NS, and ND conducted all experiments and contributed to manuscript drafting and data visualization. All authors critically reviewed and approved final manuscript.
[2] Conflict of interest disclosure
SP, AR, FA, MN, JR, and NS are employed by companies that manufacture nicotine pouch products. TS is employed by a contract research organization that analyses nicotine pouch products. ND is employed by a company that provides raw materials to manufacturers of nicotine pouch products.
ACKNOWLEDGEMENTS
The authors would like to thank Karl Wagner from Altria Client Services, LLC, Johan Lindholm from Swedish Match, and Rob Stevens from R.J. Reynolds Tobacco Company for their guidance throughout this study.
ASSOCIATED CONTENT
Data availability statement
Data sets generated during the study are available from corresponding author upon request.
Supporting information
No supporting information associated with this article.