
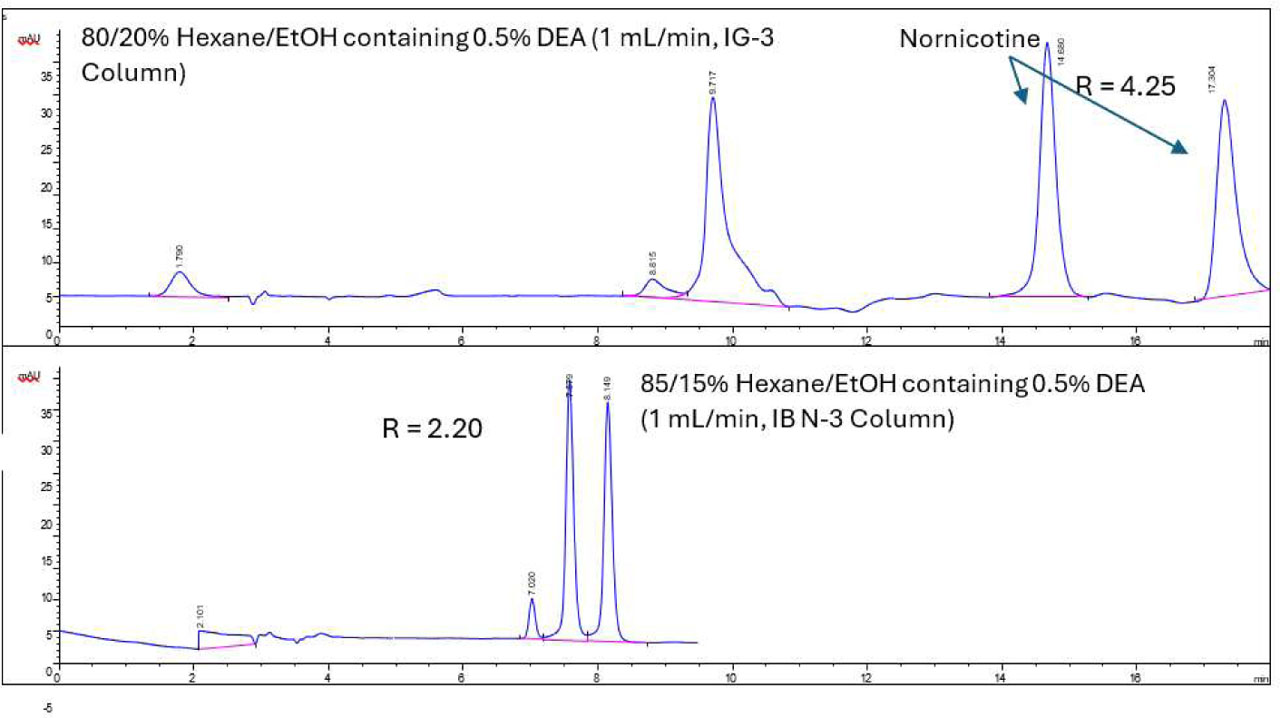
Figure 1.
Chiral HPLC/UV/VIS separation of nornicotine enantiomers using IG-3 and IB N-3 columns.
Table 1.
Variation in nornicotine enantiomers retention times (min) and resolution (R), as functions of EtOH modifier, modifier percentage, mobile phase flow rate, additive, additive structure, additive percent, and column type.
| IB N-3 column/mobile phase composition/flow rate | R | %RSD | RT*min | %RSD | RT*min | %RSD |
|---|---|---|---|---|---|---|
| 10% EtOH + 0.2% DEA, 0.8 mL/min | 2.8 | 2.8 | 14.4 | 2.4 | 13.2 | 2.4 |
| 10% EtOH + 0.5% DEA, 0.8 mL/min | 2.8 | 1.8 | 13.23 | 1.9 | 12.12 | 2.1 |
| 10% EtOH + 0.2% DEA, 1 mL/min | 2.9 | 4.6 | 13.3 | 0.6 | 12.1 | 0.6 |
| 10% EtOH + 0.5% DEA, 1 mL/min | 3 | 0.5 | 12.3 | 0.04 | 11.2 | 0.02 |
| 15% EtOH + 0.2% DEA, 0.8 mL/min | 2.3 | 1 | 10.9 | 0.8 | 10.1 | 0.9 |
| 15% EtOH + 0.5% DEA, 0.8 mL/min | 2.3 | 3.1 | 10.3 | 1.4 | 9.6 | 1.3 |
| 15% EtOH + 0.2% DEA, 1 mL/min | 2.1 | 0.9 | 8.6 | 1 | 8 | 0.9 |
| 15% EtOH + 0.5% DEA, 1 mL/min | 2.2 | 1.2 | 8.2 | 1.5 | 7.6 | 1.6 |
| IG-3 column/mobile phase composition/flow rate | R | %RSD | RT*min | %RSD | RT*min | %RSD |
|---|---|---|---|---|---|---|
| 15% EtOH + 0.2% DEA, 0.8 mL/min | 5.4 | 1.1 | 29.7 | 2.0 | 24.92 | 2.1 |
| 15% EtOH + 0.5% DEA, 0.8 mL/min | 5.1 | 5.8 | 28.6 | 0.2 | 23.96 | 0.1 |
| 15% EtOH + 0.2% DEA, 1 mL/min | 5.09 | 0.3 | 24.5 | 1.9 | 20.65 | 2.1 |
| 15% EtOH + 0.5% DEA, 1 mL/min | 4.52 | 2.9 | 22.4 | 0.3 | 18.85 | 0.2 |
| 20% EtOH + 0.2% DEA, 0.8 mL/min | 4.89 | 0.1 | 23.7 | 0.7 | 20.17 | 0.7 |
| 20% EtOH + 0.5% DEA, 0.8 mL/min | 4.6 | 0.4 | 21.74 | 0.1 | 18.44 | 0.1 |
| 20% EtOH + 0.2% DEA, 1 mL/min | 4.62 | 0.6 | 18.53 | 2.1 | 15.78 | 2.1 |
| 20% EtOH + 0.5% DEA, 1 mL/min | 4.25 | 6.9 | 17.25 | 0.3 | 14.65 | 0.3 |
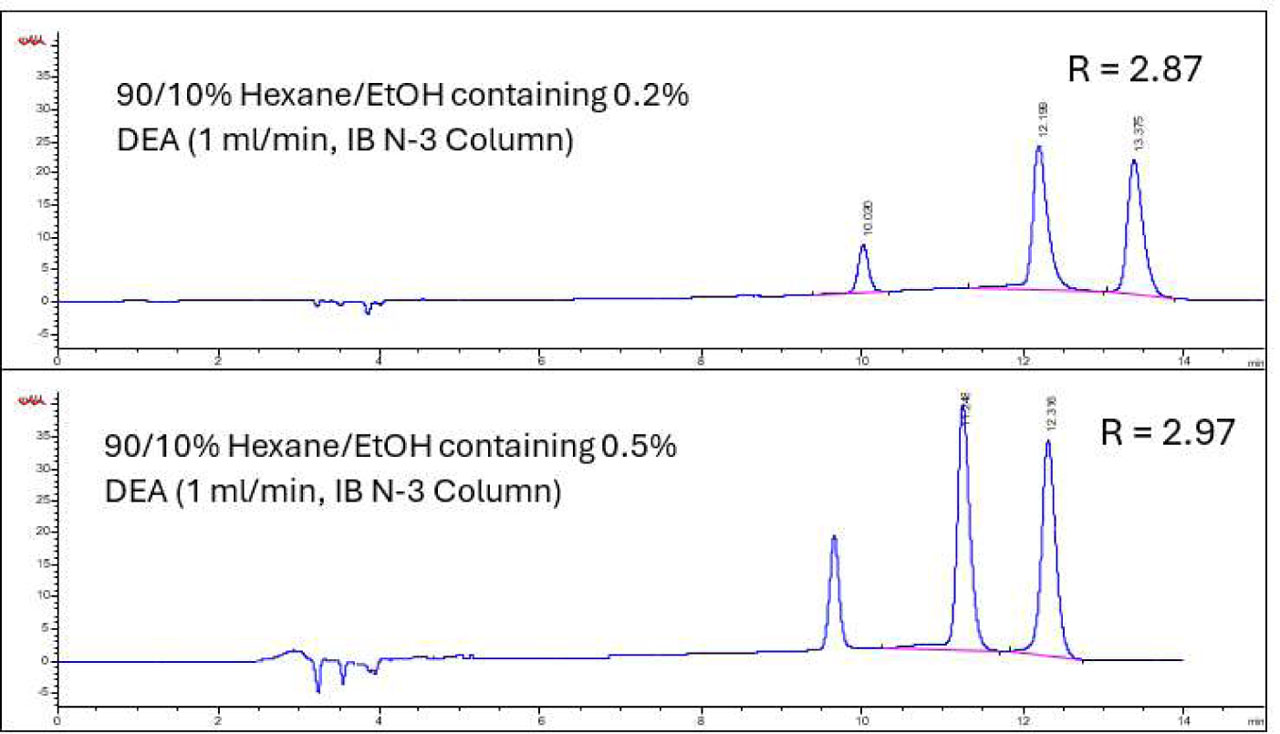
Figure 2.
Chiral HPLC/UV/VIS separation of nornicotine enantiomers as a function of changes in additive percentage using IB N-3 column.
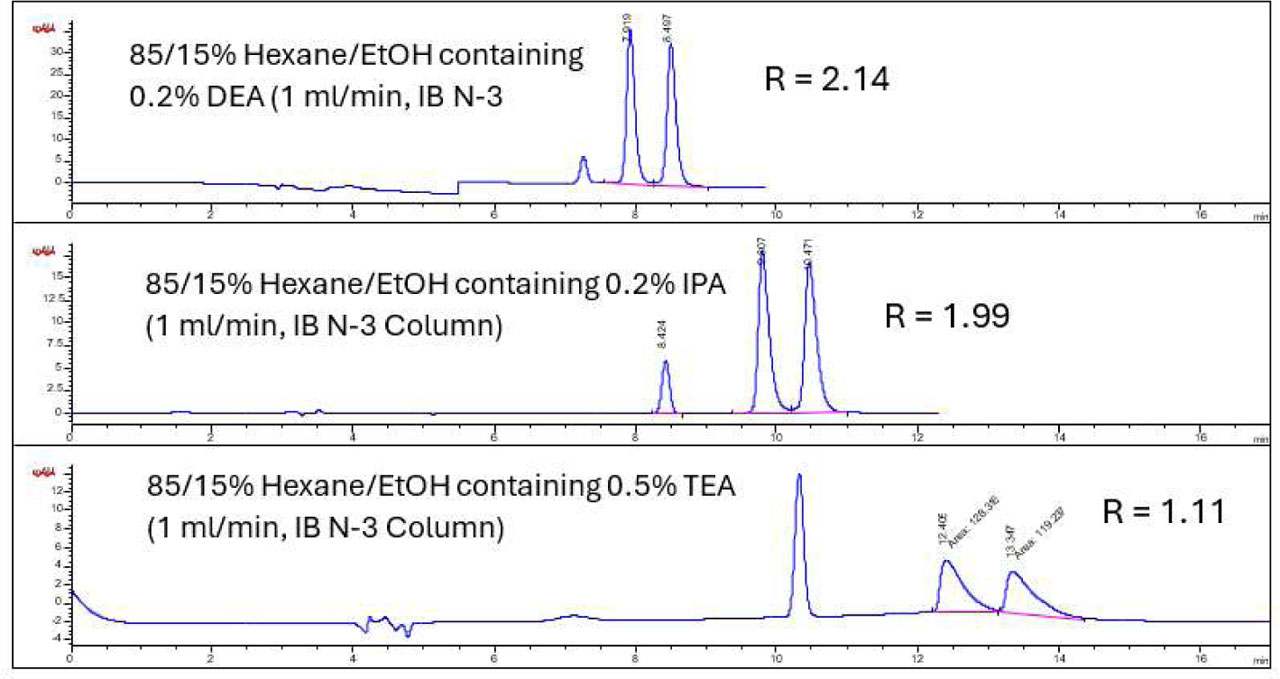
Figure 3.
Chiral HPLC/UV/VIS separation of nornicotine enantiomers using selected additives using IB N-3 column.
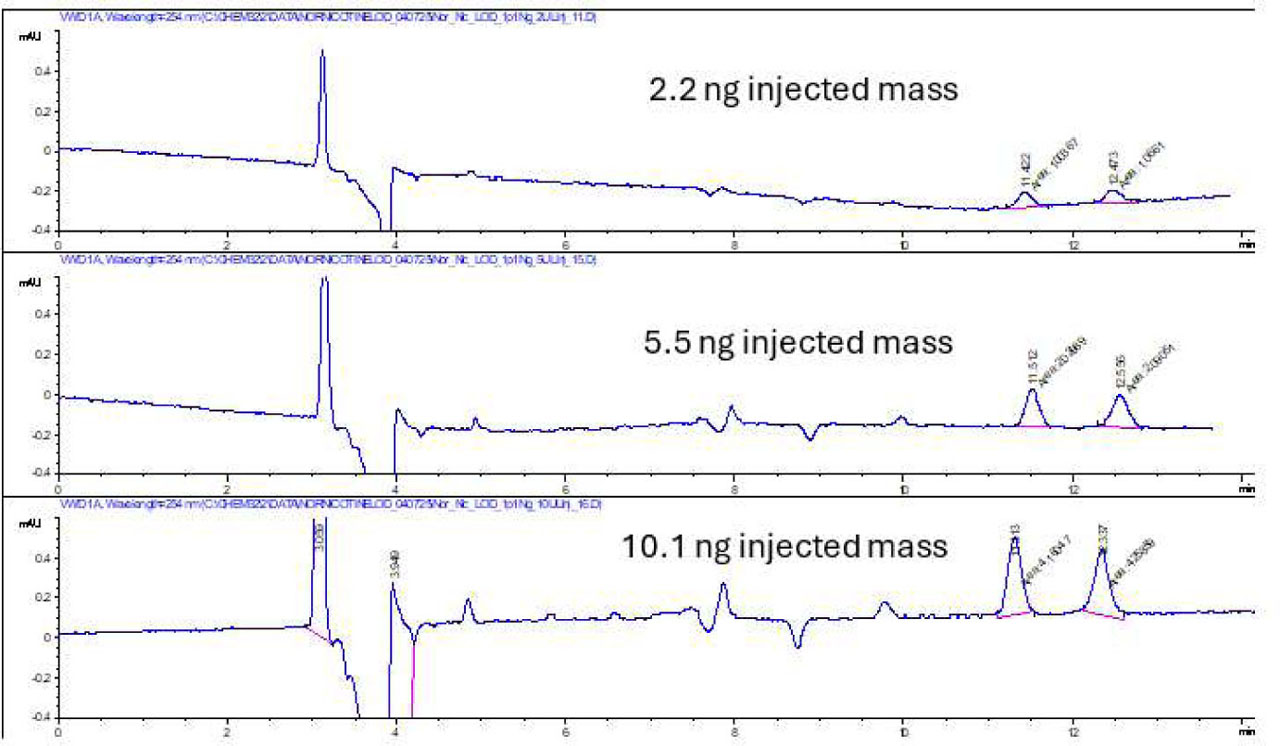
Figure 4.
Chiral HPLC/UV/VIS separation of nornicotine enantiomers at their detection limit.
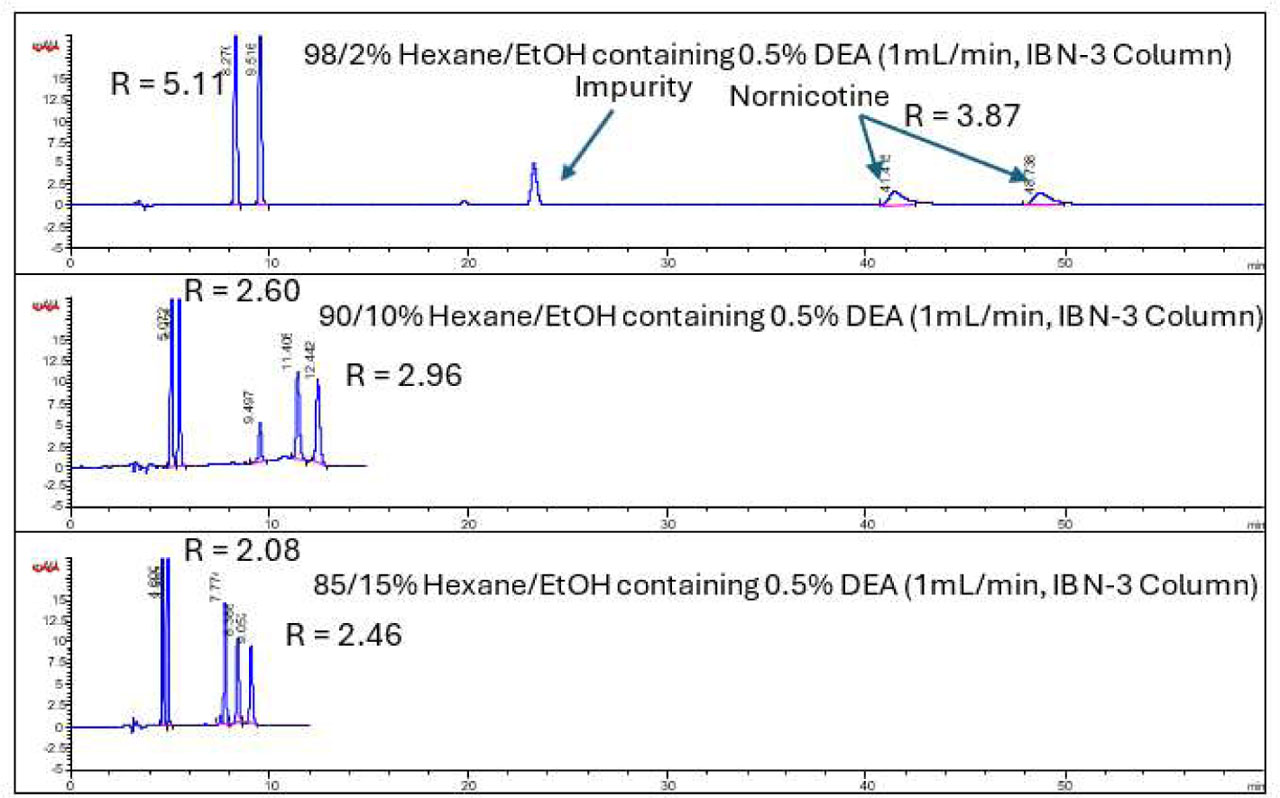
Figure 5.
Chiral HPLC/UV/VIS simultaneous separation of nornicotine and nicotine enantiomers as a function of mobile phase composition (IB N-3 column).
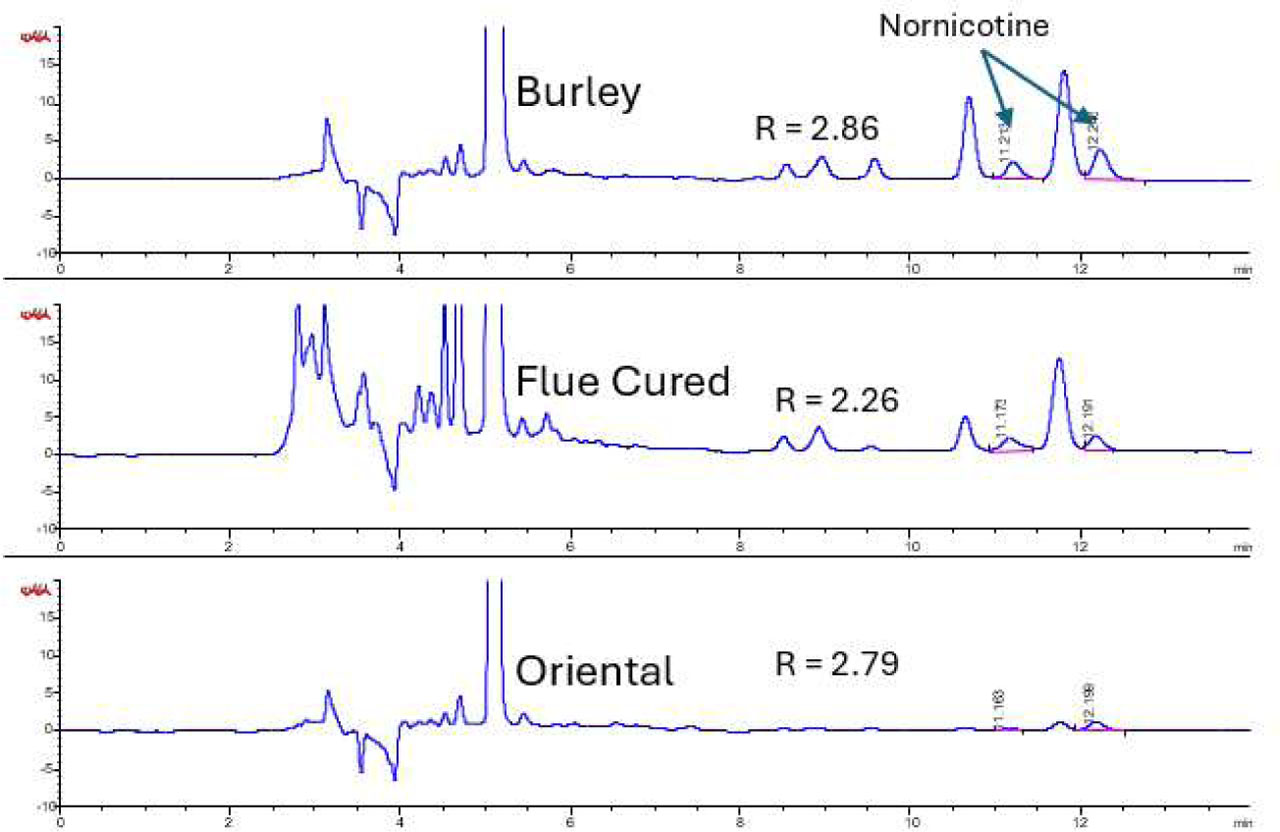
Figure 6.
Chiral HPLC/UV/VIS separation of nornicotine enantiomers extracted from flue cured, Burley and Oriental standard tobaccos and a low nicotine commercially available tobacco (90/10 Hexane/EtOH, 0.5% DEA, 1 mL/min, IB N-3 column).
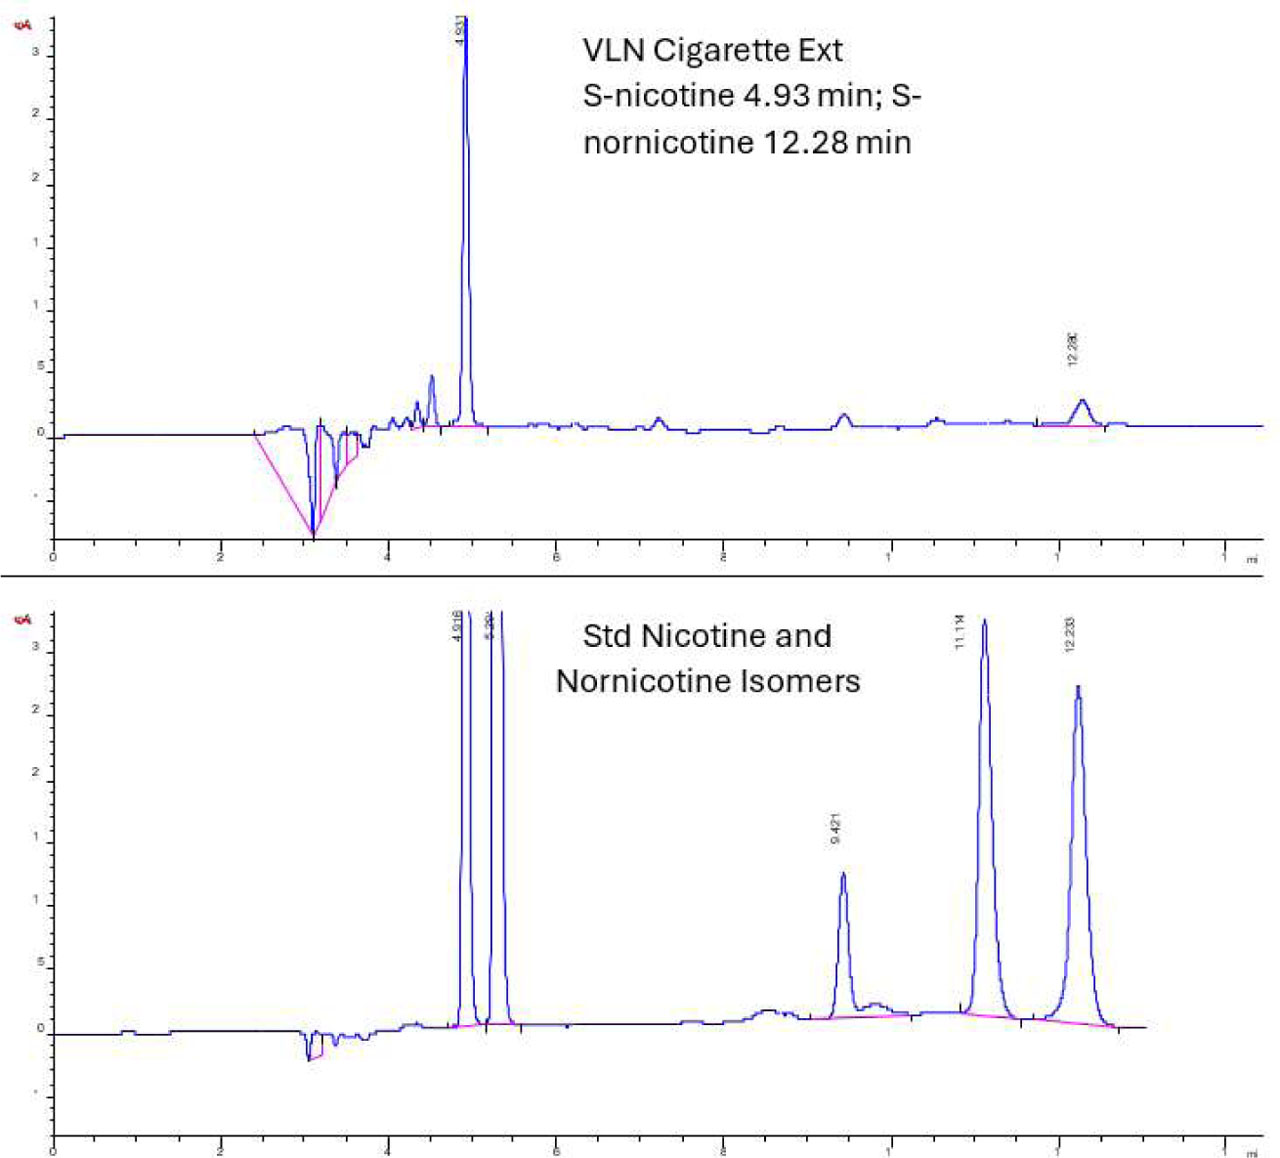
Figure 7.
Chiral HPLC/UV/VIS separation of nornicotine enantiomers extracted from commercial VLN cigarette tobacco. Conditions (90/10 Hexane/EtOH, 0.5% DEA, 1 mL/min, IB N-3 column).
Table 2.
Nornicotine enantiomer resolution values and enantiomer distributions for selected tobacco extracts. Separation conditions: 90/10% hexane/ethanol with 0.5% DEA – IB N-3 column flow 1 mL/min., ambient temp.
Table 3.
Influences on nornicotine and nicotine enantiomer retention times and resolution values (R) with systematic changes in mobile phase composition.
| Mobile phase | 85/15% Hex/EtOH with 0.5% DEA (v/v) | |
| Nicotine | Nornicotine | |
| Retention time (min) | 4.90 | 9.05 |
| Retention time (min) | 4.60 | 8.39 |
| R | 2.1 | 2.5 |
| Mobile phase | 90/10% Hex/EtOH with 0.5% DEA (v/v) | |
| Nicotine | Nornicotine | |
| Retention time (min) | 5.31 | 12.05 |
| Retention time (min) | 4.92 | 10.95 |
| R | 2.6 | 3.1 |
| Mobile phase | 98/2% Hex/EtOH with 0.5% DEA (v/v) | |
| Nicotine | Nornicotine | |
| Retention time (min) | 9.52 | 48.74 |
| Retention time (min) | 8.27 | 41.42 |
| R | 5.1 | 3.9 |