Eine gemeinsame Studie von zwölf Laboratorien wurde durchgeführt, um eine empfohlene Methode zur Bestimmung von Stickoxiden (NOx) im Hauptstrom von Zigarettenrauch auszuarbeiten. Drei Zigarettenproben mit einem Gesamtpartikelausstoß gemäß ISO 3308 von 2–17 mg/cig wurden sowohl unter nicht intensiven (ISO 3308) als auch unter intensiven (ISO 20778) Abrauchverfahren bewertet, um die Anwendbarkeit der Methode unter verschiedenen Bedingungen zu beurteilen. Der Hauptstromrauch wurde entweder durch einen Inline-Detektor geleitet oder in einem gasdichten System gesammelt, um NOx offline mittels Chemilumineszenz zu bestimmen. Die optionale Verwendung von Glasfaserfilterpads ermöglichte die gravimetrische Bestimmung der Gesamtpartikelmasse. Statistische Analysen wurden gemäß ISO 5725 durchgeführt, um die Wiederholbarkeit (r) und Reproduzierbarkeit (R) sowie diez-scores zu bestimmen. Die Reproduzierbarkeit, ausgedrückt als Prozentsatz des mittleren Ertrags über alle Produkte, Rauchgewohnheiten und Analysetypen hinweg, lag von 15,1–49,7%. Die NOx-Erträge lagen von 71–437 μg/cig und folgten den erwarteten Trends in Bezug auf den Gesamt-partikelgehalt und die Rauchintensität. Diese Ergebnisse belegen die Robustheit der vorgeschlagenen Methode und sprechen für ihre Übernahme als CORESTA Recommended Method CRM N° 104. [Contrib. Tob. Nicotine Res. 34 (2025) 222–229]
Une étude collaborative entre douze laboratoires a été menée afin d’établir une méthode recommandée pour la détermination des oxydes d’azote (NOx) dans la fumée principale des cigarettes. Trois échantillons de cigarettes, dont la teneur totale en particules selon la norme ISO 3308 variait entre 2–17 mg/cig, ont été évalués dans le cadre d’un régime de fumage non intense (ISO 3308) et intense (ISO 20778) afin d’évaluer l’applicabilité de la méthode dans diverses conditions. La fumée principale de cigarette a été soit passée à travers un détecteur en ligne, soit collectée dans un système étanche au gaz pour la détermination hors ligne des NOx par chimiluminescence. L’utilisation facultative de tampons filtrants en fibre de verre a permis la détermination gravimétrique des particules totales. Des analyses statistiques ont été effectuées conformément à la norme ISO 5725 afin de déterminer la répétabilité (r) et la reproductibilité (R), ainsi que les scores z. La reproductibilité, exprimée en pourcentage du rendement moyen pour tous les produits, tous les régimes de consommation et tous les types d’analyse, variait de 15,1–49,7%. Les rendements en NOx variaient de 71–437 μg/cig et suivaient les tendances attendues en ce qui concerne les particules totales et l’intensité de la consommation. Ces résultats démontrent la robustesse de la méthode proposée et soutiennent son adoption en tant que méthode recommandée CORESTA CRM N° 104. [Contrib. Tob. Nicotine Res. 34 (2025) 222–229]
Oxides of nitrogen (NOx), including nitric oxide (NO) and nitrogen dioxide (NO2), are classified as harmful and potentially harmful chemicals (HPHCs) in cigarette smoke and are of scientific and regulatory interest due to their roles in oxidative stress and respiratory inflammation (1–3). While NOx in tobacco product emissions has been studied at least since the 1960s and is typically measured using chemiluminescent techniques, standardized methodologies applicable to cigarette smoke remain limited (4–16). Thus, this study was undertaken to develop a CORESTA Recommended Method (CRM) with broad regional applicability, accommodating modern smoking regimes and a diversity of product designs. The method aims to establish a framework for real-time, puff-by-puff analysis, while addressing the rapid reaction and degradation of NOx in the vapor phase. To ensure robustness, conventional cigarette samples expected to produce a broad range of analyte yields were tested by twelve global laboratories under intense and non-intense regimes. A range of commercial cigarette smoking machine types and NOx analyzer models and analysis type (in-line or off-line) were employed. Data were assessed using standard statistical analyses to evaluate reliability.
The laboratories that participated in the study are listed alphabetically in Table 1. To ensure anonymity, each laboratory was assigned a unique code for data exchange and reporting. Fifteen laboratories volunteered. Two labs withdrew after code assignment but prior to reporting. One lab, lab 10, submitted two datasets: one using in-line analysis (designated as 10IL), and another using off-line analysis (designated as 10OL). Of the remaining laboratories, ten used in-line and one (Lab 9) used off-line analysis.
Participating laboratories.
| Name of participant |
|---|
| China National Tobacco Corp., Beijing Cigarette Factory Borgwaldt KC GmbH (now Körber) |
| Enthalpy Analytical |
| Japan Tobacco Inc. |
| JT International, Ökolab |
| KT&G Research Institute |
| Labstat International Inc. |
| Philip Morris International Brazil |
| Philip Morris International Indonesia |
| Philip Morris International Switzerland |
| Reemtsma Cigarettenfabriken GmbH - Imperial Brands |
| Souza Cruz SA, BAT |
Participating laboratories followed a supplied protocol that included a draft copy of the analytical method, along with instructions for sample procurement, smoking regimes, replicate requirements, and data reporting. The study samples, listed in Table 2, included Kentucky reference cigarettes KR 1R6F, and KR 2R5F and the CORESTA monitor test piece CM9 (17, 18), selected to represent a range of typical cigarette design features. These conventional factory-made samples contained Virginia or American Blend tobaccos and ISO 3308 “tar” yields ranging from approximately 1–16 mg.
Study test articles.
| Sample ID | Description | Key design description a | Approximate TPM ISO 3308 b (mg/cig, t.p.) | Approximate TPM ISO 20778 b (mg/cig, t.p.) |
|---|---|---|---|---|
| A | KR 2R5F | American Blend | 2.4 | 28 |
| B | KR 1R6F | American Blend | 10 | 39 |
| C | CM9 | Virginia Tobacco | 17 | 42 |
per manufacturing specifications or reporting
based on the average value for participant reporting, n = 55
Where PT = puffed, or expanded, tobacco; t.p. = test piece
Following the protocol, five replicates of conditioned and butt-marked cigarettes (19–21) were smoked using linear, rotary, or single-port commercial smoking machines capable of complying with requirements of ISO 3308 (22) and ISO 20778 (23) (as shown in Table 3) and adaptable for connection to a chemiluminescence analyzer (for in-line determination) or gas-collection apparatus (for off-line determination). A replicate was defined as a single measurement, not a specific number of cigarettes. The number of cigarettes smoked, 1–20 for ISO 3308 (non-intense) and 1–10 for ISO 20778 (intense), was based on internal laboratory practices and instrument limitations. Optionally, a preweighed glass-fiber filter pad was placed in-line with the smoke stream and weighed after smoking to determine total particulate matter (TPM) gravimetrically.
Smoking regimes and key parameters.
| Regime | Machine parameters | Vent blocking |
|---|---|---|
| ‘Non-Intense’ | ||
| ISO 3308 | Puff volume: 35 mL | None |
| ‘Intense’ | ||
| ISO 20778 | Puff volume: 55 mL | 100% |
A commercial chemiluminescence analyzer for the quantification of nitrogen oxides (NOx), or nitric oxide (NO) and nitrogen dioxide (NO2), was installed in accordance with the manufacturer specifications. The instrument was confirmed to be leak-free and was zero-calibrated prior to operation. At least five analyzer models were used across participating laboratories. Calibration was performed using one to six certified gas standards (ranging from 0–1500 ppm NO), with calibration curves fitted using linear regression.
Eleven laboratories used in-line analysis: nine without a gas trap, one using a flat-bottom flask, and one using round-bottomed three-neck boiling flasks. Two laboratories (Lab 9 and Lab 10OL) used off-line analysis, employing gas collection bags. For in-line determinations, readings were collected on a puff-by-puff basis and summed. For off-line determinations, total NO and NOx were measured after smoking. Clearing puffs were taken between samples to prevent carryover. Analyte concentrations (μg/cig) were calculated using the following equations:
X = Measured NO or NO2 concentration [μg/g], as applicable
V = Puff volume [mL/puff] e.g., 35 mL/puff (ISO 3308)
N = Number of puffs [puff]
P = Atmospheric pressure [kPa]
P0 = Standard atmospheric pressure 101.325 [kPa]
S = Number of smoked cigarettes [cig]
T = Temperature during smoking [K]
T0 = Temperature triple point of water 273.15 [K]
M = Molar mass of NO (30.0061 g/mol) or NO2
(46.0055 g/mol), as applicable
V0 = Molar volume of an ideal gas (22,414 mL/mol)
Because the number of cigarettes per replicate varied among laboratories, only Grubbs’ test was used to detect outliers in mean values. Outlier analysis was not performed on intralab standard deviations.
Z-scores were calculated in accordance with ISO/IEC 17043 and ISO 13528 (24, 25) and expressed in standard deviation units from the mean, to assess whether results from individual laboratories fell within range.
Overall mean, standard deviation, repeatability (r), and reproducibility (R) were calculated according to ISO 5725-2 (26). These metrics were reported for both smoking regimes and each tested product, irrespective of sample collection and analysis type or smoking machine type. The variance was weighted to account for the different number of cigarettes smoked, specifically weighted to represent 20 and 10 cigarettes for one replicate of ISO 3308 smoking and ISO 20778 smoking, respectively.
All raw data, reported method limits and uncertainty, and equipment employed are publicly available on the CORESTA website (27).
The study design supported evaluation of the method’s robustness across the linear range for analytes of interest and confirmed its effectiveness across diverse cigarette products. Test samples were selected to span a broad range in TPM and analyte yields. A non-intense (ISO 3308) and an intense (ISO 20778) smoking regime were used to assess method performance under varying conditions, including differences in smoking machine type and model, analyzer type and model, experimental apparatus, and general laboratory practices. This comprehensive assessment confirms the applicability and versatility of the method described herein.
Smoking measures, including puff count and TPM, exhibited low variability across smoking regimes and product types. Results aligned with established expectations based on product design variables and differences between smoking regimes.
The study samples (Table 2) were selected to reflect key design features, enabling expected low, moderate, and high yields of TPM and analytes – primarily influenced by physical design parameters under non-intense smoking conditions and by blend composition under intense conditions. For example, Sample A, KR 2R5F, contains 540 mg of tobacco per cigarette, a relatively high puffed tobacco (PT) content (30%), and approximately 70% filter ventilation. In contrast, Sample C, CM9, contains 980 mg of tobacco, no PT, and no filter ventilation. As anticipated, under the non-intense regime, TPM and analyte yields were inversely proportional to filter ventilation and PT content, and directly proportional to tobacco weight.
As shown in Table 3, a key differentiator between the two regimes is vent blocking. Since CM9 lacks filter ventilation, TPM and analyte yield increased only moderately – approximately a 2-fold increase – under the intense regime, due to larger and more frequent puffs. In comparison, KR 2R5F and KR 1R6F, both of which have significant ventilation, exhibited 11-fold and 4-fold increases in TPM, respectively, when vent blocking was applied. Correspondingly, KR 2R5F showed the most marked increase in NO and NOX yields, with a 5-fold difference between regimes.
Additionally, under non-intense conditions, NO and NOx yields for samples A and C were similar. However, under the intense regime, Sample A produced 2.5 times more NO and NOx than Sample C. Likewise, Sample B showed approximately 2.5 times higher NO and NOx levels than Sample C under both regimes. The relatively elevated NO and NOx yields for samples A and B compared to C, particularly in the absence of ventilation under the intense regime, are most likely due to blend differences. Sample C is 100% Virginia (flue-cured) lamina while samples A and B contain significant proportions of Burley and other tobaccos, which are known to produce higher levels of mainstream smoke NOx due to substantially higher tobacco nitrate compared to flue-cured tobaccos (28).
Consistent smoke yields across different laboratories, machine and analyzer models, and cigarette counts highlight the reliability of the study design and methodology. Analyte data were consistent across all samples and regimes, with the exception of one outlying dataset (10OL), which was excluded from final analyses.
Twelve participating laboratories provided 12–13 data sets as summarized in Table 4. Single outlier detection was performed for mean values using Grubbs’ Test. Due to variation in cigarette counts per replicate, intra-lab standard deviation outliers were not assessed. Any measure not reported (NR) was excluded from the outlier evaluation and calculations. Lab 10OL was identified as an outlier for both NO and NOx across all samples and regimes. Lab 13 had straggling NO data for the CM9 intense regime. Outliers were excluded from all statistical calculations, while stragglers were retained.
Estimated r and R Limits. Weighted to represent 20 cigarettes for non-intense smoking and 10 cigarettes for intense smoking for one replicate.
| Sample | Mean | N data sets a | r | r (%) | R | R (%) |
|---|---|---|---|---|---|---|
| NO Non-Intense (μg/cig) | ||||||
| A | 64 | 13 | 5.3 | 8.2 | 17.4 | 27.2 |
| B | 153 | 13 | 9.7 | 6.3 | 23.0 | 15.1 |
| C | 64 | 13 | 3.8 | 5.9 | 16.6 | 25.9 |
| NO Intense (μg/cig) | ||||||
| A | 323 | 13 | 28.3 | 8.8 | 66.9 | 20.7 |
| B | 369 | 13 | 26.4 | 7.1 | 80.9 | 21.9 |
| C | 131 | 12 | 9.7 | 7.4 | 65.0 | 49.7 |
| NOx Non-Intense (μg/cig) | ||||||
| A | 71 | 13 | 6.0 | 8.6 | 26.3 | 37.3 |
| B | 177 | 13 | 11.8 | 6.7 | 34.8 | 19.7 |
| C | 77 | 13 | 4.9 | 6.3 | 19.4 | 25.3 |
| NOx Intense (μg/cig) | ||||||
| A | 386 | 13 | 34.0 | 8.8 | 83.4 | 21.6 |
| B | 437 | 13 | 30.4 | 7.0 | 88.5 | 20.2 |
| C | 154 | 12 | 12.1 | 7.9 | 72.1 | 46.9 |
Where outlying data have been removed.
The z-score is used to indicate whether the laboratory results fall within the normal range of all participating laboratories. It is expected that most of the z-scores should lie within ± 2. Values of 2 ≤ |z| < 3, are considered stragglers (warning signals), while those with values of 3 ≤ |z| are considered outliers (action signals) warranting further investigation. Straggling values were included in the mean and standard deviation calculations; outliers were excluded. Z-score graphs for NO and NOx are presented in Figures 1 and 2, respectively.
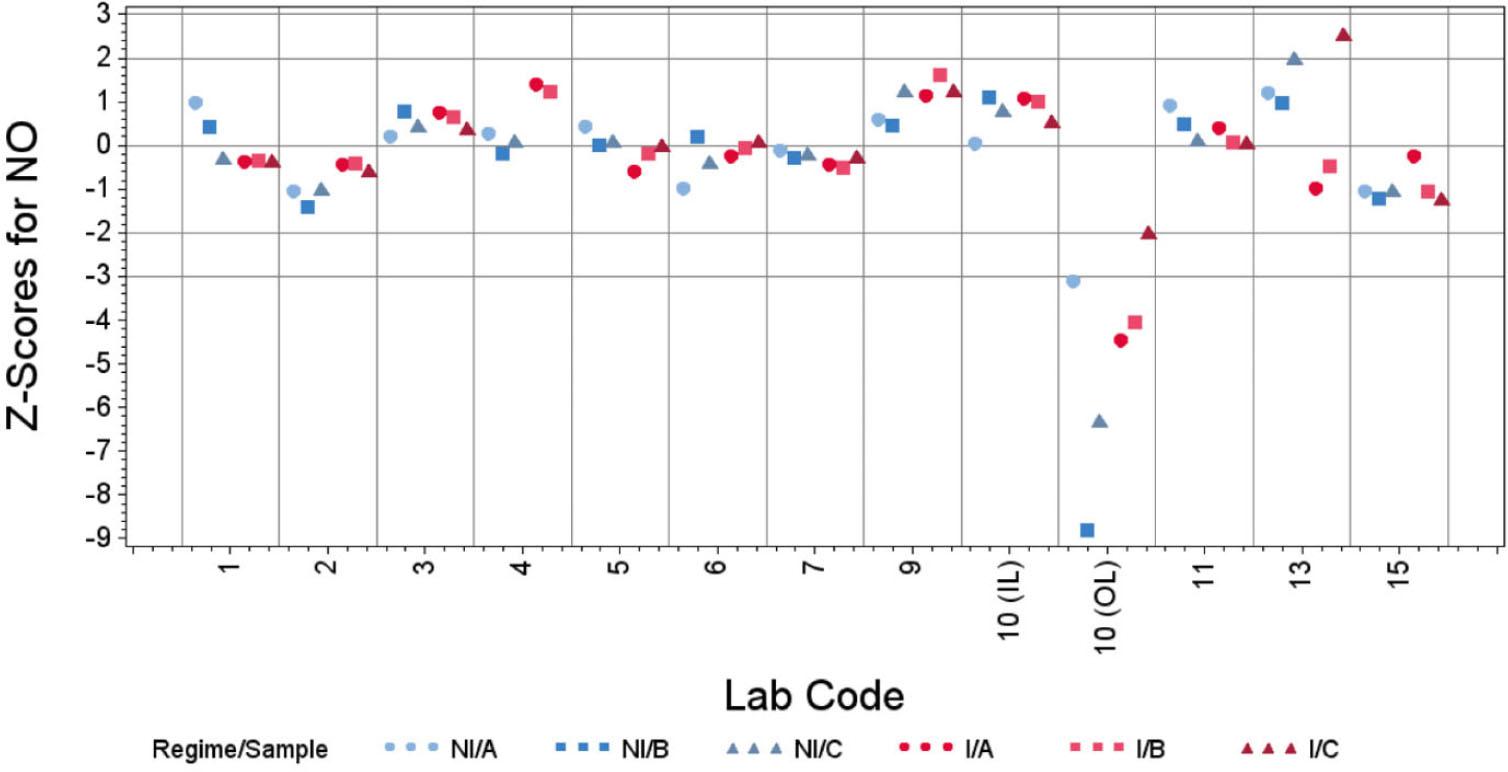
Z-Scores for NO for each lab under ISO non-intense and ISO intense smoking regimes. Where NI = non-intense regime and I = Intense regime; samples are denoted as A (KR 2R5F), B (KR 1R6F), and C (CM9). Lab code gaps reflect withdrawals following code assignment and prior to result submission.
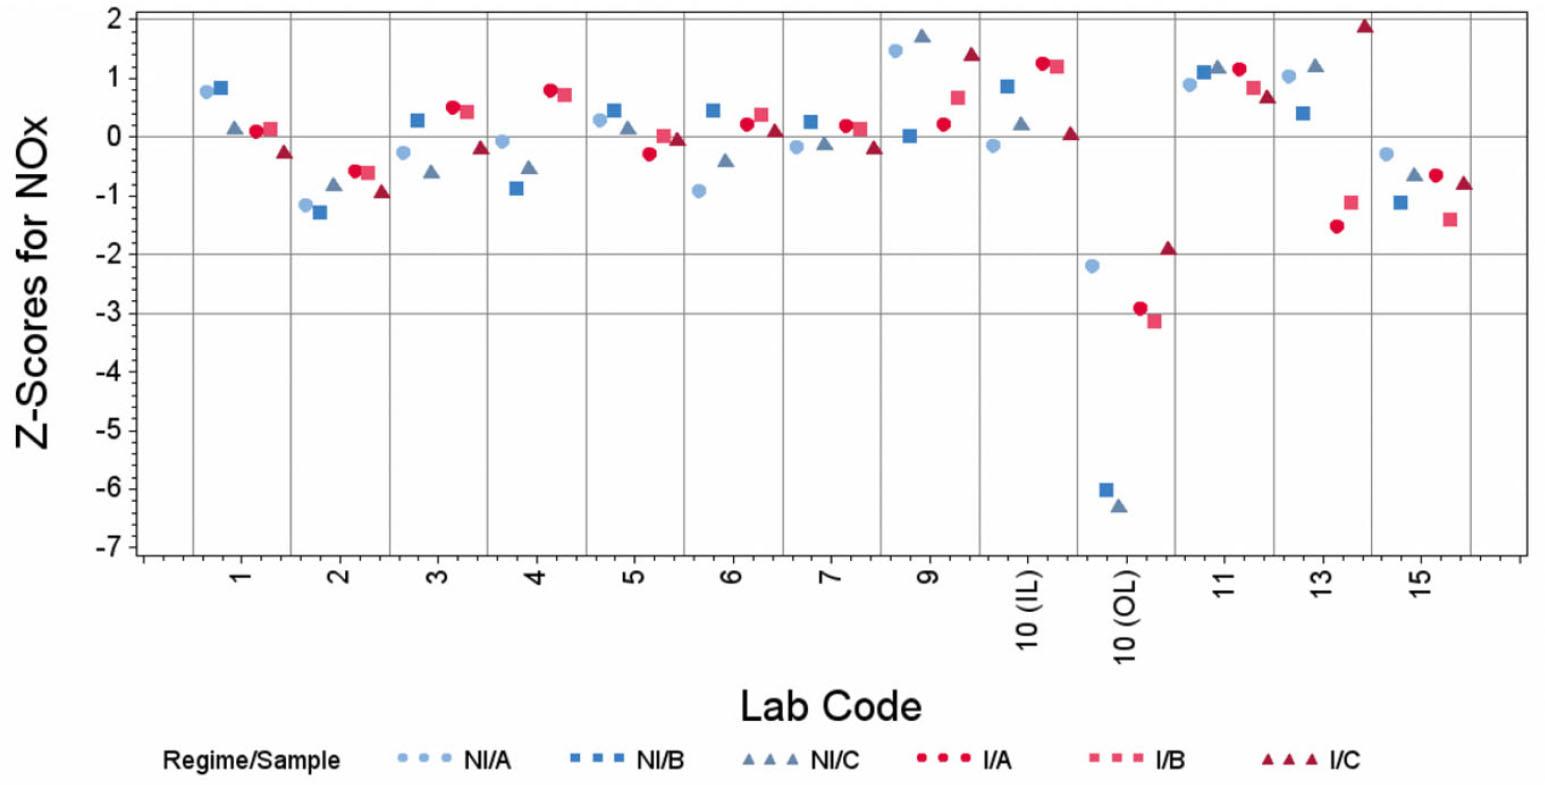
Z-Scores for NOx for each lab under ISO non-intense and ISO intense smoking regimes. Where NI = non-intense regime and I = Intense regime; samples are denoted as A (KR 2R5F), B (KR 1R6F), and C (CM9). Lab code gaps reflect withdrawals following code assignment and prior to result submission.
All laboratories’ data, except as noted, fell within the ±2 acceptability range. One straggling data point (NO - CM9 Intense) was observed for Lab 13; however, given the consistency of the laboratory’s other results, this value is likely anomalous. For Lab 10OL, two values were stragglers, and the remaining 10 results exceeded ±3. A review of Lab 10OL’s experimental conditions and raw data suggests a probable leak or analyte degradation. Equipment, calibration gases, conditioned cigarette weight, puff count, and TPM were comparable between the 10OL and 10IL datasets, while NO and NOx values for 10OL were approximately two-thirds of those reported by 10IL and other laboratories.
Mean repeatability (r) and reproducibility (R) results, with outliers removed, are displayed in Table 4. Repeatability values from the combined datasets, without regard for inline/off-line, smoking machine type, or analyzer model, ranged from 5.9–8.8%, while R values ranged from 15.1–49.7%. Higher R% values were observed for CM9 under intense conditions, potentially reflecting variation in ventilation blocking techniques. Alternatively, the shorter inter-puff interval and larger puff volume under intense regime may not allow for sufficient recovery and clearing time between puffs, depending on the equipment in use. Given the variation in cigarette counts per replicate across labs, variability of r and R was expected and was accounted for through weighted analysis.
This collaborative study established CORESTA Recommended Method (CRM) N° 104 (29) as a robust procedure for the determination of oxides of nitrogen (NOx) in mainstream cigarette smoke.
Twelve laboratories participated, employing three smoking machine types and in-line and off-line analysis techniques, providing a comprehensive evaluation of the method’s robustness. The three cigarette samples tested, representing typical tobacco blends, yielded TPM values of approximately 2–50 mg per cigarette across an intense (ISO 20778) and non-intense (ISO 3308) regime.
The method reported herein was evaluated across approximately a 6-fold range in the analytes of interest. Repeatability (r) values were consistently below 10% and reproducibility (R) values ranged from 15–50%, depending on product and regime. These results demonstrate that the method is sufficiently robust to accommodate varying “tar” levels, collection techniques, and analytical instrumentation across laboratories.