Figure 1.
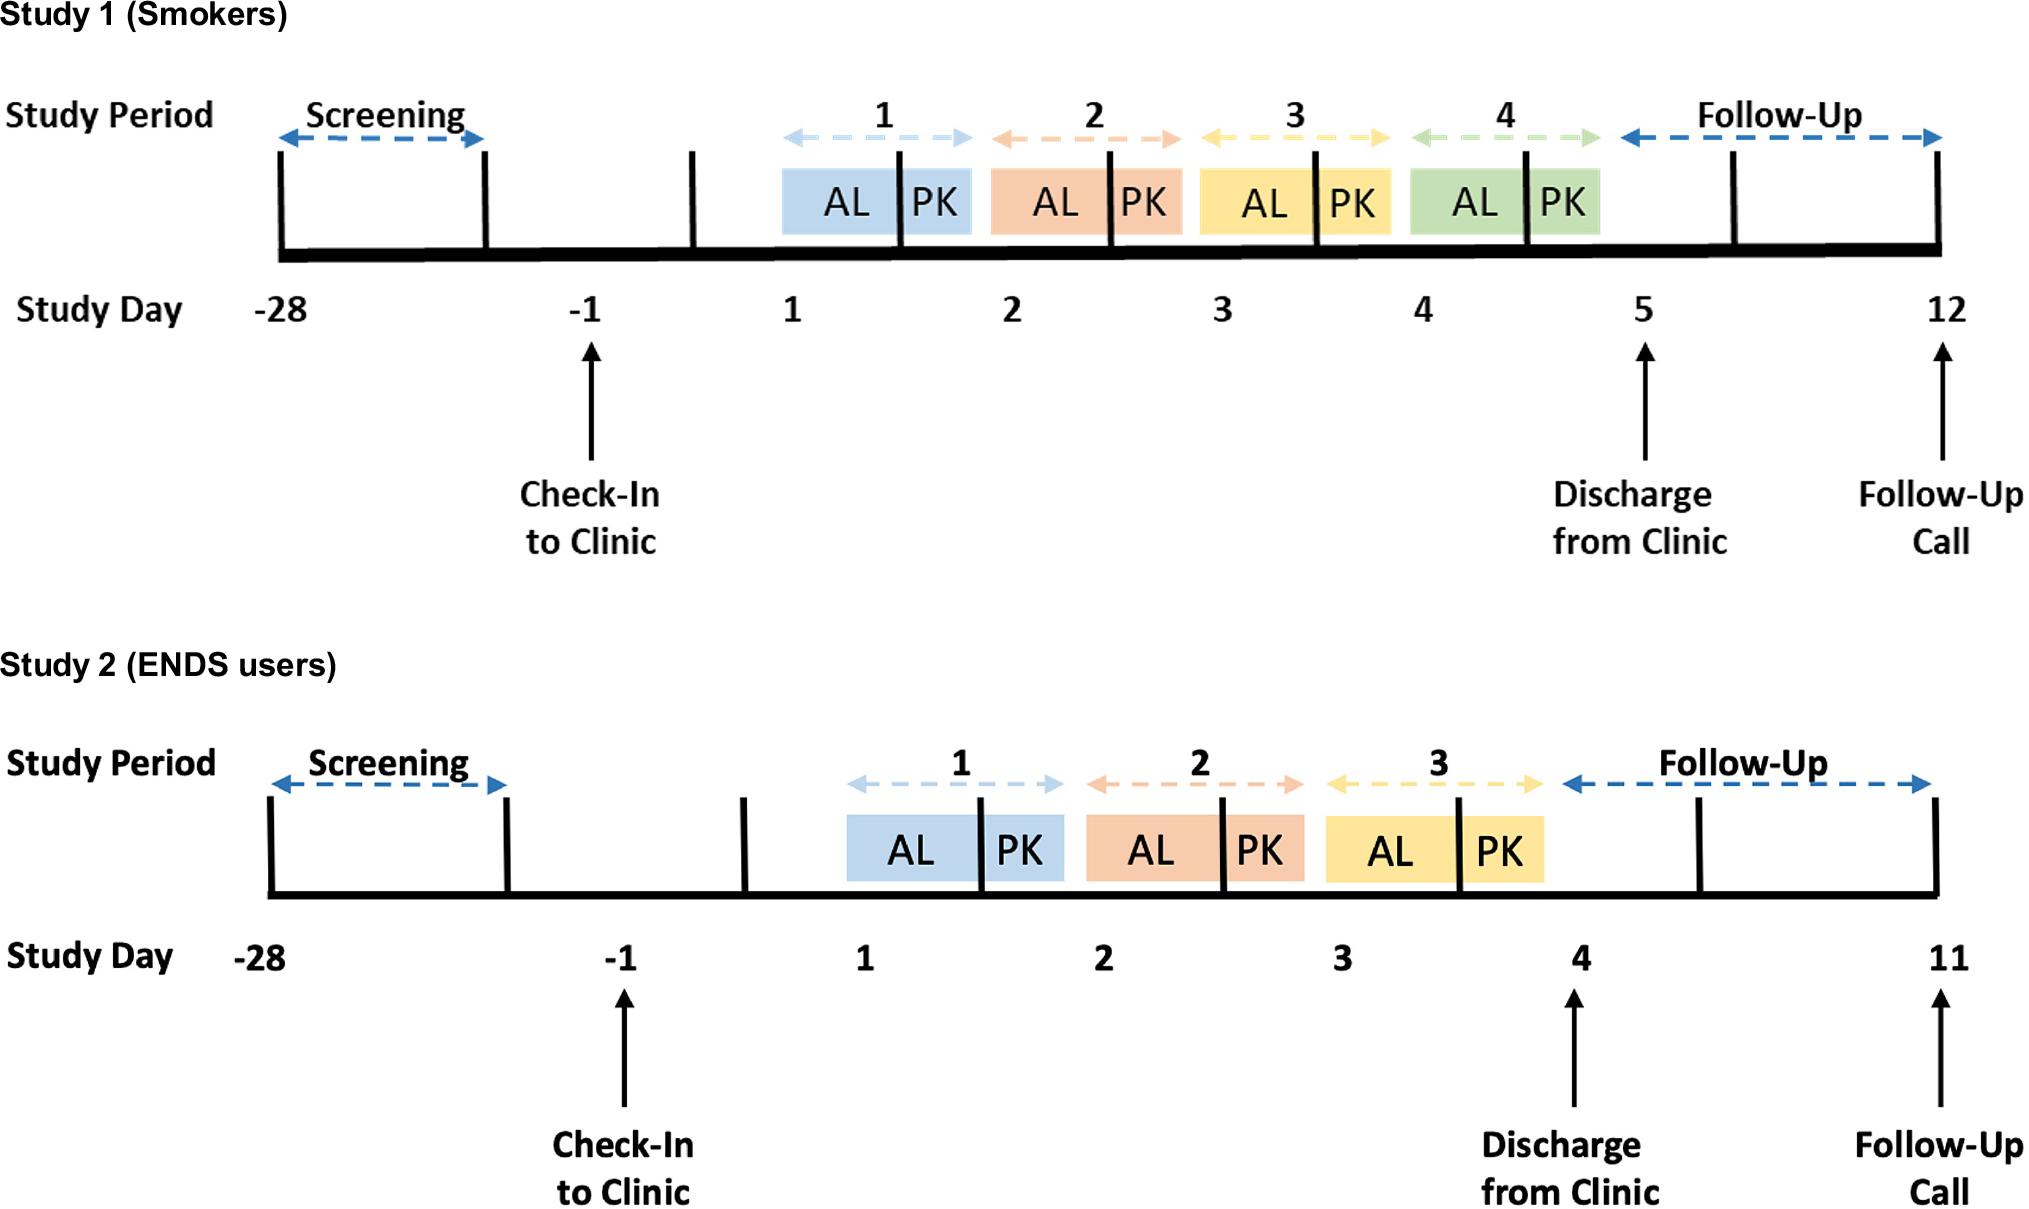
Figure 2.
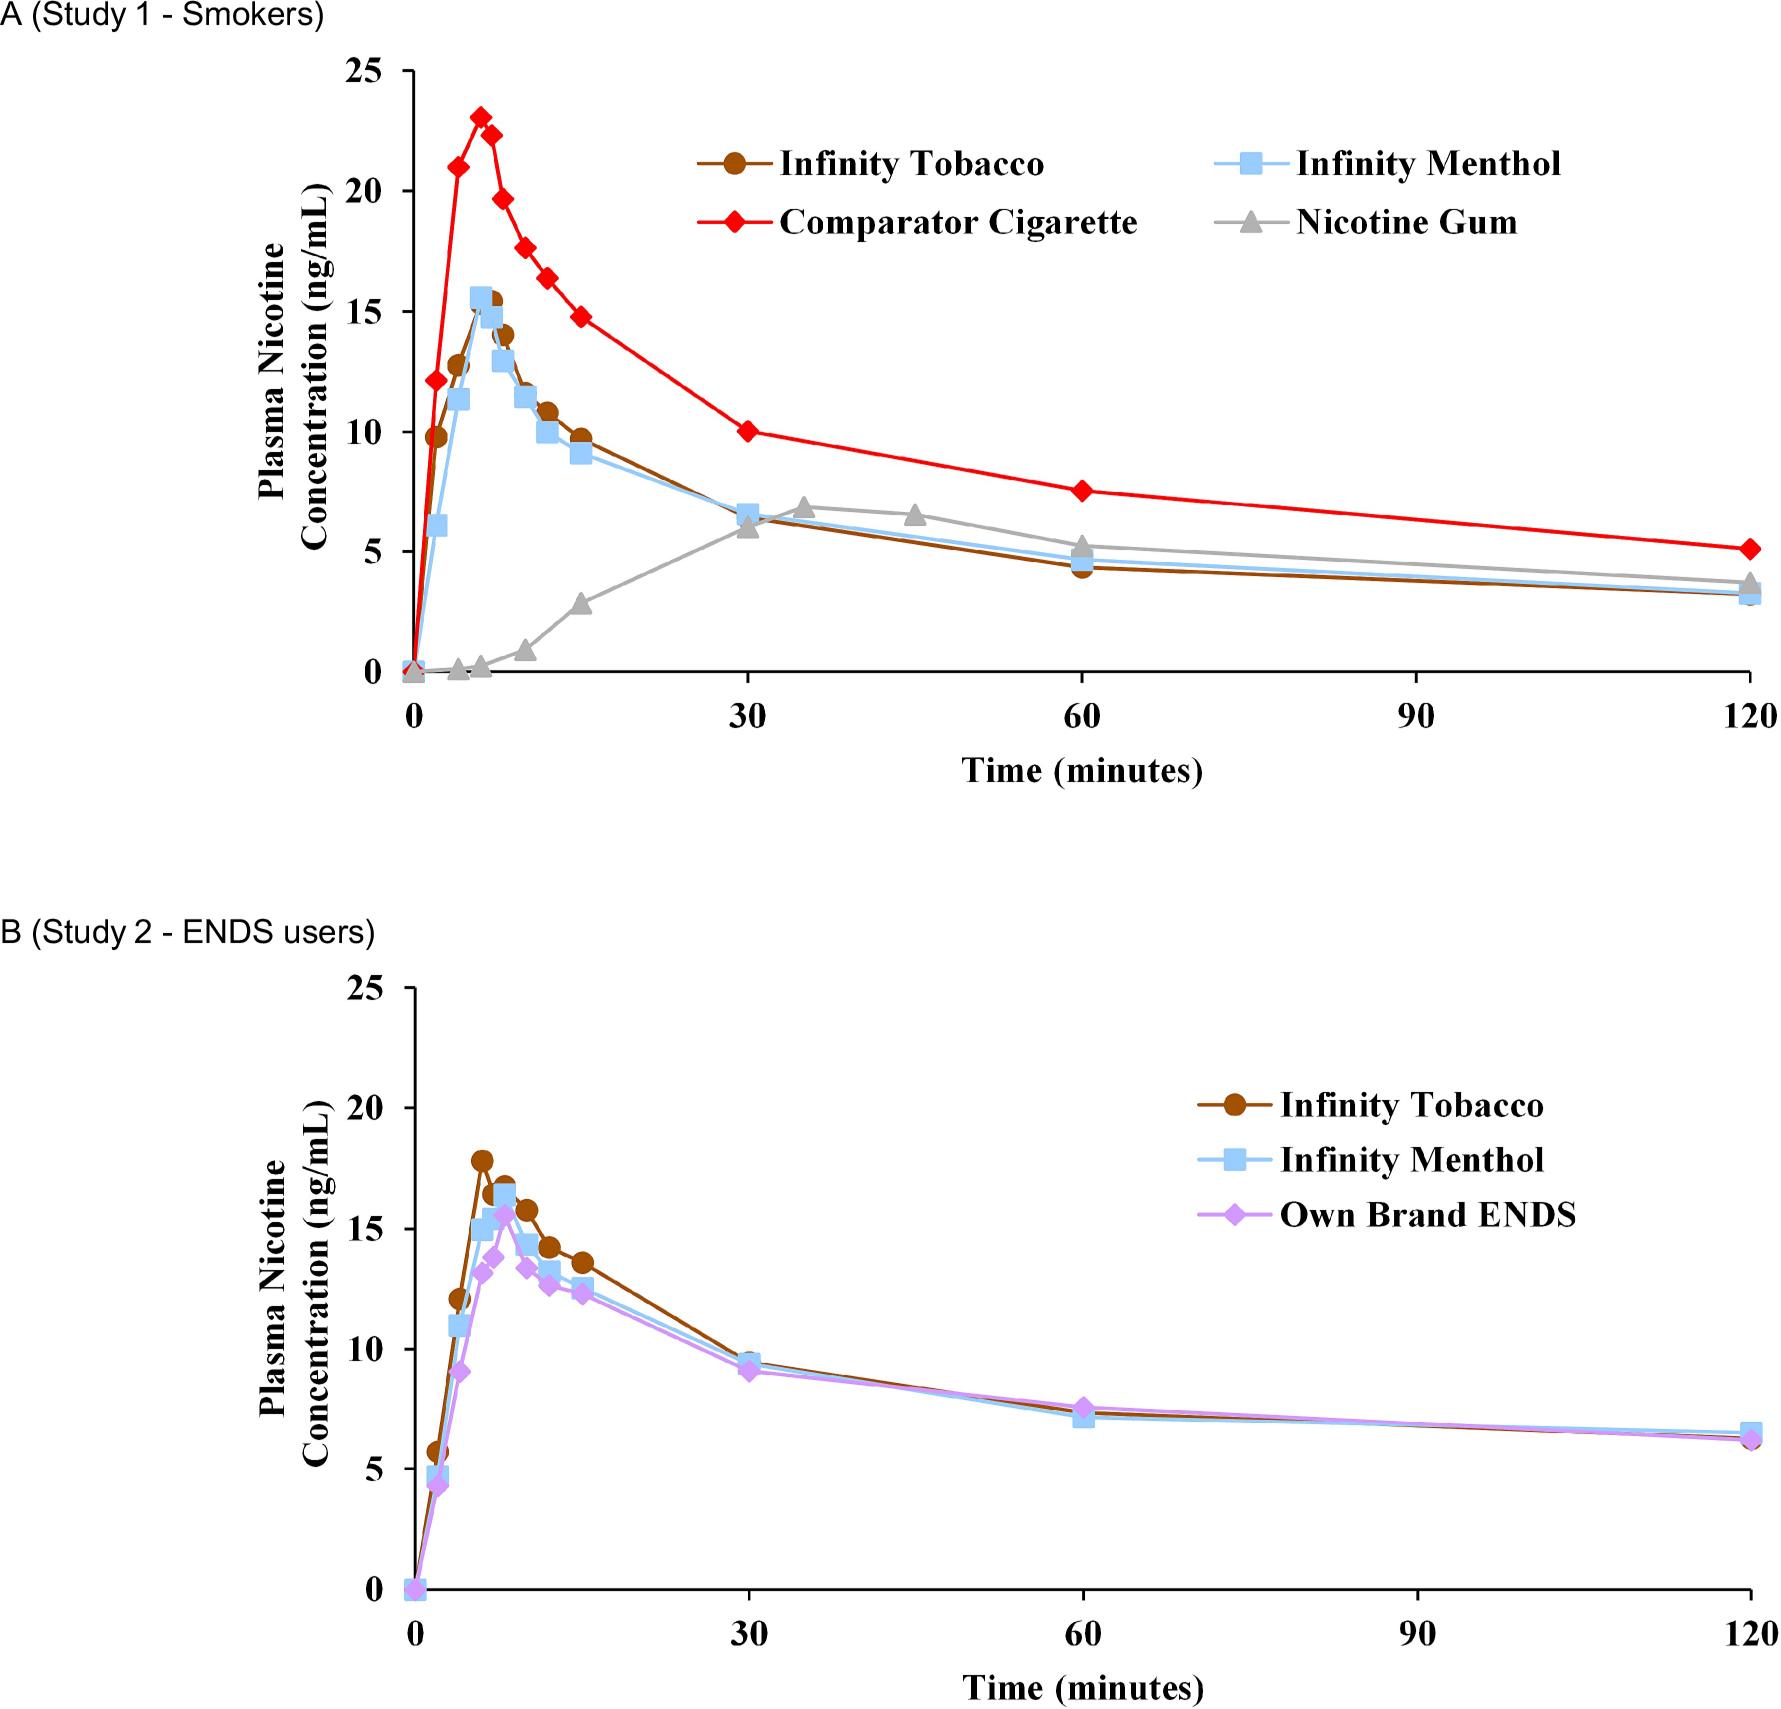
Figure 3.
Statistical comparisons of subjective effects measures between Infinity Tobacco and Infinity Menthol and comparator products_ Statistically significant p values are shown in bold text_
| Infinity Tobacco vs comparator | Infinity Menthol vs comparator | |||||
|---|---|---|---|---|---|---|
| Difference | 95% CI (%) | p value | Difference | 95% CI (%) | p value | |
| Usual brand cigarette (Study 1) | ||||||
| Urge to smoke Emax_R | 13.4 (5.35) a | 2.7–24.0 | 0.0142 | 11.8 (5.34) a | 1.2–22.3 | 0.0300 |
| Urge to smoke TEmax_R | 0.0 (−6.5–5.0) b | −4.00–4.00 | 1.0000 | 0.0 (−8.0–12.5) b | −6.00–5.00 | 0.9920 |
| mPES Satisfaction | −1.6 (0.29) a | −2.2–−1.1 | <0.0001 | −1.4 (0.29) a | −1.9–−0.8 | <0.0001 |
| mPES Psychological reward | −0.9 (0.22) a | −1.4–−0.5 | <0.0001 | −0.7 (0.22) a | −1.2–−0.3 | 0.0018 |
| mPES Relief | −1.4 (0.26) a | −1.9–−0.9 | <0.0001 | −1.3 (0.26) a | −1.9–−0.8 | <0.0001 |
| mPES Aversion | 0.3 (−0.50–0.63) c | −0.25 – 0.50 | 0.3075 | 0.2 (0.119) d | −0.04 – 0.44 | 0.1045 |
| mPES Concern for dependence | −1.6 (0.30) d | −2.25–−1.02 | <0.0001 | −1.7 (0.30) d | −2.26–−1.06 | <0.0001 |
| Product liking | −23.00 (−58.00–−12.00) c | −49.00–−15.00 | <0.0001 | −22.00(−61.00–−5.00) c | −33.00–−8.00 | <0.0001 |
| Future intent to use | −27.6 (6.66) d | −41.12–−14.15 | 0.0002 | −23.0 (−49.00–−1.00) c | −34.00–−4.00 | 0.0012 |
| Nicotine gum (Study 1) | ||||||
| Urge to smoke Emax_R | −6.0 (5.39) a | −16.6–4.7 | 0.2725 | −7.6 (5.36) a | −18.2–3.1 | 0.1611 |
| Urge to smoke TEmax_R | −22.5 (−39.0–−10.0)b | −32.50–−14.00 | <0.0001 | −17.5 (−34.0–−4.0) b | −28.00–−7.50 | 0.0006 |
| mPES Satisfaction | 0.6 (0.29) a | 0.1–1.2 | 0.0336 | 0.9 (0.29) a | 0.3–1.5 | 0.0026 |
| mPES Psychological reward | 0.6 (0.23) a | 0.1–1.0 | 0.0169 | 0.8 (0.23) a | 0.3–1.2 | 0.0009 |
| mPES Relief | 0.7 (0.27) a | 0.2–1.3 | 0.0070 | 0.8 (0.27) a | 0.3–1.3 | 0.0040 |
| mPES Aversion | −0.3 (−1.13–0.25) c | −0.75–0.25 | 0.1516 | −0.2 (0.180) d | −0.56–0.17 | 0.2912 |
| mPES Concern for dependence | 1.0 (1.00–3.00) c | −1.00–4.00 | 0.0923 | 1.0 (0.00 – 2.00) c | 1.00–2.00 | 0.0768 |
| Product liking | 9.08 (5.875) d | −2.843–21.010 | 0.1311 | 11.81 (6.603) d | −1.580–25.202 | 0.0821 |
| Future intent to use | 16.9 (8.42) d | −0.17–34.05 | 0.0522 | 15.1 (8.86) d | −2.90–33.12 | 0.0972 |
| Usual brand ENDS (Study 2) | ||||||
| Urge to vape Emax_R | −0.8 (4.22) a | −9.3–7.7 | 0.8451 | 2.6 (4.24) a | −5.9–11.1 | 0.5427 |
| Urge to vape TEmax_R | 0.0 (−5.0–15.0) b | −4.00–14.00 | 0.8434 | 4.0 (−1.5–13.0) b | −1.50–12.50 | 0.1706 |
| mPES Satisfaction | −0.8 (0.33) a | −1.4–−0.1 | 0.0238 | 0.0 (0.34) a | −0.6–0.7 | 0.9421 |
| mPES Psychological reward | −0.40 (−1.20–0.40) c | −1.200–0.400 | 0.3833 | 0.20 (−0.60–0.80) c | −0.600–0.800 | 0.8145 |
| mPES Relief | 0.01 (0.313) d | −0.636–0.652 | 0.9806 | 0.20 (−0.80–1.00) c | −0.400–0.800 | 0.6776 |
| mPES Aversion | 0.05 (0.272) d | −0.512–0.608 | 0.8610 | −0.25 (−0.75–0.63) c | −0.750–0.500 | 0.8238 |
| mPES Concern for dependence | −0.15 (0.336) d | −0.846–0.538 | 0.6510 | −1.00 (−2.50–2.00) c | −3.000–3.000 | 0.3877 |
| Product liking Emax | −11.9 (6.85) a | −25.6–1.9 | 0.0885 | 1.8 (6.89) a | −12.0–15.6 | 0.7946 |
| Future intent to use | −13.5 (6.82) d | −27.58–0.50 | 0.0581 | 3.0 (−3.00–11.00) c | −3.00–11.00 | 0.8318 |
Subject demographics by study_
| Summary statistics / characteristics | Study 1 - Smokers | Study 2 - ENDS Users | |
|---|---|---|---|
| N | Number | 41 | 29 |
| Age, years a | Mean (SD) | 39.9 (9.51) | 39.8 (11.09) |
| Sex, n (%) | Male | 24 (58.5) | 17 (58.6) |
| Female | 17 (41.5) | 12 (41.4) | |
| Race, n (%) | White | 27 (65.9) | 13 (44.8) |
| Black or African | 13 (31.7) | 14 (48.3) | |
| American | |||
| American Indian or Alaska Native | 0 (0) | 1 (3.4) | |
| Other | 1 (2.4) | 1 (3.4) | |
| Ethnicity, n (%) | Not Hispanic or | 39 (95.1) | 24 (82.8) |
| Latino | |||
| Hispanic or Latino | 2 (4.9) | 5 (17.2) | |
| Body mass index (kg/m2) | Mean (SD) | 29.1 (4.86) | 26.6 (4.84) |
| PS[E]CDI total score b | Mean (SD) | 12.1 (2.8) | 11.4 (3.6) |
Statistical comparison of baseline-adjusted plasma nicotine pharmacokinetic parameters between Infinity Tobacco and Infinity Menthol and comparator products_ Statistically significant p values are shown in bold text_
| Infinity Tobacco vs comparator | Infinity Menthol vs comparator | |||||
|---|---|---|---|---|---|---|
| Geometric LSmeans Ratio (%) | 90% CI (%) | p value | Geometric LSmeans Ratio (%) | 90% CI (%) | p value | |
| Usual brand cigarette (Study 1) | ||||||
| Cmax (ng/mL) | 48.3 | 35.74–65.19 | 0.0001 | 45.2 | 33.36–61.28 | < 0.0001 |
| AUC(0–15) (ng×min/mL) | 47.4 | 34.13–65.92 | 0.0003 | 44.5 | 31.99–61.86 | < 0.0001 |
| AUC(0–120) (ng×min/mL) | 45.5 | 34.95–59.20 | < 0.0001 | 43.0 | 33.02–56.03 | < 0.0001 |
| Tmax (min) | 0.8 (−0.5–2.5) | 0.00–1.50 | 0.0833 | 0.0 (−1.5–1.0) | −1.00–1.00 | 0.8504 |
| Nicotine gum (Study 1) | ||||||
| Cmax (ng/mL) | 185.6 | 137.31–250.99 | 0.0010 | 173.9 | 128.31–235.66 | 0.0032 |
| AUC(0–15) (ng×min/mL) | 1426.1 | 1027.58–1979.30 | < 0.0001 | 1337.5 | 964.61–1854.61 | < 0.0001 |
| AUC(0–120) (ng×min/mL) | 107.1 | 82.05–139.68 | 0.6715 | 101.2 | 77.55–132.16 | 0.9393 |
| Tmax (min) | −30.0 (−34.0–−26.0) | −33.00–−27.00 | < 0.0001 | −32.5 (−36.0–−27.0) | −34.00–−28.50 | < 0.0001 |
| Usual brand ENDS (Study 2) | ||||||
| Cmax (ng/mL) | 109.3 | 88.71–134.65 | 0.4784 | 109.4 | 88.45–135.20 | 0.4829 |
| AUC(0–15) (ng×min/mL) | 104.7 | 83.93–130.55 | 0.7295 | 107.5 | 86.08–134.23 | 0.5874 |
| AUC(0–120) (ng×min/mL) | 98.2 | 83.79–115.05 | 0.8466 | 103.2 | 87.98–121.08 | 0.7405 |
| Tmax (min) | 0.0 (−2.5–3.0) | −2.00–2.50 | 0.9053 | −0.5 (−3.0–5.5) | −2.50–3.00 | 0.7752 |
Baseline-adjusted plasma nicotine pharmacokinetic parameters by study and product_
| Parameter (units) | Study 1 - Smokers | Study 2 - ENDS Users | |||||
|---|---|---|---|---|---|---|---|
| Infinity Tobacco | Infinity Menthol | Usual brand cigarette | Nicotine gum | Infinity Tobacco | Infinity Menthol | Usual brand ENDS | |
| N | 35 a | 34 | 37 b | 37 c | 27 d | 25 e | 25 f |
| Cmax(ng/mL) | 18.5 (100.2%) | 16.6 (84.9%) | 27.0 (60.5%) | 7.5 (56.2%) | 21.2 (72.5%) | 18.2 (51.4%) | 16.8 (79.7%) |
| Tmax(min) | 6.0 (2.0, 15.0) | 6.0 (2.0, 120.0) | 7.0 (2.0, 12.0) | 35.0 (15.0,122.0) | 8.0 (4.0, 123.0) | 8.0 (4.0, 123.0) | 8.0 (4.0, 28.0) |
| AUC(0–15)(ng×min/mL) | 171.6 (88.3%) | 153.5 (80.2%) | 246.00 (50.6%) | 12.1 (102.3%) | 190.2 (64.4%) | 173.5 (51.5%) | 160.4 (66.2%) |
| AUC(0–120)(ng×min/mL) | 676.5 (76.2%) | 634.1 (76.8%) | 1074.8 (31.9%) | 530.7 (59.7%) | 1046.2 (54.5%) | 990.9 (52.0%) | 1008.1 (57.2%) |
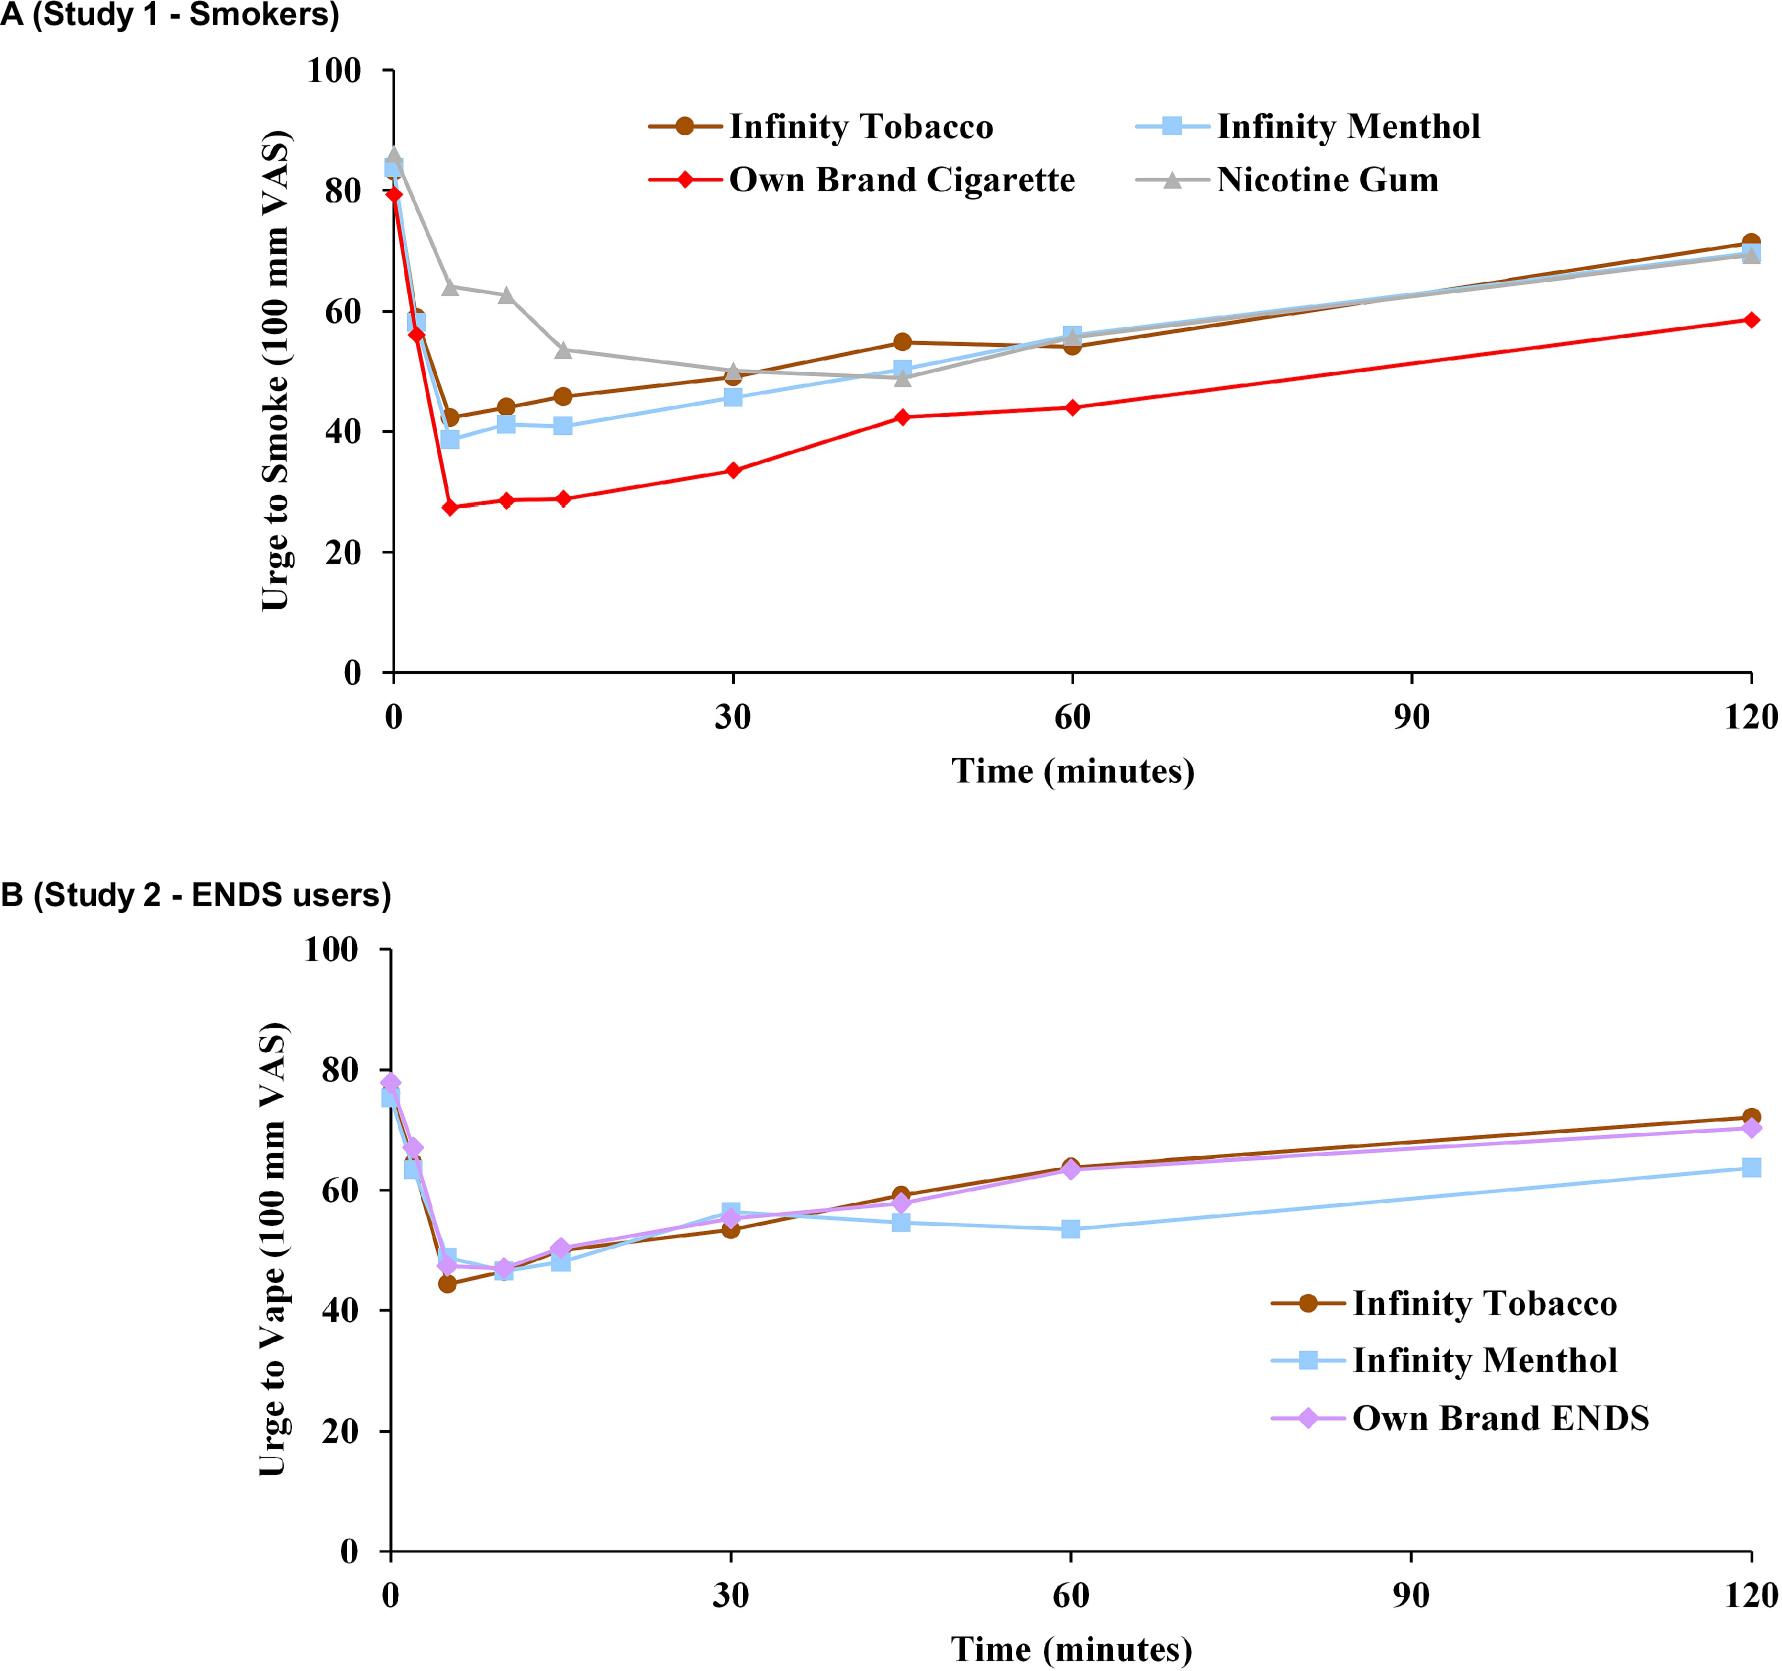
Subjective effects questionnaires by study and product_
| Study 1 - Smokers | Study 2 - ENDS Users | ||||||
|---|---|---|---|---|---|---|---|
| Infinity Tobacco | Infinity Menthol | Usual brand cigarette | Nicotine gum | Infinity Tobacco | Infinity Menthol | Usual brand ENDS | |
| Urge to smoke/vape [mean (SD)] a | |||||||
| N | 38 | 38 b | 38 | 37 | 29 c | 28 d | 25 |
| Emax_R | −49.2 (37.57) | −53.0 (32.29) | −60.5 (31.41) | −48.2 (33.83) | −41.9 (28.32) | −36.8 (29.20) | −43.2 (29.52) |
| TEmax_R | 10.0 (2, 60) | 5.0 (2, 120) | 10.0 (2, 120) | 30.0 (5, 120) | 5.0 (2, 60) | 10.0 (2, 120) | 5.0 (2, 120) |
| AOE(0–15) | −8.3 (8.57) | −9.3 (6.84) | −10.4 (7.22) | −4.8 (5.58) | −6.1 (5.98) | −5.6 (6.61) | −5.8 (5.76) d |
| AOE(0–120) | −52.2 (72.28) | −56.5 (49.92) | −69.1 (65.39) | −54.0 (48.46) | −28.1 (49.20) | −38.4 (54.30) | −32.8 (39.34) |
| Modified product evaluation scale [mean (SD)] | |||||||
| N | 39 | 39 | 38 | 36 | 29 | 28 | 26 |
| Satisfaction | 3.5 (1.43) | 3.8 (1.62) | 5.2 (1.63) | 2.9 (1.19) | 3.8 (1.78) | 4.6 (1.58) | 4.5 (1.86) |
| Psychological reward | 3.1 (1.38) | 3.3 (1.26) | 4.1 (1.46) | 2.5 (1.10) | 3.2 (1.54) | 3.7 (1.68) | 3.6 (1.76) |
| Aversion | 1.4 (0.46) | 1.6 (0.63) | 1.4 (0.67) | 1.8 (0.96) | 1.7 (1.00) | 1.7 (1.35) | 1.7 (0.85) |
| Relief | 4.2 (1.44) | 4.3 (1.45) | 5.6 (1.20) | 3.5 (1.49) | 4.2 (1.48) | 4.8 (1.35) | 4.2 (1.64) |
| Concerned for dependence | 1.9 (1.48) | 1.9 (1.34) | 3.6 (2.25) | 1.5 (0.81) | 2.4 (1.70) | 2.3 (2.09) | 2.2 (1.58) |
| Product liking [mean (SD)] | |||||||
| N | 38 | 38 | 38 | 37 | 29 | 28 | 25 |
| Emax | 56.2 (32.40) | 59.6 (35.59) | 89.2 (17.15) | 47.3 (29.64) | 63.8 (32.91) | 77.5 (23.95) | 74.4 (25.49) |
| Future intent to use | |||||||
| N | 39 | 39 | 38 | 36 | 29 | 28 | 26 |
| Mean (SD) | 53.2 (33.26) | 51.8 (37.32) | 81.7 (24.69) | 37.6 (34.15) | 55.6 (36.27) | 76.5 (28.19) | 68.8 (32.99) |
| Frequency Counts | |||||||
| 0–49, n (%) | 13 (33.3) | 14 (35.9) | 4 (10.5) | 17 (43.6) | 11 (37.9) | 5 (17.2) | 7 (26.9) |
| 50, n (%) | 5 (12.8) | 3 (7.7) | 0 (0) | 2 (5.1) | 2 (6.9) | 2 (6.9) | 1 (3.8) |
| 51–100, n (%) | 21 (53.8) | 22 (56.4) | 34 (89.5) | 17 (43.6) | 16 (55.2) | 21 (72.4) | 18 (69.2) |