Hydrogen cyanide (HCN) in cigarette smoke is mainly derived from decomposition products of protein, amino acid, nitrate, and nitrogen compounds (1). HCN is listed as one of the “Harmful and Potentially Harmful Chemicals” (HPHC) for cigarette smoke. Thus, accurate determination is crucial for tobacco stakeholders, researchers, and regulators (2,3,4).
Historically, attempts to standardize methodology for use with cigarette smoke have been hindered by regional differences in practices and reporting requirements and the highly automated functionality of the typical detection methods employed. Typically, cigarette smoke was collected using one of two trapping systems: either one glass fiber filter pad in tandem with one impinger (“Pad+Imp”) (5) or two overlapping glass fiber filter pads (“Pad+Pad”) (6, 7). The trapped smoke HCN was then analyzed by different instruments, such as continuous flow analysis (CFA) (5,6,7), voltammetry (8), ion chromatography (9, 10), or liquid chromatography-tandem mass spectrometry (11). Additionally, a proficiency study among 14 global laboratories using their own methods confirmed that many of the different methodology produced accurate results making it difficult to narrow the choice of variables towards one harmonized method (12). Thus, a project was undertaken to develop a consolidated method for CFA that incorporated optional variables that had previously been determined to be equivalent. The results and subsequent standardized method are detailed herein.
Seven cigarette samples (CM9, KR 1R6F, KR 2R5F and four commercial cigarettes) were tested by 18 global laboratories. The samples had a range of blend styles (Virginia and American blends) and ISO 3308 “tar” yields (1 mg–16 mg). The cigarettes were smoked under both the ISO 3808 (13) and ISO 20778 (14) smoking regimes as representative non-intense and intense analytical regimes, respectively. Statistical analysis including repeatability and reproducibility data calculated according to ISO 5725-2 (15) are provided. All raw data are provided on the CORESTA website (16).
The laboratories that conducted the testing are listed in Table 1. To ensure anonymity of the results, each laboratory was given a unique laboratory code for data exchange and reporting.
Participating laboratories and institutions.
| Name of participants |
|---|
| BATB Regulatory Analysis Laboratory |
| Beijing Cigarette Factory Company, Ltd., Shanghai Tobacco Group |
| Beijing Tobacco Quality Supervision and Inspection Station |
| China National Tobacco Quality Supervision and Test Center |
| China Tobacco Anhui Industrial Co., Ltd. |
| China Tobacco Chongqing Industrial Co., Ltd. |
| China Tobacco Fujian Industrial Co., Ltd. |
| China Tobacco Gansu tobacco Industrial Co., Ltd. |
| China Tobacco Guangxi Industrial Co., Ltd. |
| China Tobacco Guizhou Industrial Co., Ltd. |
| China Tobacco Henan Industrial Co., Ltd. |
| China Tobacco Jiangxi Industrial Co., Ltd. |
| China Tobacco Sichuan Industrial Co., Ltd. |
| China Tobacco Zhejiang Industrial Co., Ltd. |
| Global Laboratory Services |
| KT&G Research Institute |
| MP C.I.T. Montepaz S.A. |
| Yunnan Tobacco Quality Supervision and Inspection Station |
Participating laboratories were asked to follow a supplied study protocol which included a draft of the CORESTA Recommended Method (CRM) for the determination of HCN. Samples analyzed for the study, listed in Table 2 were selected to achieve a wide range of “tar” values (1 mg–16 mg). Participants were instructed to target five replicates in a specified randomized run order and to report puff count, total particulate matter (TPM), total HCN, and optionally, pad HCN and impinger HCN.
Study samples.
| Sample | Description | ISO 3308 “tar” level (mg/cig) |
|---|---|---|
| KR 2R5F | American blend | 1 |
| Sample 1 | American blend – charcoal filter | 3 |
| Sample 2 | American blend – charcoal filter | 5 |
| KR 1R6F | American blend | 8 |
| Sample 3 | Virginia blend | 8 |
| Sample 4 | Virginia blend | 11 |
| CM9 | Virginia blend | 16 |
Following the recommended method, the cigarettes were smoked according to ISO 4387 (17). Typically, if using a linear smoking machine, 4 cigarettes were smoked per replicate for ISO 3308 (ISO non-intense) and 2 cigarettes per replicate for ISO 20778 (ISO intense) smoking regime. If using a rotary smoking machine, the cigarettes smoked were 10 and 20 cigarettes per replicate, respectively. In any case, a sufficient number of cigarettes for detection without risking particulate breakthrough for the trapping system were required. Cigarettes were smoked using standard smoking machines fitted with “Pad+Imp” (trapping system 1) or “Pad+Pad” (trapping system 2).
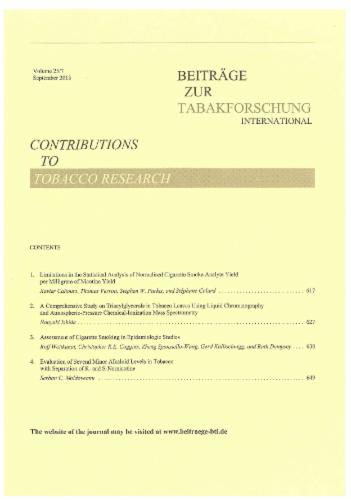
For trapping system 1, the cigarette holder with one glass fiber filter pad (Cambridge filter pad; CFP) was connected in tandem to a fritted stem impinger (Figure 1). The CFP and fritted stem impinger were used to trap particulate- and gas-phase HCN of smoke, respectively. 30 mL of 0.1 M sodium hydroxide solution is suitable for ISO non-intense regime and 90 mL of 0.1 M sodium hydroxide solution for ISO intense regime. After smoking, the CFP was removed, folded into a quarter (with the condensate inside) and used to wipe the inside of the holder. The CFP was placed in 50 mL of 0.1 M sodium hydroxide solution (44-mm pad) or 100 mL of 0.1 M sodium hydroxide solution (92-mm pad). The flask was shaken at 200 rpm on a wrist-action shaker for 30 min. The extract solution was filtered into the sample vessel by a 0.45-µm membrane filter. The impinger solution was quantitatively transferred into a volumetric flask (e.g., 100-mL, 200-mL). The impinger was triple rinsed with measured 0.1 M NaOH(aq). The flask was filled to volume with 0.1 M NaOH(aq). The mixed solution of impinger and rinsing solution was transferred to the sample vessel.
Example of a suitable trapping system 1.
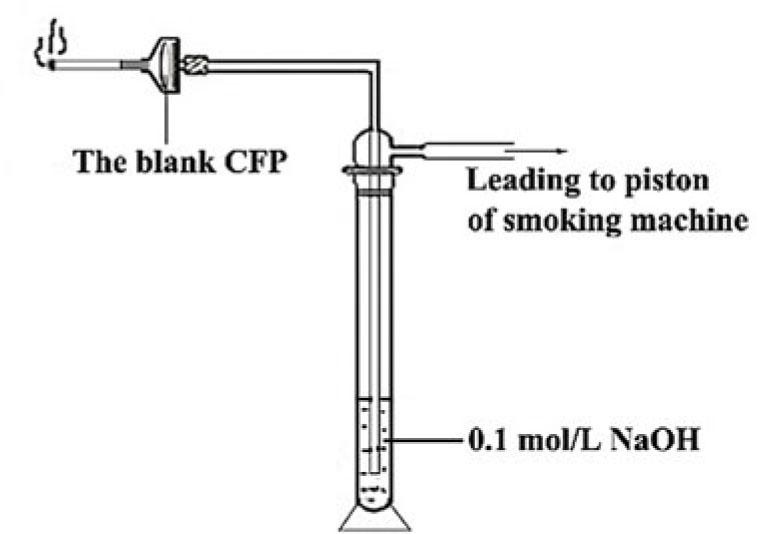
In trapping system 2, the treated CFP was positioned in line with a blank CFP in the cigarette holder connected directly to the machine piston (Figure 2). When using a linear smoking machine, a 44-mm CFP was placed into a 60-mm culture disk or a 100-mL beaker containing 2.0 mL of a solution of 1 M NaOH (in 50:50 EtOH:water). After being fully saturated, it was put into a fume hood for about 10 min to evaporate ethanol and then transferred into a controlled environment for 1–3 h at 22 °C ± 1 °C and 60% ± 2% of relative humidity. When using a rotary smoking machine, a 92-mm CFP was placed into a 100-mm culture disk or a 500-mL beaker containing 8.0 mL of a solution of 1 M NaOH (in 50:50 EtOH:water). The procedure of evaporation and conditioning of the 92-mm CFP were the same as for the 44-mm CFP. The cigarette holder was subsequently loaded with the CFPs with rough sides of both CFPs toward the incoming smokestream.
Example of trapping system 2.
Post smoking, the two CFPs were disassembled, folded together into a quarter (with the condensate inside) and used to wipe the inside of the holder. The two CFPs were placed into 100 mL of 0.1 M NaOH(aq) solution (44-mm pad) or 250 mL of 0.1 M NaOH(aq) solution (92-mm pad). The flask was shaken at 200 rpm on a wrist shaker for 30 min. The extract solution was filtered into the sample vessel through a 0.45-µm membrane filter.
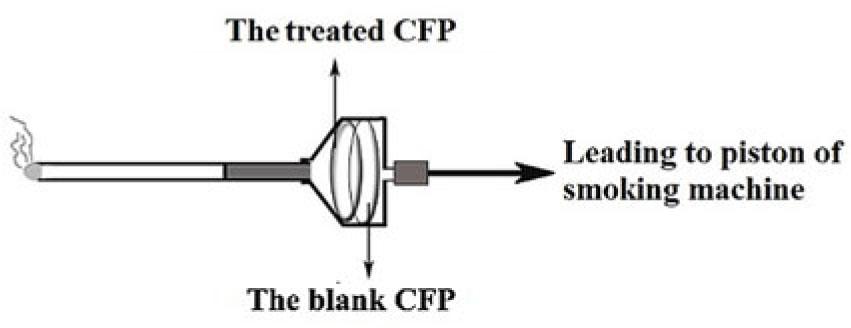
HCN in CFP extracts and impingers was determined using CFA based on the detection of the coloring system as specified by the manufacturer. For example, a system formed by the reaction of cyanides with chromogenic reagents, including pyridine/pyrazolone and 1,3-dimethyl barbituric acid. A single-channel spectrometer (e.g., 600 nm) was employed to detect the colored complex. The manifold of a continuous flow analyzer and the typical output of HCN determination are shown in Figure 3 and 4, respectively.
The manifold of the continuous flow analyzer for hydrogen cyanide determination.
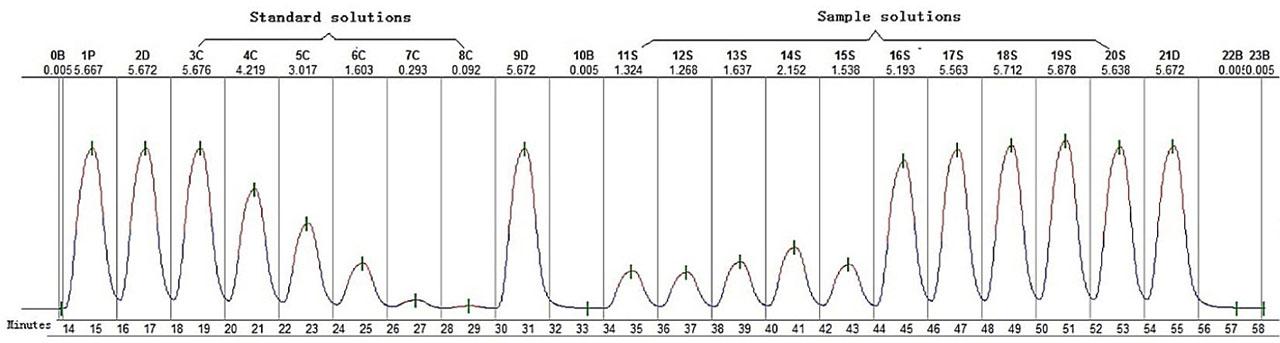
Typical graph of hydrogen cyanide determination by CFA.
Eighteen participating laboratories provided 22 data sets across both method subtypes (“Pad+Imp” and “Pad+Pad”) using either linear (18 sets) or rotary (4 sets) smoking machines. Data consistency was verified using numerical outlier detection techniques of IUPAC (18). Grubbs test was used to evaluate between-laboratories consistency and Cochran’s test were used to evaluate within-laboratory consistency. Because the number of data sets (labs) using “Pad+Imp” trapping system was no more than five, it was unnecessary to use IUPAC method to perform the outlier detection for these labs. The results of outlier detection are listed in Table 3. Under the ISO non-intense smoking regime, only one or two labs corresponding to each sample were excluded, while under the ISO intense smoking regime, the excluded labs corresponding to each sample ranged from 1–4. Statistical analysis was carried out following ISO 5725-2 to generate repeatability (r) and reproducibility (R) data on a combined data set without regard for sample collection, or detection type or model.
The results of outlier detection.
| Sample | Method | Lab code a | |||
|---|---|---|---|---|---|
| Overallb | Pad+Pad | ||||
| ISO non-intense | ISO intense | ISO non-intense | ISO intense | ||
| CM9 | Cochran | 3 | 3, 12 | 8b | 8a |
| Grubbs | |||||
| KR 1R6F | Cochran | 3, 8b | 3 | 8b | 8a |
| Grubbs | |||||
| KR 2R5F | Cochran | 12 | 12, 8a | 8b | 8a |
| Grubbs | 8b, 15 | ||||
| Sample 1 | Cochran | 1 | 12, 8a | 1 | 8a |
| Grubbs | |||||
| Sample 2 | Cochran | 2, 12 | 8a | 2 | 8a |
| Grubbs | |||||
| Sample 3 | Cochran | 12, 8b | 12, 7 | 8b | 7 |
| Grubbs | |||||
| Sample 4 | Cochran | 8b | 9, 8a | 8b | 9 |
| Grubbs | 15 | 8b, 15 | |||
Lab code assignments were 1–19, ‘a’ and ‘b’ designations indicate multiple data sets from a single laboratory;
Overall is the combined data “Pad+Pad” and “Pad+Imp”.
The study design allowed for evaluation of the robustness of the method across the linear range for analytes of interest and to confirm the method’s effectiveness with a variety of products. Thus, the study samples chosen represented a wide variety of ISO 3308 “tar” levels, tobacco blends, and product construction parameters including varied filter ventilation level and inclusion of the charcoal filter. ISO non-intense and intense smoking regimes were used to verify applicability with the recommended method. Indeed while “tar” determination was not in the scope of the study, the range of experimentally determined total particulate matter (TPM) values was quite broad at approximately 1mg/cig to 50 mg/cig.
Table 4 and Table 5 summarize the mean HCN yields and standard deviation (Stdev) of the seven samples under ISO non-intense and ISO intense smoking regimes, respectively. The mean HCN yield decreased with decreasing ISO 3308 “tar” levels under ISO non-intense regime. The relative variabilities (%RSD, percent relative standard deviation) from trapping system 2 were smaller than those from trapping system 1 under both smoking regimes. The paired t-test was used to compare mean smoke yields of HCN achieved by the two trapping systems. No significant differences in results were noted between the data from the two trapping systems under either ISO non-intense (p = 0.555) or ISO intense (p = 0.304) smoking regimes. In most cases, results from the two trapping systems were consistent with each other, which suggests either the “Pad+Pad” or “Pad+Imp” method subtype can be adopted in the determination of HCN in mainstream cigarette smoke.
Mean total hydrogen cyanide (μg/cig) yields in mainstream smoke under ISO non-intense smoking regime.
| Sample | Overall a | Pad+Pad | Pad+Imp | ||||||
|---|---|---|---|---|---|---|---|---|---|
| Mean | Stdev b | RSD(%) c | Mean | Stdev | RSD(%) | Mean | Stdev | RSD(%) | |
| CM9 | 139.34 | 9.29 | 6.67 | 140.74 | 8.66 | 6.15 | 134.84 | 10.10 | 7.49 |
| KR 1R6F | 95.67 | 5.91 | 6.18 | 96.41 | 5.52 | 5.73 | 93.97 | 8.35 | 8.89 |
| KR 2R5F | 12.82 | 1.44 | 11.27 | 12.95 | 1.38 | 10.66 | 13.81 | 3.02 | 21.83 |
| Sample 1 | 26.96 | 2.78 | 10.32 | 26.41 | 2.43 | 9.21 | 29.11 | 3.08 | 10.59 |
| Sample 2 | 53.54 | 4.03 | 7.53 | 52.98 | 4.02 | 7.58 | 59.82 | 6.68 | 11.17 |
| Sample 3 | 83.50 | 6.90 | 8.27 | 84.09 | 6.97 | 8.29 | 81.83 | 8.00 | 9.78 |
| Sample 4 | 103.54 | 6.00 | 5.79 | 103.95 | 6.32 | 6.08 | 95.63 | 11.14 | 11.65 |
Overall is the combined data “Pad+Pad” and “Pad+Imp”;
Stdev is standard deviation;
RSD(%) is relative standard deviation.
Mean total hydrogen cyanide (μg/cig) yields in mainstream smoke under ISO intense smoking regime.
| Sample | Overall a | Pad+Pad | Pad+Imp | ||||||
|---|---|---|---|---|---|---|---|---|---|
| Mean | Stdev b | RSD(%) c | Mean | Stdev | RSD(%) | Mean | Stdev | RSD(%) | |
| CM9 | 302.70 | 17.95 | 5.93 | 305.63 | 16.43 | 5.38 | 319.12 | 40.27 | 12.62 |
| KR 1R6F | 394.90 | 35.18 | 8.91 | 399.01 | 31.30 | 7.85 | 402.66 | 35.26 | 8.76 |
| KR 2R5F | 377.04 | 19.31 | 5.12 | 371.43 | 27.15 | 7.31 | 362.74 | 44.46 | 12.26 |
| Sample 1 | 324.66 | 28.28 | 8.71 | 327.29 | 26.60 | 8.13 | 316.93 | 35.32 | 11.14 |
| Sample 2 | 337.91 | 29.68 | 8.78 | 338.69 | 31.24 | 9.22 | 334.67 | 22.49 | 6.72 |
| Sample 3 | 265.71 | 22.55 | 8.49 | 269.24 | 21.48 | 7.98 | 259.32 | 31.29 | 12.07 |
| Sample 4 | 248.68 | 11.75 | 4.73 | 245.89 | 16.08 | 6.54 | 233.99 | 23.52 | 10.05 |
Overall is the combined data “Pad+Pad” and “Pad+Imp”;
Stdev is standard deviation;
RSD(%) is relative standard deviation.
The r and R values under ISO non-intense and ISO intense regimes are displayed in Table 6 and Table 7, respectively. After the removal of outliers, r and R values were calculated from data sets of various trapping systems, i.e., “Pad+Pad”, “Pad+Imp”, “Overall” (combined data for both trapping systems). Under the ISO non-intense smoking regime, both r and R values of the “Pad+Pad” trapping system were lower than those of the “Pad+Imp” trapping system. The maximum r(%) of “Overall”, “Pad+Pad”, and “Pad+Imp” trapping systems were 20.0%, 19.7% and 24.4%, respectively. The maximum R(%) of “Overall”, “Pad+Pad”, and “Pad+Imp” trapping systems were 32.3%, 30.6% and 68.4%, respectively. The lowest ISO 3308 “tar” yielding products had the most variable data.
Repeatability (r) and Reproducibility (R) for hydrogen cyanide (μg/cig) under ISO non-intense smoking regime.
| Sample | Method | N of data | Mean | r | r(%) a | R | R(%) b |
|---|---|---|---|---|---|---|---|
| CM9 | Overall c | 21 | 139.34 | 12.33 | 8.85 | 26.69 | 19.15 |
| P+P d | 16 | 140.74 | 11.18 | 7.94 | 25.01 | 17.77 | |
| P+Ie | 5 | 134.84 | 18.04 | 13.38 | 30.24 | 22.42 | |
| KR 1R6F | Overall | 19 | 95.67 | 11.47 | 11.99 | 16.92 | 17.69 |
| P+P | 15 | 96.41 | 9.31 | 9.65 | 15.90 | 16.50 | |
| P+I | 5 | 93.97 | 22.97 | 24.44 | 23.74 | 25.27 | |
| KR 2R5F | Overall | 19 | 12.82 | 2.56 | 19.98 | 4.14 | 32.30 |
| P+P | 15 | 12.95 | 2.55 | 19.67 | 3.97 | 30.64 | |
| P+I | 4 | 13.81 | 3.26 | 23.60 | 9.45 | 68.40 | |
| Sample 1 | Overall | 20 | 26.96 | 4.29 | 15.93 | 7.99 | 29.63 |
| P+P | 16 | 26.41 | 4.04 | 15.28 | 7.00 | 26.49 | |
| P+I | 4 | 29.11 | 5.17 | 17.77 | 9.45 | 32.45 | |
| Sample 2 | Overall | 19 | 53.54 | 7.46 | 13.94 | 11.54 | 21.56 |
| P+P | 16 | 52.98 | 7.95 | 15.00 | 11.52 | 21.74 | |
| P+I | 4 | 59.82 | 7.21 | 12.06 | 20.95 | 35.02 | |
| Sample 3 | Overall | 19 | 83.50 | 8.77 | 10.50 | 19.86 | 23.79 |
| P+P | 16 | 84.09 | 9.20 | 10.94 | 20.13 | 23.94 | |
| P+I | 4 | 81.83 | 18.45 | 22.55 | 23.62 | 28.86 | |
| Sample 4 | Overall | 19 | 103.54 | 11.01 | 10.63 | 17.18 | 16.59 |
| P+P | 16 | 103.95 | 11.40 | 10.96 | 18.17 | 17.47 | |
| P+I | 4 | 95.63 | 13.30 | 13.91 | 34.79 | 36.38 |
r(%) = r / Mean × 100%;
R(%) = R / Mean × 100%;
Overall is the combined data “Pad+Pad” and “Pad+Imp”;
P+P is “Pad+Pad”;
P+I is “Pad+Imp”.
Repeatability (r) and Reproducibility (R) for hydrogen cyanide (μg/cig) under ISO intense smoking regime.
| Sample | Method | N of data | Mean | r | r(%) a | R | R(%) b |
|---|---|---|---|---|---|---|---|
| CM9 | Overall c | 20 | 302.70 | 27.53 | 9.09 | 51.53 | 17.02 |
| P+P d | 16 | 305.63 | 26.26 | 8.59 | 47.30 | 15.48 | |
| P+Ie | 5 | 319.12 | 71.50 | 22.41 | 120.59 | 37.79 | |
| KR 1R6F | Overall | 20 | 394.90 | 44.49 | 11.27 | 101.16 | 25.62 |
| P+P | 15 | 399.01 | 37.42 | 9.38 | 90.60 | 22.71 | |
| P+I | 5 | 402.66 | 66.89 | 16.61 | 105.06 | 26.09 | |
| KR 2R5F | Overall | 16 | 377.04 | 27.66 | 7.34 | 55.69 | 14.77 |
| P+P | 15 | 371.43 | 31.25 | 8.41 | 78.60 | 21.16 | |
| P+I | 4 | 362.74 | 78.49 | 21.64 | 135.60 | 37.38 | |
| Sample 1 | Overall | 19 | 324.66 | 28.10 | 8.66 | 81.54 | 25.11 |
| P+P | 16 | 327.29 | 27.71 | 8.47 | 76.94 | 23.51 | |
| P+I | 4 | 316.93 | 59.27 | 18.70 | 108.17 | 34.13 | |
| Sample 2 | Overall | 20 | 337.91 | 35.90 | 10.63 | 85.39 | 25.27 |
| P+P | 16 | 338.69 | 36.18 | 10.68 | 90.30 | 26.66 | |
| P+I | 4 | 337.93 | 61.11 | 18.08 | 77.58 | 22.96 | |
| Sample 3 | Overall | 19 | 265.71 | 23.68 | 8.91 | 65.00 | 24.46 |
| P+P | 16 | 269.24 | 23.88 | 8.87 | 62.12 | 23.07 | |
| P+I | 4 | 259.32 | 51.43 | 19.83 | 96.00 | 37.02 | |
| Sample 4 | Overall | 17 | 248.68 | 21.97 | 8.84 | 33.71 | 13.56 |
| P+P | 16 | 245.89 | 26.55 | 10.80 | 46.26 | 18.81 | |
| P+I | 4 | 233.99 | 17.52 | 7.49 | 74.31 | 31.76 |
r(%) = r / Mean × 100%;
R(%) = R / Mean ×100%;
Overall is the combined data “Pad+Pad” and “Pad+Imp”;
P+P is “Pad+Pad”;
P+I is “Pad+Imp”.
Under the ISO intense smoking regime, the maximum r(%) of “Overall”, “Pad+Pad”, and “Pad+Imp” trapping systems were 11.3%, 10.8% and 22.4%, respectively. The maximum R(%) of “Overall”, “Pad+Pad”, and “Pad+Imp” trapping systems were 25.6%, 26.7% and 37.8%, respectively. Except for the r values of Sample 2 and 4, both r and R values of the “Pad+Pad” trapping system were also lower than those of the “Pad+Imp” trapping system.
Based on ISO 13528 (19), z-scores are designed to indicate whether lab results are within the normal range of other labs. It is expected that most z-scores should be in the range of −2 to 2. A value of 2 ≤ |z| < 3 should be interpreted as a warning signal, and a dataset with a value of 3 ≤ |z| should be considered an “action signal” to examine laboratory performance. Figure 5 shows the z-scores for each lab calculated from the “Overall” data sets. Z-score results exhibit only two data sets, both of which came from “Pad+Imp” trapping systems, that were determined to be outliers.
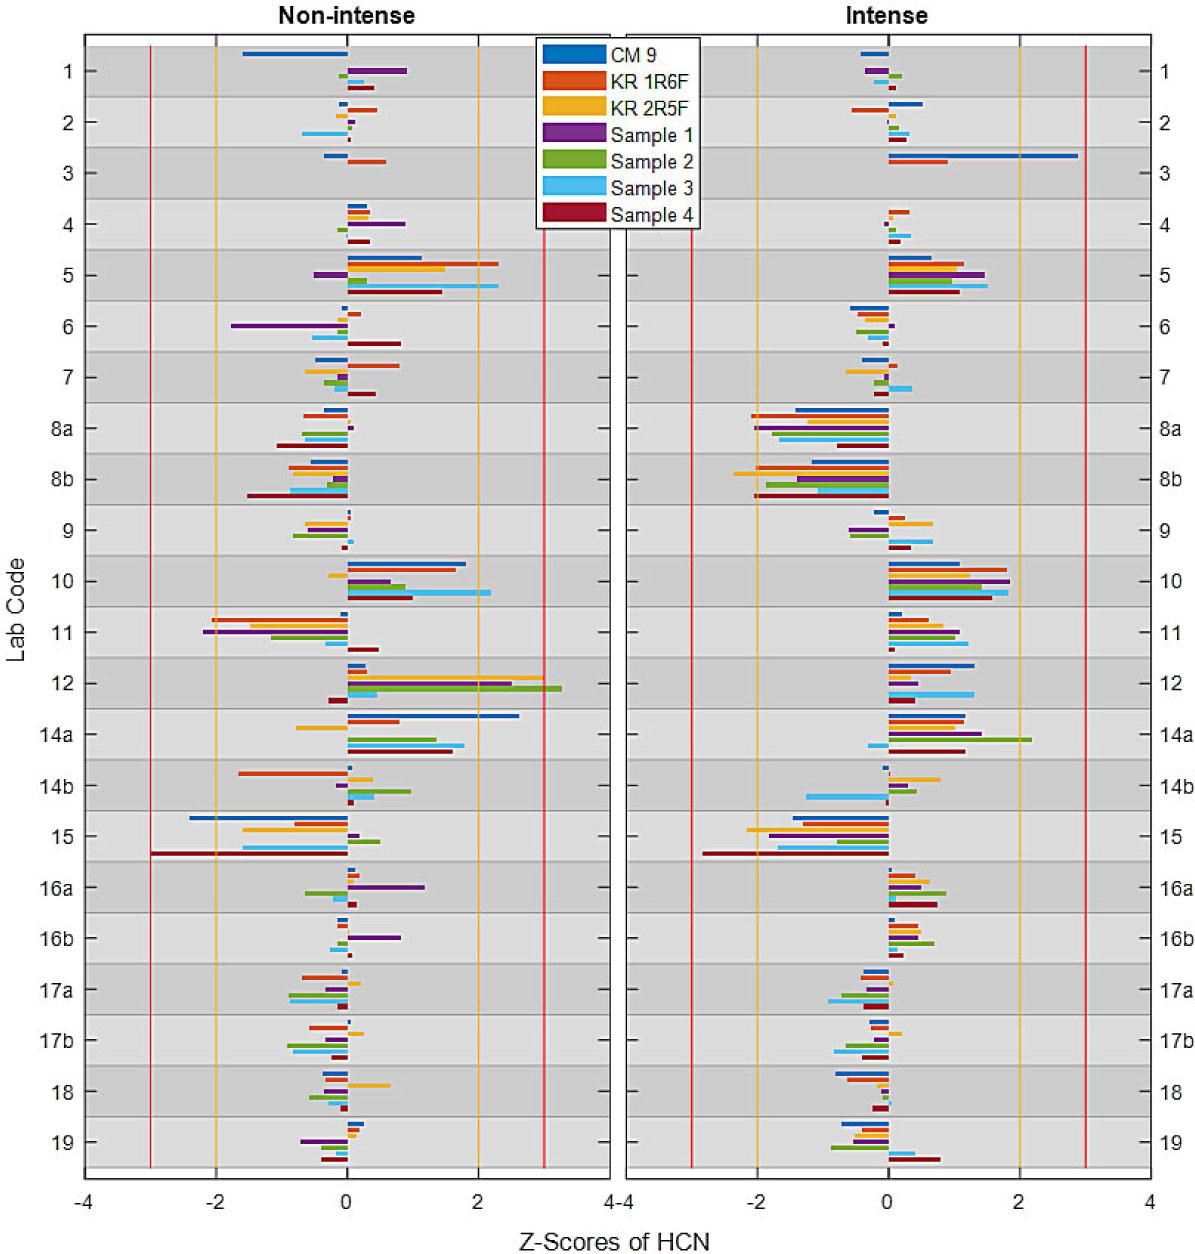
Z-scores for each lab under ISO non-intense and ISO intense smoking regimes.
No statistically significant differences of HCN yields were observed between the trapping systems of “Pad+Pad” and “Pad+Imp” under ISO non-intense or intense regimes. Although labs were not all using the same trapping method subtypes, the repeatability and reproducibility suggest that the test results were within the range of what might be considered acceptable. Thus, through this study, a robust method for the determination of HCN in mainstream cigarette smoke has been established. The scope of the study included 18 laboratories testing 7 cigarette samples using a diversity of standardized equipment and two trapping systems. The products had a range of total particulate matter values between 1 and 50 mg/cig and HCN values between 13 and 400 µg/cig.