Figure 1.
Figure 2.

Figure 3.
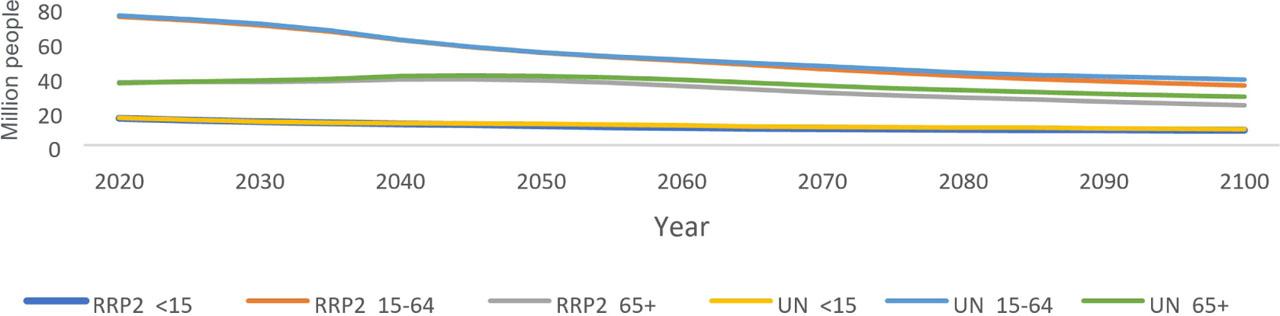
Figure 4.
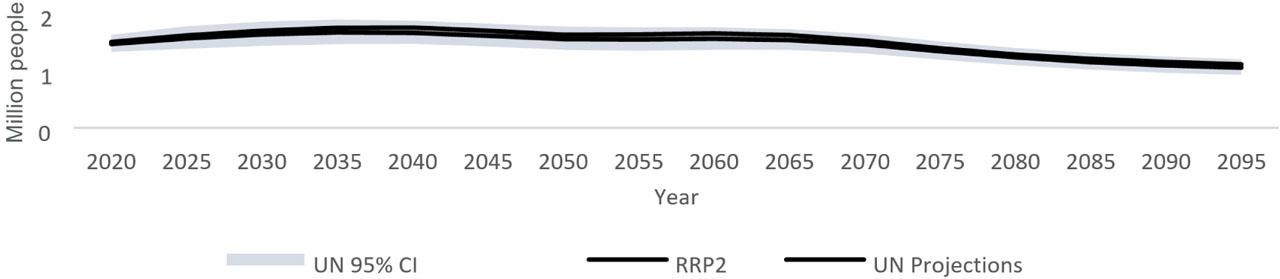
Figure 5.
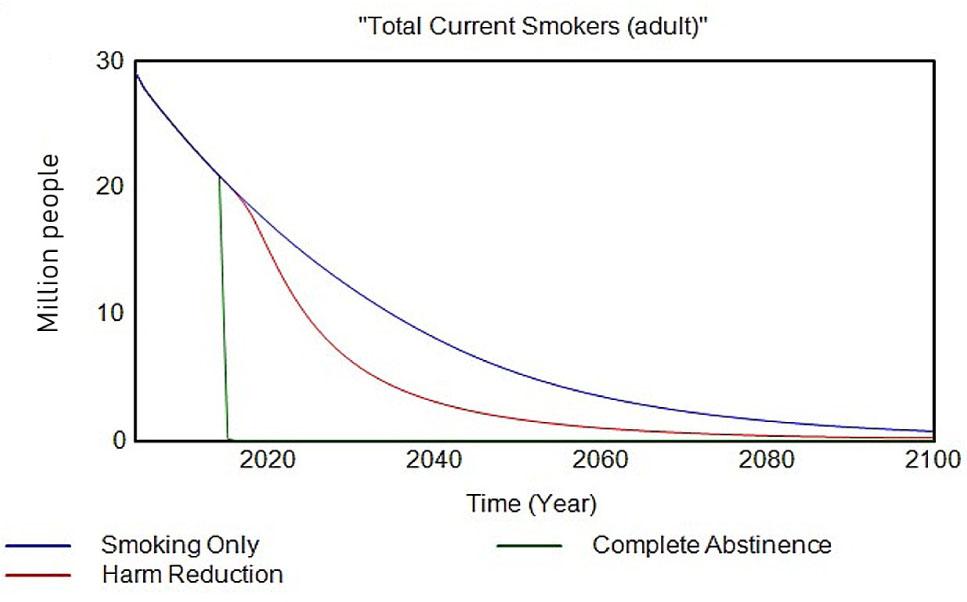
Figure 6.
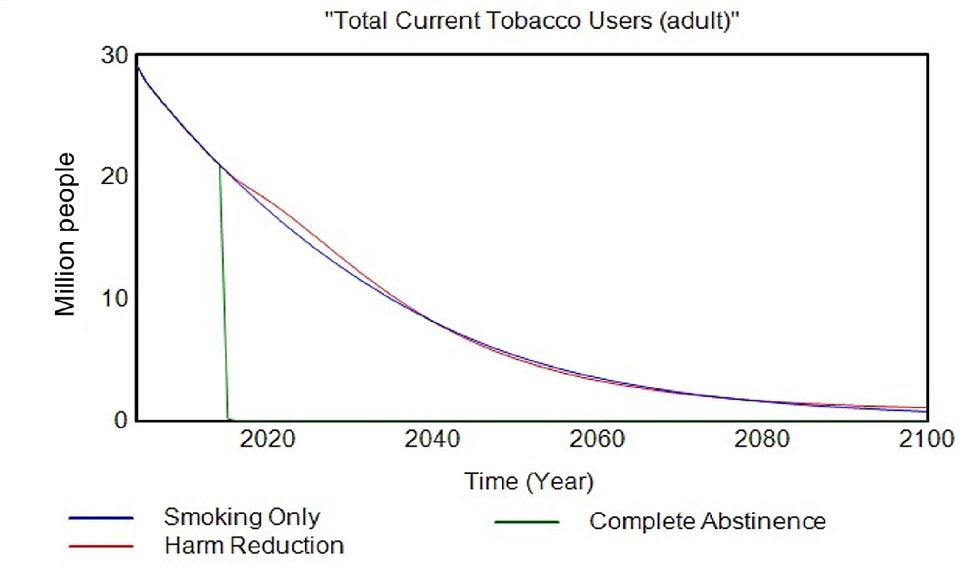
Figure 7.
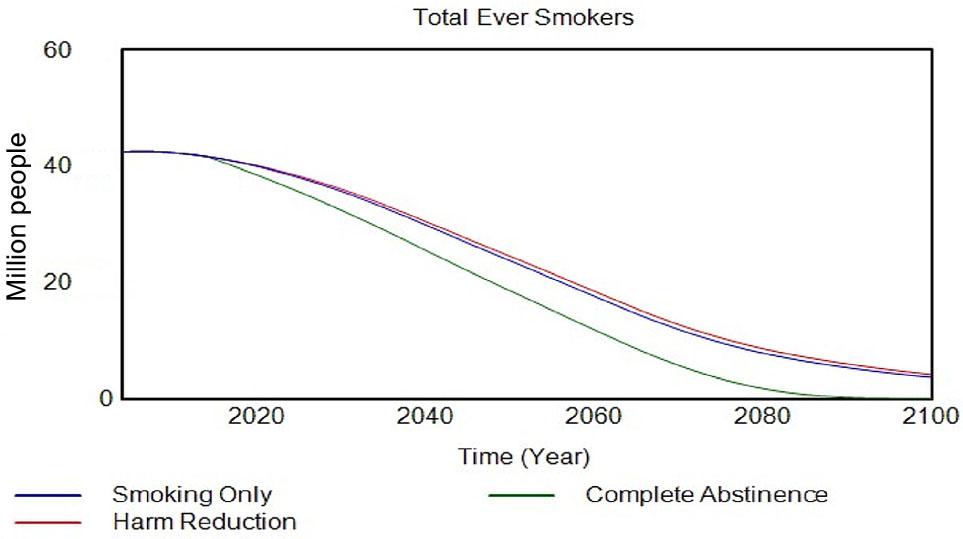
Figure 8.
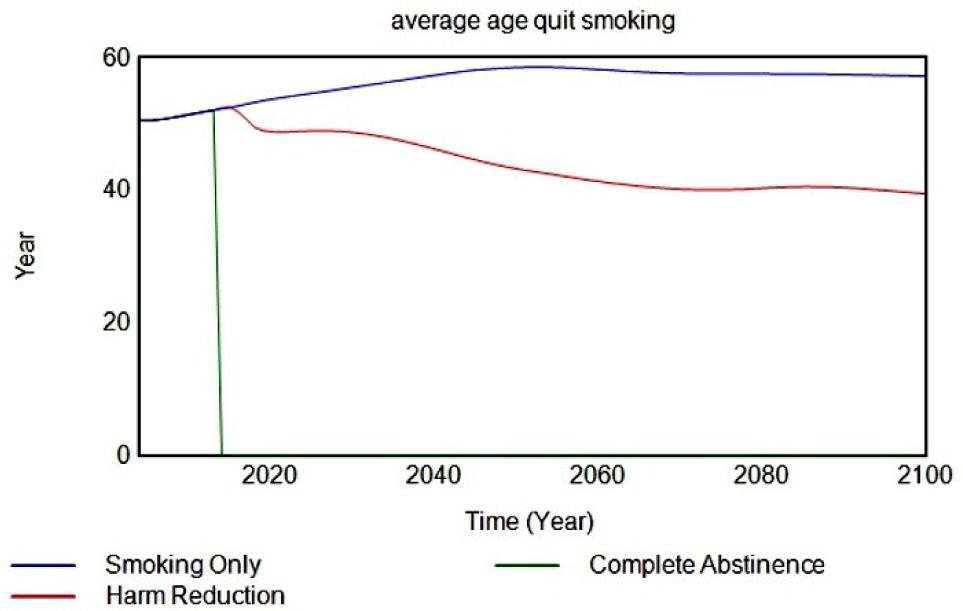
Figure 9.
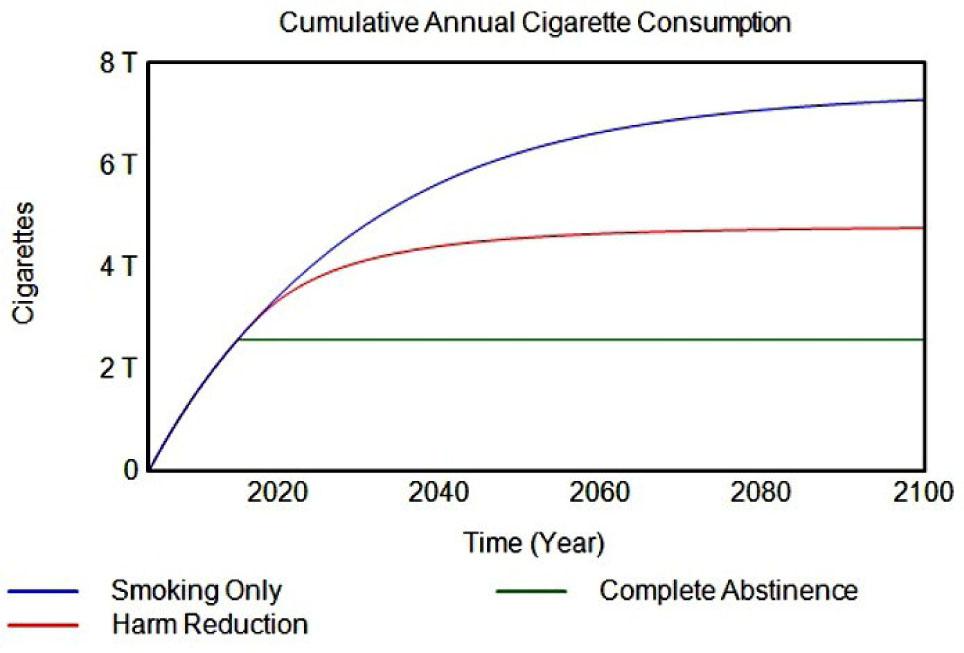
Figure 10.
Figure 11.
Figure 12.
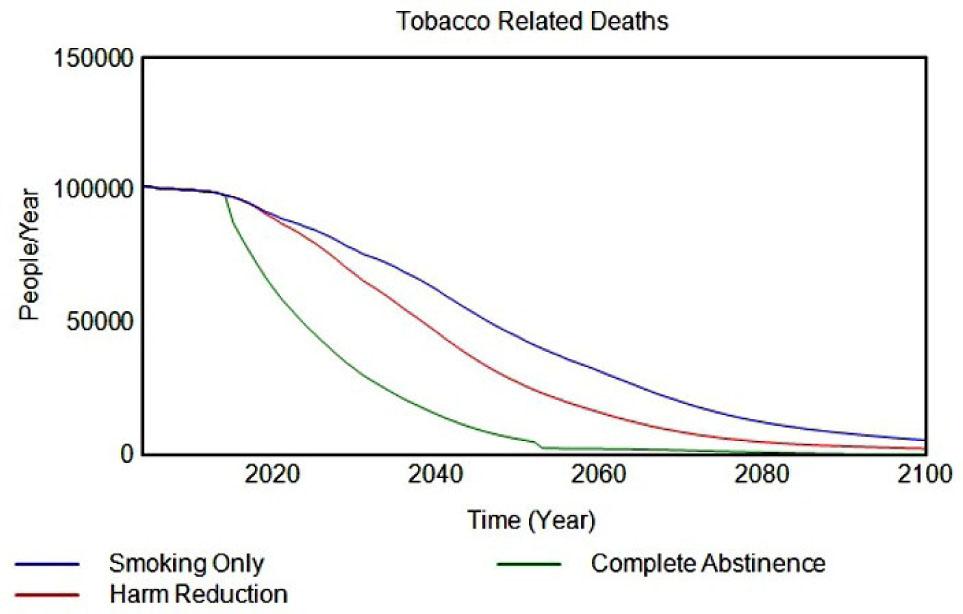
Figure 13.
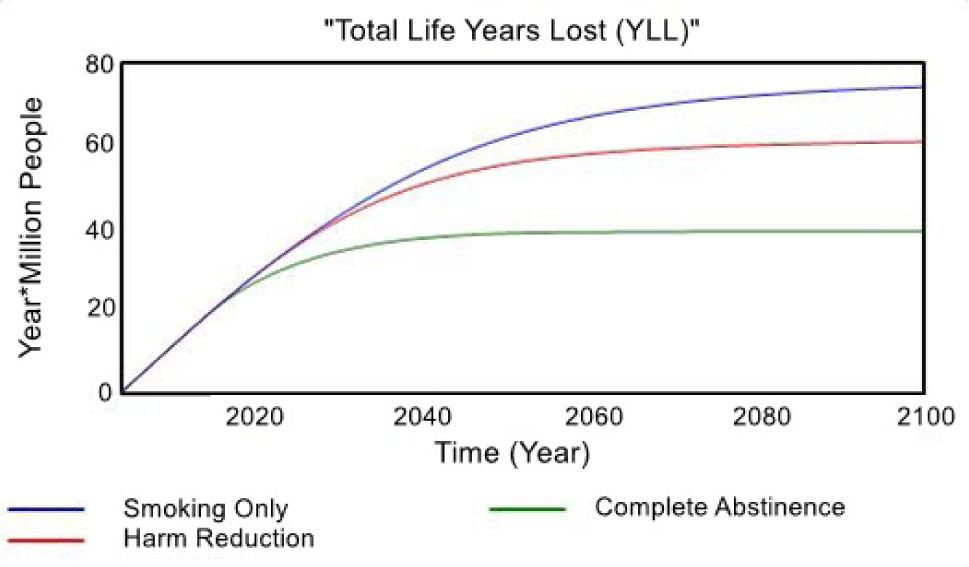
Figure 14.
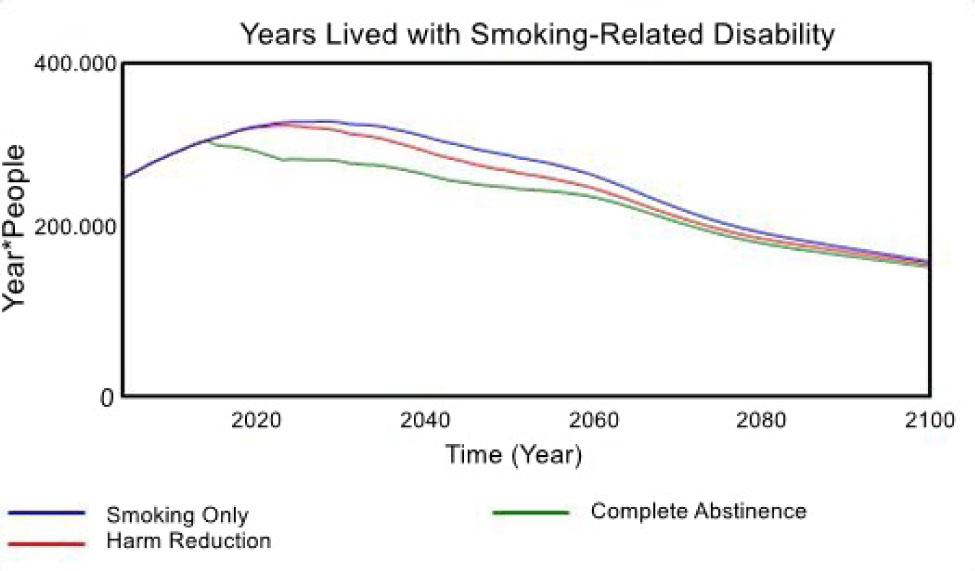
Figure 15.
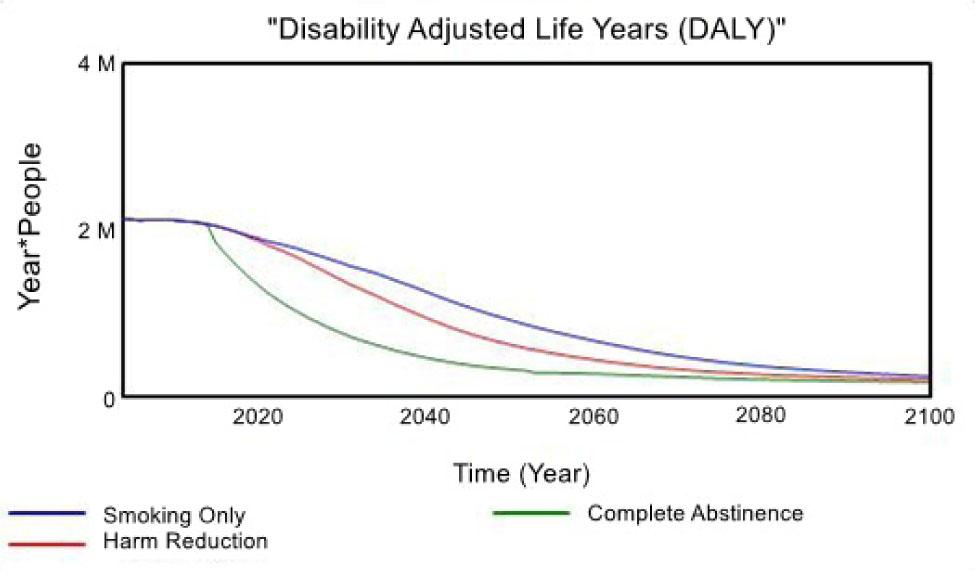
Figure 16.
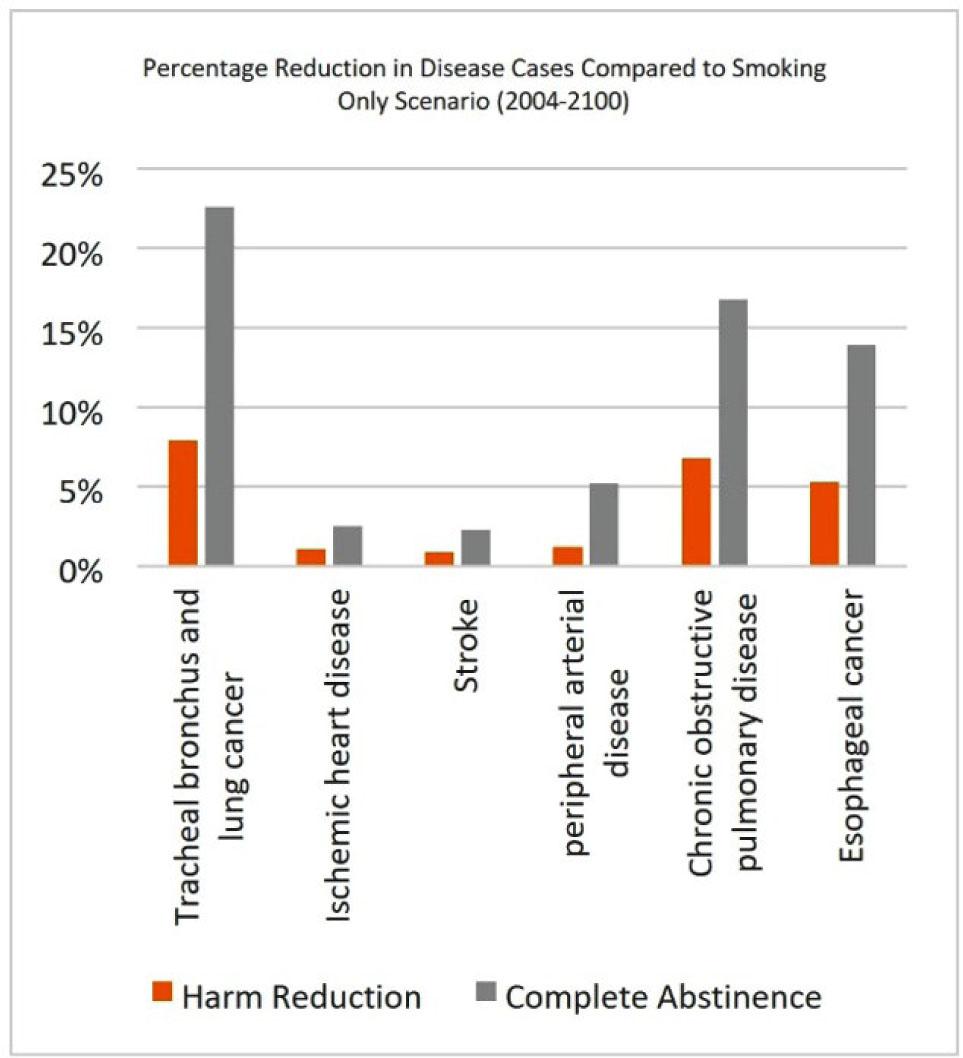
Figure 17.
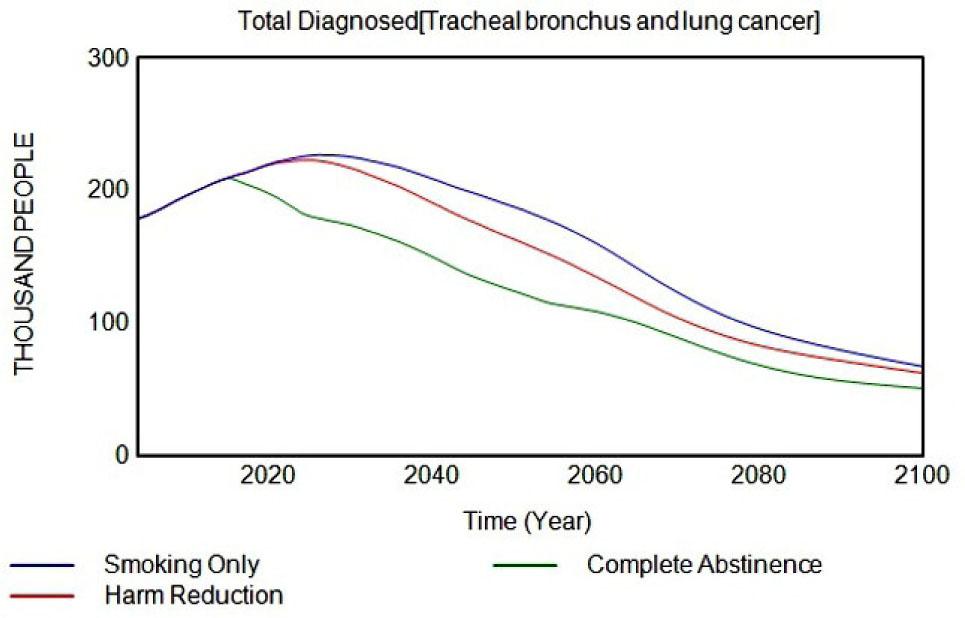
Figure 18.
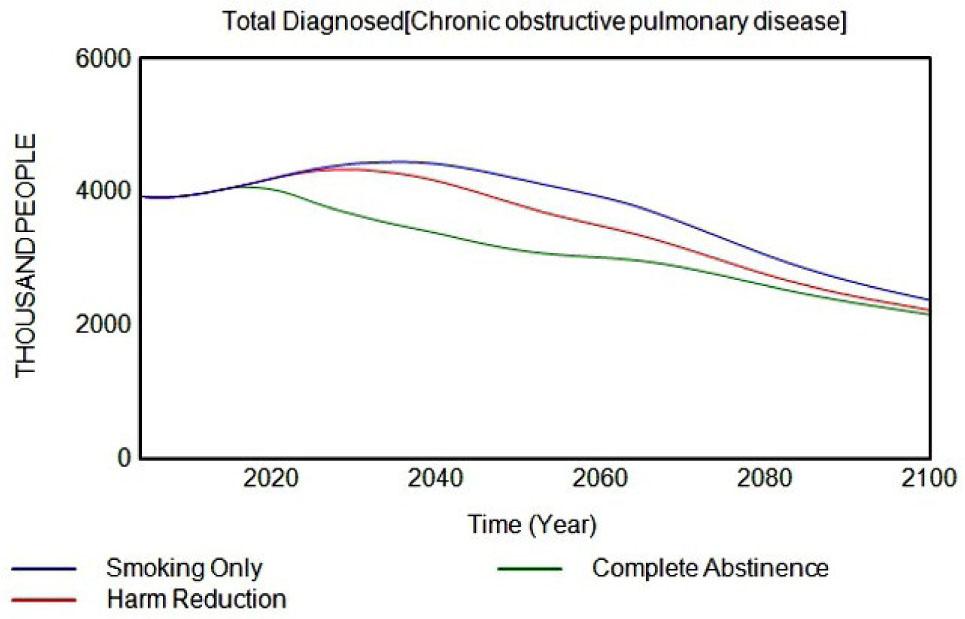
Figure 19.
Lifetime smoking initiation probability_
| Male | Female | |
|---|---|---|
| Lifetime initiation rate (2004) | 58.2% | 23.2% |
| Applied annual initiation decay (2004–2100)a | 3.1% | 2.6% |
Transition probabilities (females)_
| User status 12 months ago | n | Current user status (%) | |||
|---|---|---|---|---|---|
| Solus smoker | Solus THP | Dual user | No tobacco | ||
| Solus smoker | 392 | 81.4 (76.7–85.5) | 1.5 (0.4–3.5) | 7.0 (4.5–10.3) | 10.1 (7.0–14.0) |
| Solus THP | |||||
| Never smoker | 8 | — | 82.7 (42.3–98.9) | — | 17.3 (1.1–58.7) |
| Former smoker | 29 | — | 91.1 (74.5–98.4) | — | 8.9 (1.6–25.5) |
| Dual user | 85 | 6.6 (1.9–15.7) | 39.3 (28.0–51.5) | 50.8 (38.8–62.8) | 3.2 (0.5–10.2) |
Definitions of key model variables and units_
| Variable | Description | Units |
|---|---|---|
| YLD | Years lived with disability | People years |
| Disability weight | Health loss associated with disease | Factor |
| Disease duration | Average time diagnosed with disease until either successful treatment or death | Years |
| Disease incidence rate | New disease cases in current year | People/year |
| NS Disease incidence probability | Probability a Never Smoker is newly diagnosed with disease | Probability/year |
| HR | Hazard ratio of disease incidence compared to that of a never smoker | Factor |
| Expected incidence rate | New disease cases in base year (2004) | People/year |
| P | Prevalence of the tobacco usage state | Percentage |
j_cttr-2025-0001_tab_011
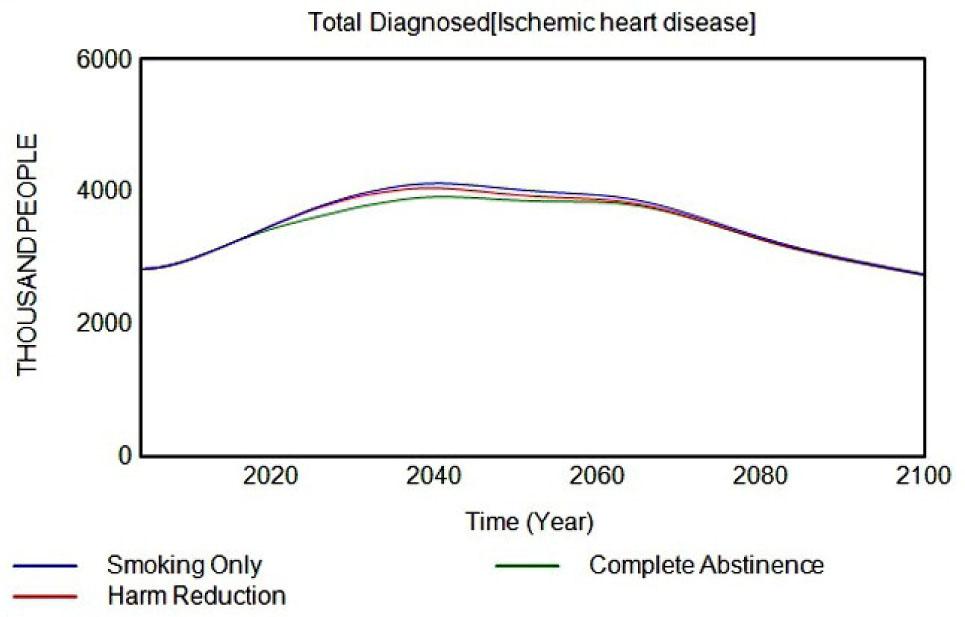
| Smoking Only: | Where cigarettes are the only tobacco product available. |
| Harm Reduction: | Where THPs are introduced to the market in 2014. |
| Complete Abstinence: | Where all tobacco product use ceases in 2014. |
Transition probabilities (males)_
| User status 12 months ago | n | Current user status (%) | |||
|---|---|---|---|---|---|
| Solus smoker | Solus THP | Dual user | No tobacco | ||
| Solus smoker | 1038 | 82.3 (79.4–85) | 1.0 (0.4–2.3) | 7.6 (5.8–9.8) | 9.0 (7.3–11.1) |
| Solus THP | |||||
| Never smoker | 16 | — | 92.1 (67.6–99.6) | 5.5 (0.1–29.2) | 2.3 (0–24.5) |
| Former smoker | 49 | — | 88.4 (75.0–96.1) | 5.3 (0.7–17.3) | 6.3 (1.2–17.7) |
| Dual user | 320 | 7.0 (4.1–11.1) | 32.8 (27.3–38.8) | 58.8 (52.5–64.8) | 1.4 (0.4–3.4) |
Smoking-related diseases in model_
| Smoking-related diseases |
|---|
| Ischemic heart disease |
| Stroke |
| Tracheal bronchus and lung cancer |
| Chronic obstructive pulmonary disease (COPD) |
| Esophageal cancer |
| Lower extremity peripheral arterial disease |
Smoking cessation probability_
| Age-group | 20–29 | 30–39 | 40–49 | 50–59 | 60–69 | 70–79 | ≥ 80 |
|---|---|---|---|---|---|---|---|
| Male cessationa | 2.2% | 3.6% | 3.9% | 4.6% | 6.9% | 9.2% | 9.1% |
| Female cessationa | 5.4% | 3.0% | 3.1% | 4.6% | 6.2% | 9.9% | 8.5% |
Lifetime THP initiation probability_
| THP Initiation | Male | Female |
|---|---|---|
| < Age 20 initiation | 6.2% | 1.2% |
| > Age 20 initiation | 3.5% | 2.5% |
| Lifetime initiation | 9.7% | 3.7% |
Adult tobacco use prevalence_ Japan adult population tobacco use prevalence by smoking and THP use status_
| Japan adult population tobacco use prevalence (2019–2020) | |||||||||
|---|---|---|---|---|---|---|---|---|---|
| Smoking status | Never | Current | Former | Never | Current | Former | Never | Current | Former |
| THP status | Never | Never | Never | Current | Current | Current | Former | Former | Former |
| NN | CN | FN | NC | CC | FC | NF | CF | FF | |
| All | 64.8% | 11.4% | 17.1% | 0.3% | 3.5% | 2.2% | 0.0% | 0.4% | 0.3% |
| Male | 44.1% | 17.7% | 27.6% | 0.3% | 5.9% | 3.4% | 0.0% | 0.6% | 0.4% |
| Female | 84.1% | 5.6% | 7.4% | 0.2% | 1.2% | 1.1% | 0.0% | 0.1% | 0.1% |
Data sources_
| Data sources |
|---|
| Japan´s population |
| Ministry of Internal Affairs and Communications, Census Division, Statistics Bureau |
| Population estimation (2004) |
| https://www.e-stat.go.jp/stat-search/file-download?statInfId=000000090235&fileKind=0 |
| Birth rate |
| National Institute of Population and Social Security Research |
| Population Projections for Japan (2017): 2016 to 2065, Appendix: Auxiliary Projections 2066 to 2115 (Table 5 and Reference Table 5) |
| http://www.ipss.go.jp/pp-newest/e/ppfj02/top.html |
| Mortality rates |
| The Global Burden of Disease Study |
| Supplementary appendix: Fertility, mortality, migration, and population scenarios for 195 countries and territories from 2017 to 2100: A forecasting analysis for the Global Burden of Disease Study, Lancet 2020 (Supplementary appendix 2, Table 15, Japan 2017 life table) |
| https://www.thelancet.com/journals/lancet/article/PIIS0140-6736(20)30677-2/fulltext#supplementaryMaterial |
| Life expectancy |
| The Global Burden of Disease Study |
| Supplementary appendix: Fertility, mortality, migration, and population scenarios for 195 countries and territories from 2017 to 2100: A forecasting analysis for the Global Burden of Disease Study, Lancet 2020 (Supplementary appendix 2,Table 15, Japan 2017 life table) |
| https://www.thelancet.com/journals/lancet/article/PIIS0140-6736(20)30677-2/fulltext#supplementaryMaterial |
| Net migration |
| National Institute of Population and Social Security Research |
| Population Projections for Japan (2017): 2016 to 2065, Appendix: Auxiliary Projections 2066 to 2115 (Figures 9 and 10) |
| http://www.ipss.go.jp/pp-newest/e/ppfj02/top.html |
| Smoking prevalence |
| National Health and Nutrition Survey |
| Part 4: Results of lifestyle-related survey |
| https://www.mhlw.go.jp/english/ |
| Former Smoker Quit Time |
| Estimating the population health impact of introducing a reduced-risk tobacco product into Japan, The effect of differing assumptions, and some comparisons with the U.S. |
| DOI: 10.1016/j.yrtph.2018.10.010 |
| Smoking initiation |
| National Health and Nutrition Survey (2003–2012) |
| https://www.mhlw.go.jp/bunya/kenkou/kenkou_eiyou_chousa.html |
| Smoker relapse |
| Web-based survey on smoking cessation behaviors of current and former smokers in Japan |
| DOI: 10.1185/03007995.2014.938149 |
| Smoking relative risks |
| Population attributable numbers and fractions of deaths due to smoking: A pooled analysis of 180,000 Japanese, Preventive Medicine Volume 52, Issue 1, January 2011, Pages 60–65 |
| DOI: 10.1016/j.ypmed.2010.11.009 |
| Former smoker risk decay |
| Estimating the population health impact of introducing a reduced-risk tobacco product into Japan. The effect of differing assumptions, and some comparisons with the U.S. |
| DOI: 10.1016/j.yrtph.2018.10.010 |
| Disease incidence and prevalence |
| Global, regional, and national incidence, prevalence, and years lived with disability for 354 diseases and injuries for 195 countries and territories, 1990–2017: A systematic analysis for the Global Burden of Disease Study 2017, Appendix 2 |
| DOI: 10.1016/S0140-6736(18)32279-7 |
| Smoker disease relative risks |
| Global Burden of Disease Study 2019 (GBD 2019) Relative Risks |
| http://ghdx.healthdata.org/record/ihme-data/gbd-2019-relative-risks |
| THP risk ratio to smoking |
| Committees on Toxicity of Chemicals in Food, Consumer Products and the Environment (COT, COC and COM) |
| Statement on the toxicological evaluation of novel heat-not-burn tobacco products, 2017 |
| https://cot.food.gov.uk/sites/default/files/heat_not_burn_tobacco_statement.pdf |
Population demographics_ Model projections for the Japan population and mortality rate from 2010 to 2100_
| Demographic projections | Population (millions) in year | |||||||||
|---|---|---|---|---|---|---|---|---|---|---|
| Population goups | 2010 | 2020 | 2030 | 2040 | 2050 | 2060 | 2070 | 2080 | 2090 | 2100 |
| Total | 128 | 125 | 119 | 110 | 101 | 92 | 83 | 76 | 70 | 66 |
| 65+ | 29 | 36 | 36 | 37 | 37 | 34 | 30 | 27 | 25 | 23 |
| 16–65 | 81 | 74 | 69 | 60 | 53 | 48 | 44 | 39 | 36 | 34 |
| Under 16 | 17 | 15 | 13 | 12 | 11 | 10 | 9 | 9 | 8 | 8 |
| Mortality (millions/year) | 1 | 1 | 1 | 1 | 1 | 1 | 1 | 1 | 1 | 1 |