In the year 2000, ninety thousand (17%) of male deaths and twenty-four thousand (5%) of female deaths in Japan were attributable to smoking (1). In June 2004 Japan signed up to the WHO Framework Convention on Tobacco Control (FCTC) (2). Subsequent tobacco control policies have been introduced, including package health warning (2003), advertising and promotion prohibitions (2004) and public and workplace bans (2010) (3) each contributing to falls in smoking rates. Since 2004 adult smoking prevalence rates have fallen from 26.4% to 16.7% in 2019 which is still around 20 million adult smokers according to Japan’s National Health and Nutrition Survey (NHNS) (4).
The adult population can be split into three groups or stocks: never, current, and former smokers. In theory, the method to reduce the number of current smokers is simple in concept and can be achieved by a combination of:
- (i)
reducing the rate people start to smoke (the inflow) and
- (ii)
accelerating the rate people stop smoking (the outflow) as illustrated in the following stock and flow diagram (Figure 1).

Smoking prevalence.
Smoking prevalence can be defined as the proportion of current smokers in the population, while lifetime smoking prevalence would be the proportion of both current and former smokers.
Lifetime smoking prevalence among adults in Japan has declined over recent decades. According to results from The National Health and Wellness Survey, in 2008 nearly half of all adults (49.1%) had smoked at some point in their life but this had fallen to 38.9% by 2017 (5). The reduction in lifetime smoking indicates that fewer people are starting to smoke.
With the inflow of new smokers reducing, smoking prevalence will continue to fall, especially if the rate at which people quit smoking remains constant or increases. Whilst over the 2008 to 2017 period, lifetime smoking prevalence fell on average annually by 2.0% in males and 3.5% in females, the corresponding falls in current smoking prevalence were 2.6% and 4.8%, on average each year, indicating that the length of time spent as a smoker is also shortening. This may be due in part to the onset of serious health issues, the fear of future adverse health effects, the impact of tobacco control measures such as taxation and restrictions on use.
To further accelerate the decline in the number of people smoking, the outflow (rate at which smokers quit) needs to increase too. In an ideal world all smokers would quit, but in real life some people will continue to smoke (6). In addition to smokers’ use of nicotine, smoking can be particularly pleasurable in familiar settings such as social drinking or post meals. In Japan, smokers attempt to quit smoking at a lower rate than smokers in many other developed nations, with only 23% of adult smokers attempting to quit in 2010, and only 13.5% of those achieving abstinence of six months or more (7). The WHO FCTC defines “tobacco control” as a range of supply, demand and harm reduction strategies that aim to improve the health of a population by eliminating or reducing their consumption of tobacco products and exposure to tobacco smoke (2, Article 1 d). Harm reduction strategies are designed to help existing smokers who would not otherwise stop smoking to move to a less harmful alternative instead of continuing to smoke. Public health would be maximized if such switching were a stepping stone on the route to complete cessation of tobacco use. For a harm reduction approach to work effectively, the lower risk alternative products must be attractive for existing smokers who would not otherwise quit, whilst at the same time not encouraging non-smokers to adopt the product.
To analyse population health effects of a candidate alternative nicotine product, it is important to consider not only the reduction in health risk for smokers who switch to the product instead of continuing to smoke, but also the product’s effects and rate of uptake among non-smokers. If all smokers switched to a product that was half as harmful as cigarette smoking but there were twice as many non-smokers who took up the product, then no net population health gain would be achieved. Additionally, it is not just the number of product users that determines the level of resulting population harm but also the duration and intensity of use.
There are currently several main categories of alternative nicotine products with reduced risk potential (RRPs) available globally, oral tobacco and nicotine products, e-cigarettes, and tobacco heated products (THPs). Nicotine-containing e-cigarettes were banned in Japan in 2010 (8) but THPs were launched in the marketplace in 2014 (9). In 2019, the NHNS survey estimated that of all nicotine product users in Japan, 72% were solus cigarette smokers, 20.3% were solus THP users, 6.4% were dual users (THP and cigarettes) and only 1.3% used another form of nicotine delivery.
Although harm reduction approaches have been widely used globally to tackle issues such as drug abuse (10), a tobacco harm reduction approach for cigarette smoking has attracted a wide range of opponents (11). Also, due to their relatively recent introduction, there is no available evidence yet to indicate whether their use is associated with adverse long-term health impacts (12).
In this simulation model study, we project likely population health outcomes from three main scenarios in Japan, where THPs are the dominant RRP in the market. The first reflects projections if THPs were not available (Smoking Only), the second where they are available (Harm Reduction) and the third, for comparative purposes, if all smoking stopped completely (Complete Abstinence). Most population health models projecting the impact of RRPs have primarily focussed on potential population harm or benefit using premature mortality rates attributable to cigarette smoking as the key output indicator (13, 14). These models provide premature mortality for ‘all-cause’ or from those diseases which account for a large majority of smoking-related deaths, such as lung cancer, cardiovascular disease (CVD) and chronic obstructive pulmonary disease, (COPD). An additional indicator often reported is the projected number of years of life lost (YLL), capturing the age at which the premature mortality occurred. This study expands on mortality projections to investigate projections of living with disabilities, tobacco-related disease incidence, tobacco use prevalence and tobacco user behaviour, such as average smoker age, the number of years smoked and the age at which individuals ceased smoking.
We have enhanced our RRP2 model to include non-mortality outcomes. The RRP2 model is a two-product tobacco model and has been previously described (15, 16, 17). In brief, a system dynamics approach is used to model tobacco use behaviour, where model sub-populations are based on product use characteristics (never, current and former users) for the two products. The model is initiated in year 2004 with a time step of one year, where demographic changes (e.g. births, deaths and net migration) and transitions between product use statuses are evaluated. The model is run over a pre-determined time period and multiple scenarios (e.g., introduction of a RRP) used to generate projections for outputs such as ‘all-cause’ mortality and product use prevalence.
Projected outputs added to the enhanced model include the Years lived with disability (YLD), Disability-adjusted life years (DALY) and the incidence and prevalence of six leading diseases associated with tobacco use as defined in the Global Burden of Disease Study (18). We also estimate smoker behavioural patterns, such as the average number of years smoked, the current to ever smoker ratio, the annual number of people quitting smoking and the smoking status of THP users. A full description of the enhanced version of the model can be found in Supplementary File 1.
The aggregate time lived with a disability across the six smoking associated diseases is modelled. The disease incidence for never smokers is estimated in the base year only, and age and smoking status are assessed at the start of the year.
is Never smoker is gender (male, female) is age (0, 1, 2, …, 100+) is tobacco use state (NN, NC, NF, …, FF, Table 8)
Disability weights are taken from the Global Burden of Disease (GDB) Study and are factors used to represent the severity of health loss associated with a given health state or disability, where 0 is a full state of health and 1 is death (29). Average duration of disease is approximated using Little’s Law whereby the long-term average number of customers in a stationary system is equal to the long-term average effective arrival rate multiplied by the average time spent in the system. This relationship can be used to approximate disease duration using the current number of cases (disease prevalence) and the number of new cases (disease incidence) as detailed below.
Disease prevalence and incidence data from the GBD study indicate that year on year disease incidence rates have not fluctuated significantly over recent years, thus the RRP2 model can estimate the average time diagnosed with a disease until either successful treatment or death.
The DALY combines into a single indicator the years lived with a disability from the smoking-related diseases model with the life years lost from premature mortality.
is Disability-adjusted life years is Years lived with disability is Life years lost from premature mortality
Using current estimates of disease incidence and the average disease duration, the RRP2 model projects the number of patients diagnosed with the disease. At each time step in the model, the number of diagnosed patients is estimated as the number of diagnosed patients in the previous time step, in addition to any new cases and minus any patients lost due to death or in remission.
is timepoint t (in years) is previous timestep (year) is gender (male, female) is age (0, 1, 2, …, 100 +).
Definitions of key model variables and units.
| Variable | Description | Units |
|---|---|---|
| YLD | Years lived with disability | People years |
| Disability weight | Health loss associated with disease | Factor |
| Disease duration | Average time diagnosed with disease until either successful treatment or death | Years |
| Disease incidence rate | New disease cases in current year | People/year |
| NS Disease incidence probability | Probability a Never Smoker is newly diagnosed with disease | Probability/year |
| HR | Hazard ratio of disease incidence compared to that of a never smoker | Factor |
| Expected incidence rate | New disease cases in base year (2004) | People/year |
| P | Prevalence of the tobacco usage state | Percentage |
Data used in the model are from publicly available sources (Table 2) and tobacco use transitions across two waves of a cross-sectional survey to assess tobacco and nicotine product use since the 2014 introduction of THPs in Japan (19).
Data sources.
| Data sources |
|---|
| Japan´s population |
| Ministry of Internal Affairs and Communications, Census Division, Statistics Bureau |
| Population estimation (2004) |
| https://www.e-stat.go.jp/stat-search/file-download?statInfId=000000090235&fileKind=0 |
| Birth rate |
| National Institute of Population and Social Security Research |
| Population Projections for Japan (2017): 2016 to 2065, Appendix: Auxiliary Projections 2066 to 2115 (Table 5 and Reference Table 5) |
| http://www.ipss.go.jp/pp-newest/e/ppfj02/top.html |
| Mortality rates |
| The Global Burden of Disease Study |
| Supplementary appendix: Fertility, mortality, migration, and population scenarios for 195 countries and territories from 2017 to 2100: A forecasting analysis for the Global Burden of Disease Study, Lancet 2020 (Supplementary appendix 2, Table 15, Japan 2017 life table) |
| https://www.thelancet.com/journals/lancet/article/PIIS0140-6736(20)30677-2/fulltext#supplementaryMaterial |
| Life expectancy |
| The Global Burden of Disease Study |
| Supplementary appendix: Fertility, mortality, migration, and population scenarios for 195 countries and territories from 2017 to 2100: A forecasting analysis for the Global Burden of Disease Study, Lancet 2020 (Supplementary appendix 2,Table 15, Japan 2017 life table) |
| https://www.thelancet.com/journals/lancet/article/PIIS0140-6736(20)30677-2/fulltext#supplementaryMaterial |
| Net migration |
| National Institute of Population and Social Security Research |
| Population Projections for Japan (2017): 2016 to 2065, Appendix: Auxiliary Projections 2066 to 2115 (Figures 9 and 10) |
| http://www.ipss.go.jp/pp-newest/e/ppfj02/top.html |
| Smoking prevalence |
| National Health and Nutrition Survey |
| Part 4: Results of lifestyle-related survey |
| https://www.mhlw.go.jp/english/ |
| Former Smoker Quit Time |
| Estimating the population health impact of introducing a reduced-risk tobacco product into Japan, The effect of differing assumptions, and some comparisons with the U.S. |
| DOI: 10.1016/j.yrtph.2018.10.010 |
| Smoking initiation |
| National Health and Nutrition Survey (2003–2012) |
| https://www.mhlw.go.jp/bunya/kenkou/kenkou_eiyou_chousa.html |
| Smoker relapse |
| Web-based survey on smoking cessation behaviors of current and former smokers in Japan |
| DOI: 10.1185/03007995.2014.938149 |
| Smoking relative risks |
| Population attributable numbers and fractions of deaths due to smoking: A pooled analysis of 180,000 Japanese, Preventive Medicine Volume 52, Issue 1, January 2011, Pages 60–65 |
| DOI: 10.1016/j.ypmed.2010.11.009 |
| Former smoker risk decay |
| Estimating the population health impact of introducing a reduced-risk tobacco product into Japan. The effect of differing assumptions, and some comparisons with the U.S. |
| DOI: 10.1016/j.yrtph.2018.10.010 |
| Disease incidence and prevalence |
| Global, regional, and national incidence, prevalence, and years lived with disability for 354 diseases and injuries for 195 countries and territories, 1990–2017: A systematic analysis for the Global Burden of Disease Study 2017, Appendix 2 |
| DOI: 10.1016/S0140-6736(18)32279-7 |
| Smoker disease relative risks |
| Global Burden of Disease Study 2019 (GBD 2019) Relative Risks |
| http://ghdx.healthdata.org/record/ihme-data/gbd-2019-relative-risks |
| THP risk ratio to smoking |
| Committees on Toxicity of Chemicals in Food, Consumer Products and the Environment (COT, COC and COM) |
| Statement on the toxicological evaluation of novel heat-not-burn tobacco products, 2017 |
| https://cot.food.gov.uk/sites/default/files/heat_not_burn_tobacco_statement.pdf |
Nearly all (90%) of smokers in Japan started before the age of 25, with approximately half of men and two-thirds of women first smoking prior to the legal age of 20 years (20, 21).
Lifetime smoking initiation probability.
| Male | Female | |
|---|---|---|
| Lifetime initiation rate (2004) | 58.2% | 23.2% |
| Applied annual initiation decay (2004–2100)a | 3.1% | 2.6% |
Annual initiation decay is the reduction in the lifetime initiation rate applied on an annual basis
Observing the prevalence of “Ever” smoking (current or former smoker) in the 20–29 age cohort provides evidence on the trend in smoking initiation rates. An analysis of the recorded Ever smoking prevalence in NHNS survey data estimate that in 2004, 58.2% of males and 23.2% of females in the 20–29 age cohort had ever smoked. The estimated average annual decline in smoking initiation rates across the period was 3.1% for males and 2.6% for females. In our scenarios, all smoking initiation is assumed to occur at age 20.
Data from two waves (2019, 2020) of a cross-sectional survey of nicotine product use in Japan were used to estimate THP initiation (22, 23, 24). As the survey studied only adults, any THP initiation from never tobacco users prior to age 20 is not captured. To indirectly estimate THP initiation prior to age 20 we used the ever THP prevalence in the 20–24 age cohort and adjusted for initiation rates whilst in that cohort.
Lifetime THP initiation probability.
| THP Initiation | Male | Female |
|---|---|---|
| < Age 20 initiation | 6.2% | 1.2% |
| > Age 20 initiation | 3.5% | 2.5% |
| Lifetime initiation | 9.7% | 3.7% |
In our scenarios, all THP initiation is assumed to occur at age 20.
Quit probabilities were estimated by calibration of the model estimates to the observed smoking prevalence from the NHNS (4) by gender and age cohort over the period 2004–2019. The calibration method applied was to minimize the Mean Absolute Error over Mean (MAEoM) statistic. The calibrated quit probabilities are shown in Table 5.
Smoking cessation probability.
| Age-group | 20–29 | 30–39 | 40–49 | 50–59 | 60–69 | 70–79 | ≥ 80 |
|---|---|---|---|---|---|---|---|
| Male cessationa | 2.2% | 3.6% | 3.9% | 4.6% | 6.9% | 9.2% | 9.1% |
| Female cessationa | 5.4% | 3.0% | 3.1% | 4.6% | 6.2% | 9.9% | 8.5% |
Annual smoking cessation probabilities for males and females by age-group.
These are the probabilities that a smoker reaches 12 months abstinence from smoking, though they may still subsequently resume smoking beyond one year.
Data from the first two waves (2019, 2020) of a cross-sectional survey to assess tobacco and nicotine product use since the introduction of THPs in Japan (22, 23, 24) were combined to generate estimates of the annual transition probabilities between tobacco products or to no tobacco product. The two waves consisted of separate cohorts of participants and combining the two provided a total of 1,937 current tobacco product users, 1,423 males and 514 females. This sample size was not sufficient to determine transition rates by age groups in addition to gender, so we utilize age-adjusted transition probabilities.
For both products, cigarettes and THP, individuals are defined as either never, current, or former users based on the following definitions.
Never: Never tried the product or used less than 100 times in lifetime
Current: Used the product 100+ times and used within last year
Former: Used the product 100+ times but not used within last year
Users were asked about their current tobacco use status and that at 12 months ago. The compiled data were used to generate the transition matrix in Table 6 and Table 7. Data from the cross sectional surveys were weighted to account for oversampling in the 20–29 year-old age groups. The survey also provided prevalence estimates for the nine tobacco use statuses (Table 8).
Transition probabilities (males).
| User status 12 months ago | n | Current user status (%) | |||
|---|---|---|---|---|---|
| Solus smoker | Solus THP | Dual user | No tobacco | ||
| Solus smoker | 1038 | 82.3 (79.4–85) | 1.0 (0.4–2.3) | 7.6 (5.8–9.8) | 9.0 (7.3–11.1) |
| Solus THP | |||||
| Never smoker | 16 | — | 92.1 (67.6–99.6) | 5.5 (0.1–29.2) | 2.3 (0–24.5) |
| Former smoker | 49 | — | 88.4 (75.0–96.1) | 5.3 (0.7–17.3) | 6.3 (1.2–17.7) |
| Dual user | 320 | 7.0 (4.1–11.1) | 32.8 (27.3–38.8) | 58.8 (52.5–64.8) | 1.4 (0.4–3.4) |
Transition probabilities (females).
| User status 12 months ago | n | Current user status (%) | |||
|---|---|---|---|---|---|
| Solus smoker | Solus THP | Dual user | No tobacco | ||
| Solus smoker | 392 | 81.4 (76.7–85.5) | 1.5 (0.4–3.5) | 7.0 (4.5–10.3) | 10.1 (7.0–14.0) |
| Solus THP | |||||
| Never smoker | 8 | — | 82.7 (42.3–98.9) | — | 17.3 (1.1–58.7) |
| Former smoker | 29 | — | 91.1 (74.5–98.4) | — | 8.9 (1.6–25.5) |
| Dual user | 85 | 6.6 (1.9–15.7) | 39.3 (28.0–51.5) | 50.8 (38.8–62.8) | 3.2 (0.5–10.2) |
Adult tobacco use prevalence. Japan adult population tobacco use prevalence by smoking and THP use status.
| Japan adult population tobacco use prevalence (2019–2020) | |||||||||
|---|---|---|---|---|---|---|---|---|---|
| Smoking status | Never | Current | Former | Never | Current | Former | Never | Current | Former |
| THP status | Never | Never | Never | Current | Current | Current | Former | Former | Former |
| NN | CN | FN | NC | CC | FC | NF | CF | FF | |
| All | 64.8% | 11.4% | 17.1% | 0.3% | 3.5% | 2.2% | 0.0% | 0.4% | 0.3% |
| Male | 44.1% | 17.7% | 27.6% | 0.3% | 5.9% | 3.4% | 0.0% | 0.6% | 0.4% |
| Female | 84.1% | 5.6% | 7.4% | 0.2% | 1.2% | 1.1% | 0.0% | 0.1% | 0.1% |
The overall adult current smoking prevalence was 15.3% (males 24.3%, females 7.0%) and current THP use prevalence was 6.0% of adults (males 9.6%, females 2.6%). Lifetime smoking prevalence was 34.9% (male 55.6%, female 15.6%) and lifetime THP use was 6.6% of adults (male 10.7%, female 2.9%).
A similar population-based survey of tobacco use in Japan conducted in 2018 (25) estimated the age-adjusted THP prevalence as 5.0% (males 8.3%, females 1.95%). For lifetime THP use, the survey estimated 8.7% of adults (males 14.1%, females 3.7%).
The alternative population survey estimates of THP prevalence, both current use and lifetime use, were slightly higher than the survey data we utilised. One reason could be the definition of current user, where the alternative scenario included anyone who had used in the past 30 days, even if only once.
The model enhancement to project non-mortality indicators of population health impacts has required extra input data for the RRP2 model for the incidence, prevalence, and smokers’ excess risk of six tobacco-associated diseases (Table 9).
Smoking-related diseases in model.
| Smoking-related diseases |
|---|
| Ischemic heart disease |
| Stroke |
| Tracheal bronchus and lung cancer |
| Chronic obstructive pulmonary disease (COPD) |
| Esophageal cancer |
| Lower extremity peripheral arterial disease |
The first four diseases are those most traditionally associated with smoking. The last two diseases were chosen as representatives for diseases less customarily linked to smoking. These data have been drawn from the Global Burden of Disease study via the data portal hosted by Institute for Health Metrics and Evaluation (IHME) (26) at the University of Washington. For the RRP2 model, the data are used under a commercial licence, but the same data are freely available under a Creative Commons licence. The incidence, prevalence and smoking risk factor data used by the RRP2 model for these diseases are provided in Supplementary File 2.
As with all simulation models some assumptions and simplifications are used within the model to simplify the complex behaviour of tobacco product use and the health risks they pose.
THP relative risks (All-cause mortality) (1)
- -
THP excess risk is 10% of that compared to cigarettes. (27)
- -
Dual user excess risk is the maximum of that from cigarette or THP current or past use.
- -
Former user relative risk (All-cause mortality)
- -
A negative exponential distribution is used to estimate former smoker excess risk based on the number of years since quitting and current smoker excess risk (Supplementary File 1).
- -
THP former user relative risk is expressed as a ratio of former smoker excess risk for the same time since quitting.
- -
THP risk ratio for diseases
- -
The all-cause mortality THP risk ratio applies at the same level to each of the smoking-related diseases modelled.
- -
-
- -
50% of those who initiate THP would have initiated smoking had the THP not been available.
- -
-
- -
10% of smokers who switch to THP or dual use would have quit smoking completely in the next 12 months had the THP not been available.
- -
Tobacco product resumption
- -
No health benefit for short term smoking cessation.
- -
Resumption probabilities are based on time since quit and are gender and age independent.
- -
Cigarette consumption
- -
Assumed to be 20 cigarettes per day across all ages, genders, and active smoking statuses.
- -
-
- -
Lifetime initiation rates assumed constant over projection period.
- -
Years Smoked
- -
All smoking initiation is assumed at age 20 years.
- -
Three scenarios were compared.
| Smoking Only: | Where cigarettes are the only tobacco product available. |
| Harm Reduction: | Where THPs are introduced to the market in 2014. |
| Complete Abstinence: | Where all tobacco product use ceases in 2014. |
To test the Harm Reduction scenario sensitivity to some of the input assumptions, additional variants of the Harm Reduction scenarios were performed, where:
- a)
The risk ratio of THP compared to smoking was varied between 0% and 100%
- b)
The dual user risk tapered between the maximum of the two product excess risks to the sum of the product excess risks.
All scenarios commence in 2004 and project to 2100. Reevaluations on the population health are made on an annual basis. The near 100-year time horizon is required due to the health impact of tobacco use in older age, even if an individual quit tobacco products many years before.
Prior to comparing scenarios, the RRP2 model’s projection results of Japan’s demographics were assessed for realism by comparing them to independent projections. The data in Table 10 provides the RRP2 model demographic projections and the graphs in Figure 2, Figure 3 and Figure 4 compare these projections against those published by United Nations projections for Japan (28). The RRP2 demographic projections were within the 95% prediction interval of those from the United Nations.
Population demographics. Model projections for the Japan population and mortality rate from 2010 to 2100.
| Demographic projections | Population (millions) in year | |||||||||
|---|---|---|---|---|---|---|---|---|---|---|
| Population goups | 2010 | 2020 | 2030 | 2040 | 2050 | 2060 | 2070 | 2080 | 2090 | 2100 |
| Total | 128 | 125 | 119 | 110 | 101 | 92 | 83 | 76 | 70 | 66 |
| 65+ | 29 | 36 | 36 | 37 | 37 | 34 | 30 | 27 | 25 | 23 |
| 16–65 | 81 | 74 | 69 | 60 | 53 | 48 | 44 | 39 | 36 | 34 |
| Under 16 | 17 | 15 | 13 | 12 | 11 | 10 | 9 | 9 | 8 | 8 |
| Mortality (millions/year) | 1 | 1 | 1 | 1 | 1 | 1 | 1 | 1 | 1 | 1 |

Projected population.

Projected population by age group.
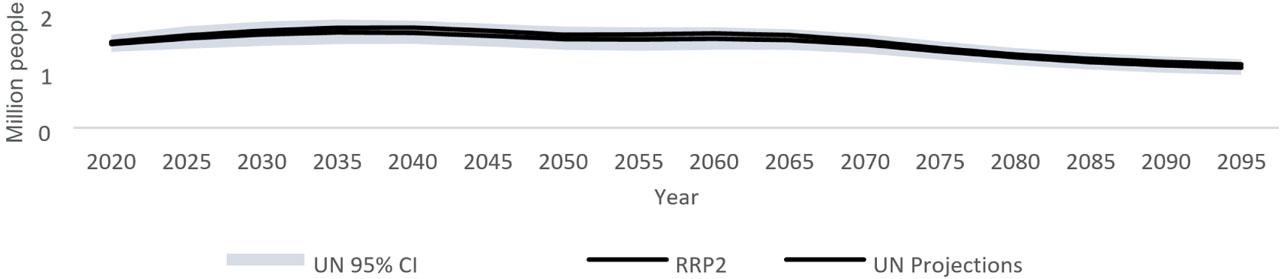
Projected annual mortality rate.
Detailed tabular results are provided in Supplementary File 3. The number of cigarette smokers is projected to fall in all three scenarios (Figure 5). By 2030, there are still 12 million (12.0%) adult smokers in the Smoking Only scenario compared to 6.2 million (6.2%) in the Harm Reduction scenario. The number of adult smokers does not fall below one million until 2092 in the Smoking Only scenario, some 32 years after that in the Harm Reduction scenario.
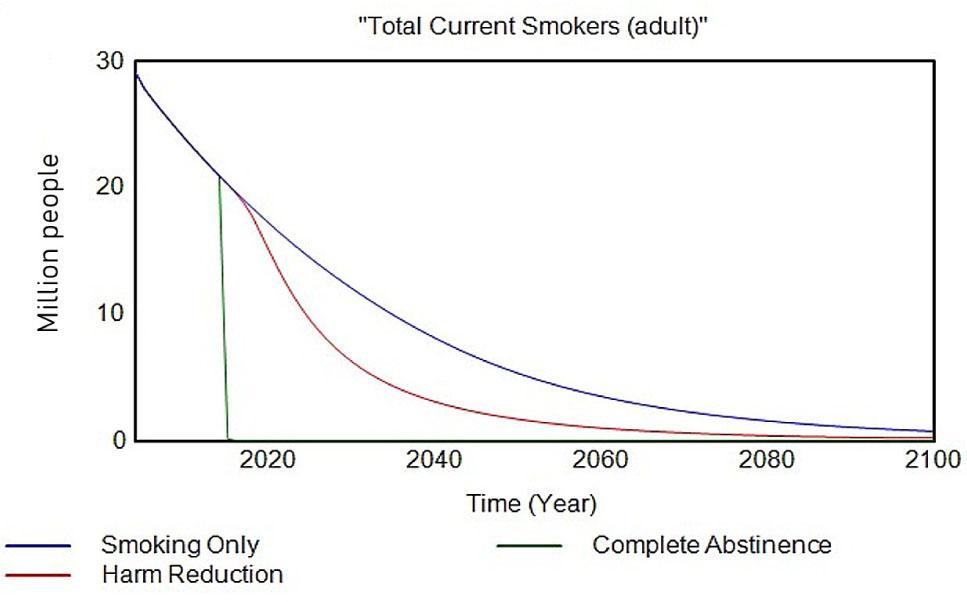
Adult current smokers.
By the end of the projection period there are a negligible number of smokers in any of the three scenarios.
Comparing use of any tobacco product (Figure 6) reveals a different picture. The total number of adult tobacco product users in the Harm Reduction scenario exceeds that in the Smoking Only scenario in all years after the date the THP was introduced. By 2100 there would still be 1.1 million adults using tobacco products, compared to just 733,000 in the Smoking Only scenario.
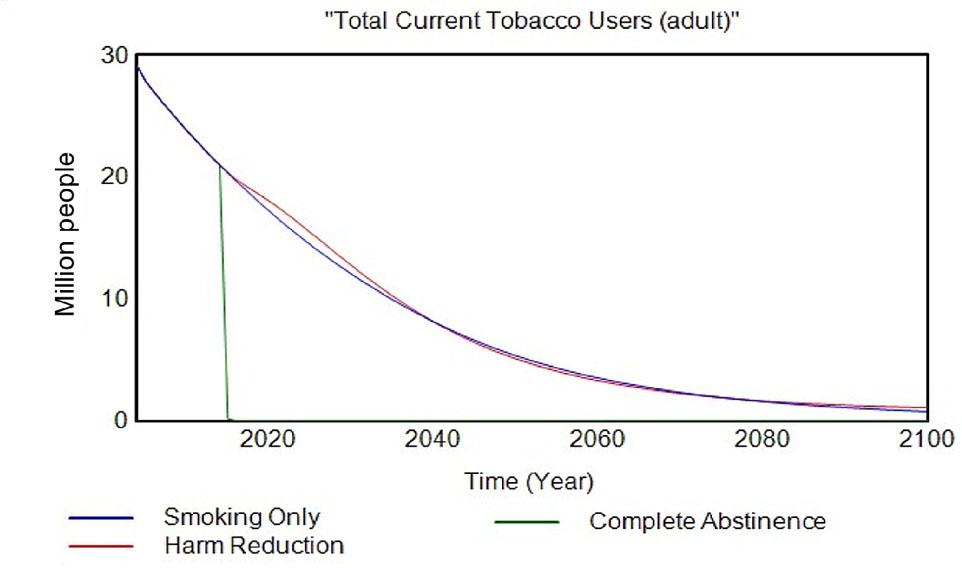
Adults using tobacco products.
The number of adults that have ever smoked was similar in both the Smoking Only and Harm Reduction scenarios (Figure 7), with the number slightly higher in the Harm Reduction scenario.

Adult ever smokers.
As the number of adult ever smokers is similar, but the number of current adult smokers is lower in the Harm Reduction scenario compared to Smoking Only, it indicates a smoking habit is sustained for a shorter period. This is supported by the comparison of the average age at which adults quit smoking (Figure 8).

Average age at quitting smoking.
From 2030 onwards, the average age at quitting smoking was at least 7 years earlier for the Harm Reduction scenario. The reduction in the number of smokers is reflected in the consumption of cigarettes, where across 2004–2100 nearly 2.5 trillion fewer cigarettes were consumed in the Harm Reduction scenario (Figure 9).

Cumulative cigarette consumption
The projected number of THP users will peak around 2030 at just over 8.3 million, around 8.2% of the adult population. After 2030, THP users gradually decline to one million by 2100. Figure 10 shows that most of the early adopters of THPs were cigarette smokers. After many of the smokers had switched completely to THPs, former smokers became the dominant smoking status of THP users. By 2100, 45.5% of THP users had never smoked, 43.1% used to smoke 11.4% still smoked.

Smoking status of THP users.
Within each smoking status, the projected use of THP behaviour is shown in Figure 11.
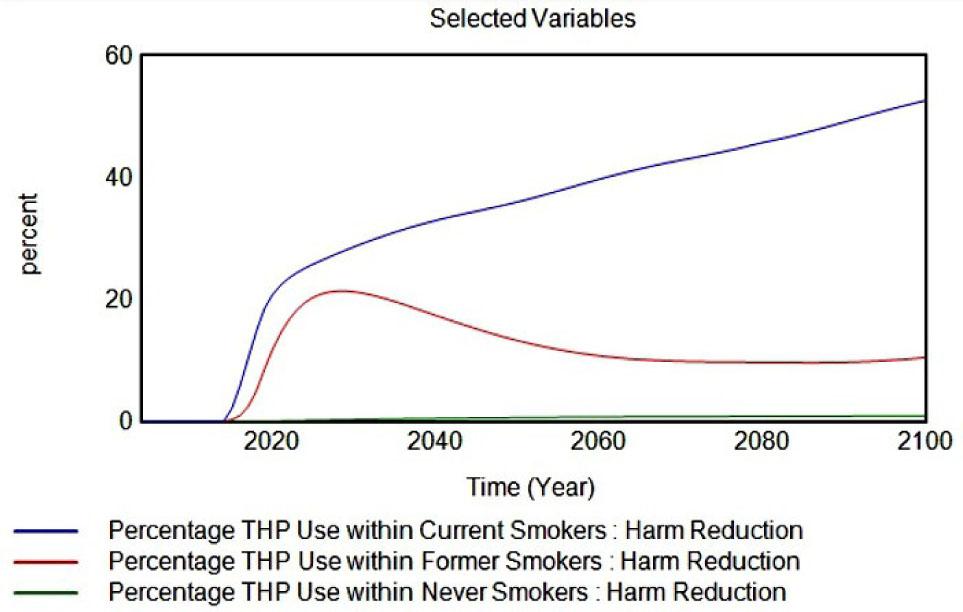
THP use within smoking status.
By 2100, half of any remaining cigarette smokers also use a THP. THP use within former smokers peaks at 20% around 2028, then declines to 10% from 2060 onwards. The prevalence of THP use within never smokers does not ever exceed 1%. Dual use of tobacco products peaks at 3.1 million adults (3.0%) around 2020.
Comparing premature mortality (Figure 12) even in the Complete Abstinence scenario, deaths associated with tobacco use will still occur right up to 2100. The decline in smoking attributable mortality is steepest in the Complete Abstinence scenario as would be expected, falling from nearly 100,000 deaths per years in 2014 to near zero by 2100.
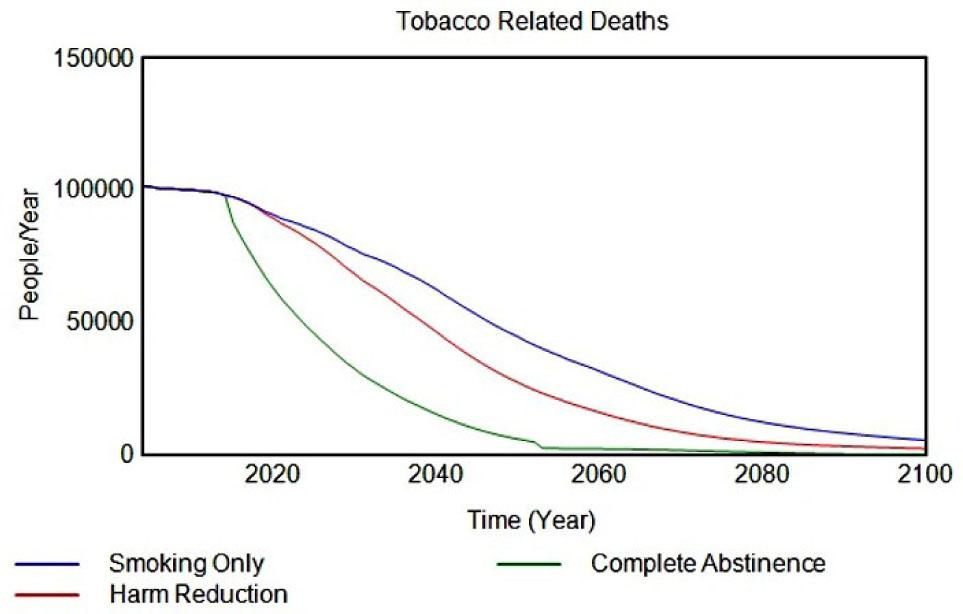
Tobacco-related deaths.
The decline in smoking-related deaths is faster in the Harm Reduction scenario, but by 2100 the decline has plateaued and is beginning to converge with the Smoking Only scenario mortality rate. Over the period 2004–2100 however, there are 850,000 fewer premature deaths than in the Smoking Only scenario. For comparison, over the same period in the Complete Abstinence scenario, there were 2.3 million fewer premature deaths.
The difference between attributable mortality amongst the three scenarios is indicated by the years of life lost statistic (YLL) (Figure 13).

Years of life lost.
Compared to the Smoking Only scenario, 13.3 million fewer life years would be lost in the Harm Reduction scenario and 34.5 million saved if everyone were to cease tobacco product use in 2014.
Figure 14 contrasts the number of years lived with a disability and lower quality of life from the six tobacco associated diseases modelled.

Years lost due to a disability.
Individuals diagnosed with each disease are allocated a disability weight which reflects the loss of quality of life with each disease. The profile is similar across the three scenarios from 2080 onwards. Prior to then a greater number of years lived with a disability was observed in the Smoking Only scenario, followed by the Harm Reduction scenario and the best of all three was the Complete Abstinence scenario. Accumulating the years lived with a disability over 2004 to 2100 produced a total of 25.2 million, 24.3 million and 22.9 million from the Smoking Only, Harm Reduction and Complete Abstinence scenarios, respectively.
The projected disability-adjusted life year (DALY) statistic (Figure 15), which is a combined measure of tobacco disease burden, merging the number of years lost due to disability or premature death displays a similar picture as that for YLD.

Disability-adjusted life years (DALY).
Cumulatively across the period, the Smoking Only scenario totalled 99.3 million years, Harm Reduction scenario 85.1 million years and the Complete Abstinence scenario 62.6 million years.
Figure 16 shows the cumulative cases for each of the six specific diseases, expressed as a percentage reduction compared to the projected Smoking Only scenario.

Disease cases.
The greatest fall was seen in lung cancer cases, the major disease most linked to smoking, where complete abstinence would achieve a 22.6% reduction and the Harm Reduction scenario a 7.9% reduction.
The number of people diagnosed with a smoking-related disease is lower across each of the diseases modelled for the Harm Reduction scenario, but still greater than in the Complete Abstinence scenario, with the greatest reductions seen in lung cancer and COPD (Figures 17–19).

Tracheal bronchus and lung cancer patients.
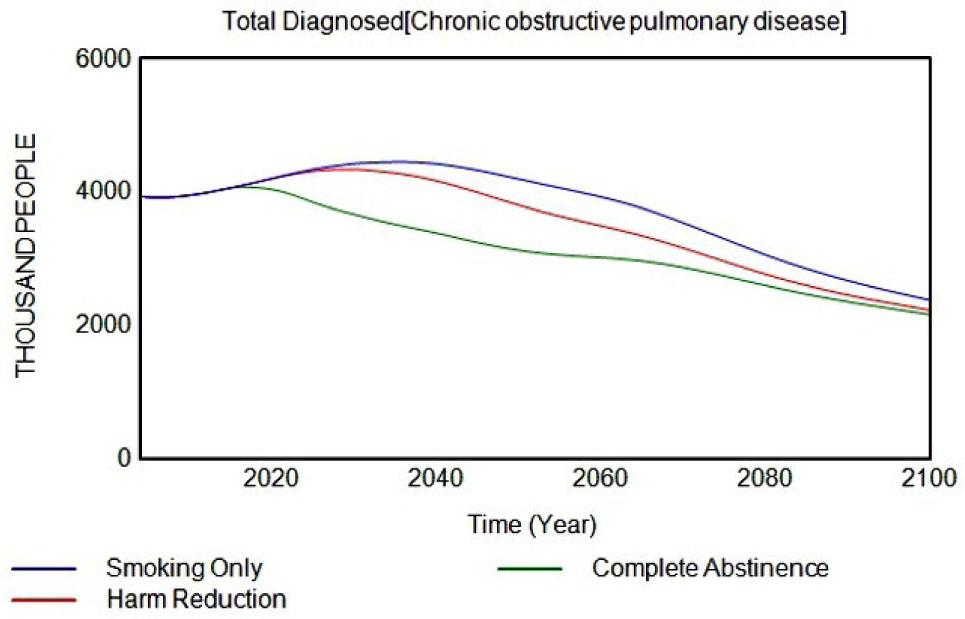
Chronic obstructive pulmonary disease patients.
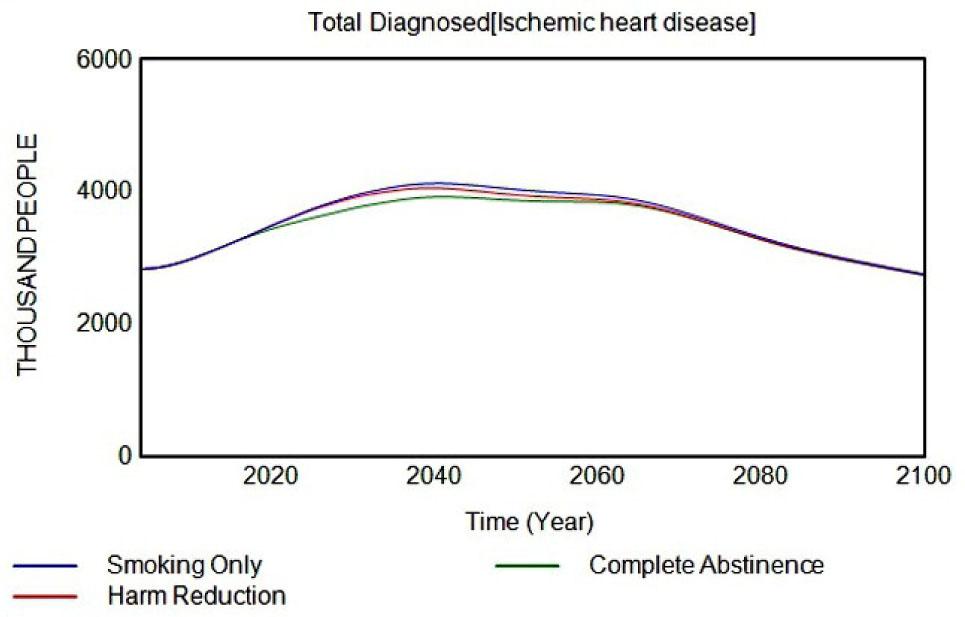
Heart disease patients.
Full details and outputs for sensitivity and scenario variants are contained in Supplementary File 4. Product transition sensitivity outputs are available for several endpoints and multiple THP relative risk scenarios have been investigated, thus results are too substantial to report in the main paper.
Model outputs were compared to observed data or alternative source projections for each of the key output indicators to check the RRP2 projections were consistent. In the majority of cases the projected data follows a similar trend to and are in line with verification data. For the full comparison, see Supplementary File 5.
Most population health models projecting the impact of introducing RRPs as alternatives to cigarettes have primarily focussed on potential population harm or benefit using premature mortality rates attributable to cigarette smoking as the key output indicator (13, 14). These models provide premature mortality rates for ‘all cause’ or from those diseases which account for a large majority of smoking-related deaths, such as lung cancer, cardiovascular disease (CVD) and chronic obstructive pulmonary disease, (COPD). An additional indicator often reported is the projected number years of life lost (YLL), depending on the ages at which the premature mortality occurred.
In this study we have ventured beyond mortality projections to investigate projections of living with disabilities, tobacco-related disease incidence, tobacco use prevalence and tobacco user behaviour, such as average smoker age, the number of years smoked and the age at which individuals ceased smoking.
The projected number of smoking-related deaths over the period 2004–2100 in the Harm Reduction scenario was reduced to 3.8 million, down 18.3% from the total in the Smoking Only scenario (4.65 million). To place the drop into perspective, if all tobacco product use ceased from 2014 onwards, a 49% drop in tobacco-related deaths was projected. The focus of this study was to move beyond mortality indicators to project non-mortality indicators. Projected outputs added include smoker behavioural patterns, the number of years lived with disability (YLD), disability-adjusted life years (DALY) and the incidence and prevalence of diseases associated with tobacco use as defined in the Global Burden of Disease Study (18).
With the introduction of THPs, by 2050 the average age of current smokers had fallen to 46 years, compared to 51.2 years in the Smoking Only scenario. This was reflected in the average number of years smoked in current smokers, which by 2050 had fallen by five years from 32.7 years to 27.5 years.
Although the average length of time spent smoking was shorter in the Harm Reduction scenario, a greater number of people had smoked at some point during their lives. The peak in this extra number of Ever-Smokers occurred around 2060, where 900,000 more people had smoked compared to the Smoking Only scenario. As we assumed only 50% of those that initiate THP would have smoked had the THP not been available, this would mean the overall rate of tobacco product initiation would be greater in the Harm Reduction scenario. As a proportion of those who initiate a THP as their first tobacco product would later transfer to smoking, a greater number of Ever-Smokers would be expected.
The RRP2 model projects that the number of THP users will peak around 2030 at 8.3 million and then start to fall year on year. By 2100, there would only be one million THP users. In 2030, 2.1% of THP users had never smoked, compared to 76.4% which had previously smoked. The transition from smoking to THP would result in a peak of THP use, as fewer smokers remain to transition to THP. By 2100, of the one million THP users, 45.5% had never smoked and 43.1% used to smoke and 11.4% were still smoking. Dual use prevalence reached 3% of the adult population in 2020 but fell in all subsequent years. Dual use appears to be a transitionary phase, as smokers adapt to complete switching to THPs. Data from the first two waves (2019, 2020) of a cross-sectional survey estimated that around a third of dual users (33% males, 39% females) transitioned to solus THP use each year, whilst around 7% (7% males, 6.6% females) transitioned to solus smoking (22, 23, 24). Incorporating the transitioning to no tobacco use would indicate that only 50% of current dual users would still be a dual user in the following year.
Over the period 2004–2100, the cumulative number of person-years lived with a disability from one of the six smoking-related diseases modelled (Table 8) fell from 25.2 million in the Smoking Only scenario to 24.3 million in the Harm Reduction scenario, a fall of 3.5%. The health risks from smoking do not disappear the day someone stops smoking. The duration of smoking, cumulative number of cigarettes smoked, and the elapsed time since quitting will influence the residual excess risk levels. In the Complete Abstinence scenario an 9.0% drop was projected in years lived with a disability.
In each of the six smoking associated diseases modelled, the annual disease incidence rate was lower in the ‘Harm Reduction’ scenario than the Smoking Only scenario, but higher than in the Complete Abstinence scenario. The cumulative reduction in incidence over the 2004–2100 period varied considerably by disease. Lung cancer showed the biggest fall at 7.9%, followed by COPD at 6.7% and esophageal cancer at 5.2%. The fall in disease cases for ischemic heart disease, stroke and lower extremity peripheral arterial disease were 1.0%, 0.9% and 2.6%, respectively.
A limitation of this study is the use of a one-year time interval and the definition of a former user having a minimum of 12 months abstinence. This will overestimate the transition rates from a solus product to dual use at the expense of a direct switch from one product to another.
Although the cross-sectional surveys provided a total sample size of 10,596 people, nearly two thirds of those sampled (64.7%) had never smoked cigarettes or used a THP. Only 4% of the sample were current THPs users and 4.3% ever users of THPs.
With the small sample of THP users, only age-adjusted transitions could be estimated, whereas it seems likely to assume that the age of an individual would be a significant component in the transition probabilities, with younger people more likely to switch to alternative products than older individuals.
The model utilises publicly available projections for population statistics to allow modelling into future years. However, these projections will not account for any unforeseen events or changes that may have an impact on population characteristics and subsequent health outcome estimates.
We estimate through the above model that by the year 2100 the introduction of THPs into the Japanese marketplace will reduce future smoking prevalence, reduce the number of smoking-related premature deaths by 850,000 people and also reduce the burden of smoking-related disabilities by 880 thousand person-years, compared to a scenario where THPs had not been introduced. The Harm Reduction scenario projected that 14.2 million fewer disability life-years would be incurred compared to the Smoking Only scenario. The diseases with the highest reductions were lung cancer and COPD, the two major diseases most highly associated with smoking. We estimate that by 2100, the introduction of THPs will reduce the number of cases of lung cancer by 575,000 and COPD by 1,972,000. The scenarios projected by the RRP2 model indicate there will be significant benefits, not only premature lives lost, but also in the burden of disease borne by individuals.
However, although product transition probabilities were estimated from a total sample size of over 10,000 people, only one-third had ever used a tobacco product, and less than 500 of the people sampled had ever used THPs. These smaller sample sizes precluded estimating the age component effect on product transitions and in some instances resulted in large confidence intervals.
To address these sensitivity issues, we next plan to target our sampling on a population subset at higher risk of developing smoking-related diseases than the rest of the study population, that is, current or recent former tobacco users aged over 35. In addition, the focus will be on the disease stage progression of lung cancer and COPD.
This study demonstrates the capability of population modelling to investigate health impacts beyond all-cause mortality. The resulting model allows estimates of the harm reduction potential of THPs, considering projections of living with disabilities, impact on tobacco-related disease incidence and tobacco user behaviour in addition to mortality projections.
These assumptions are tested in the variant scenarios (Supplementary File 4).