
Table 1
The main blend components of the tobacco plug on each rod.
| Components | Nicotine | Propylene glycol | Glycerol | H2O | Tobacco plug |
|---|---|---|---|---|---|
| Weight (mg/plug) | 3.79 ± 0.22 | 4.77 ± 0.12 | 13.79 ± 0.25 | 35.23 ± 1.75 | 179.40 ± 3.73 |
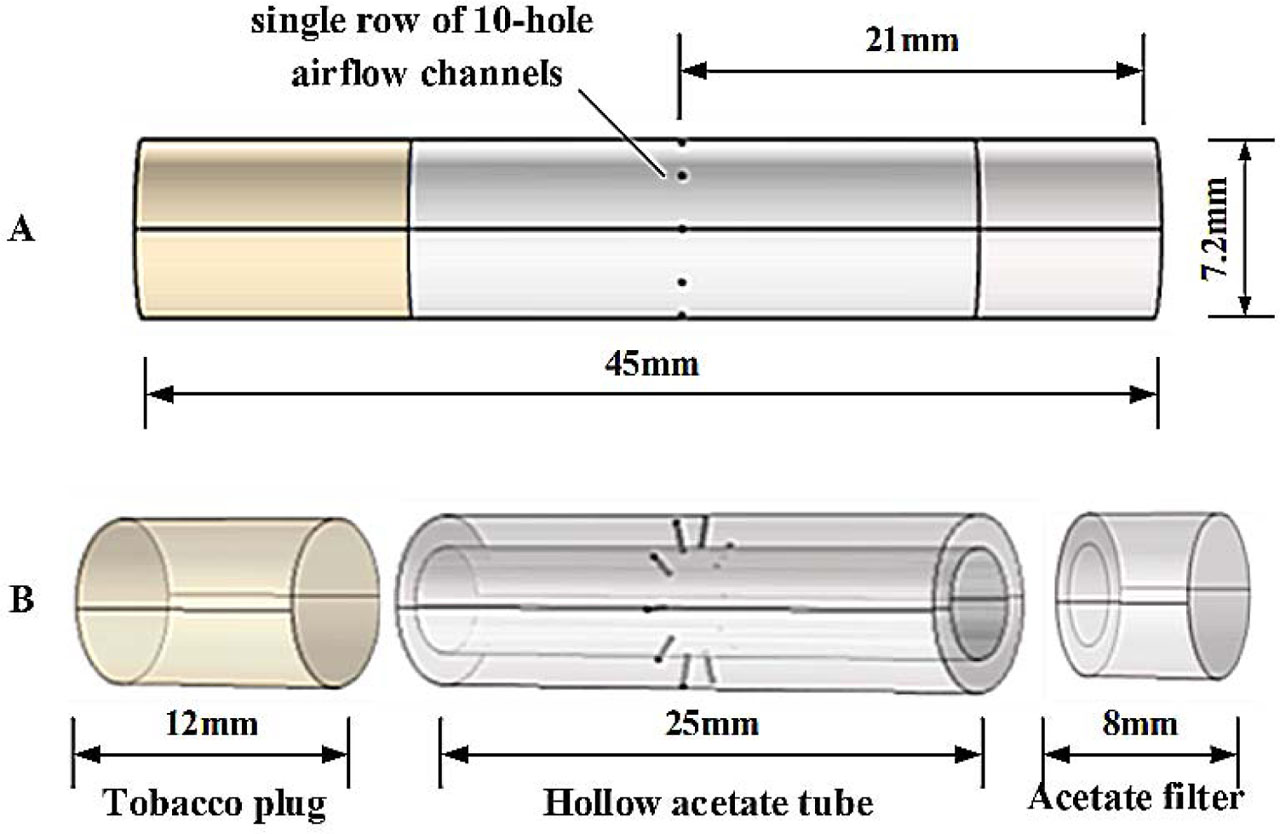
Figure 1
Schematic diagram of the tobacco rod structure for HNB and NSC: the NSC structure is shown with the ventilation holes. HNB is identical but without the ventilation holes.
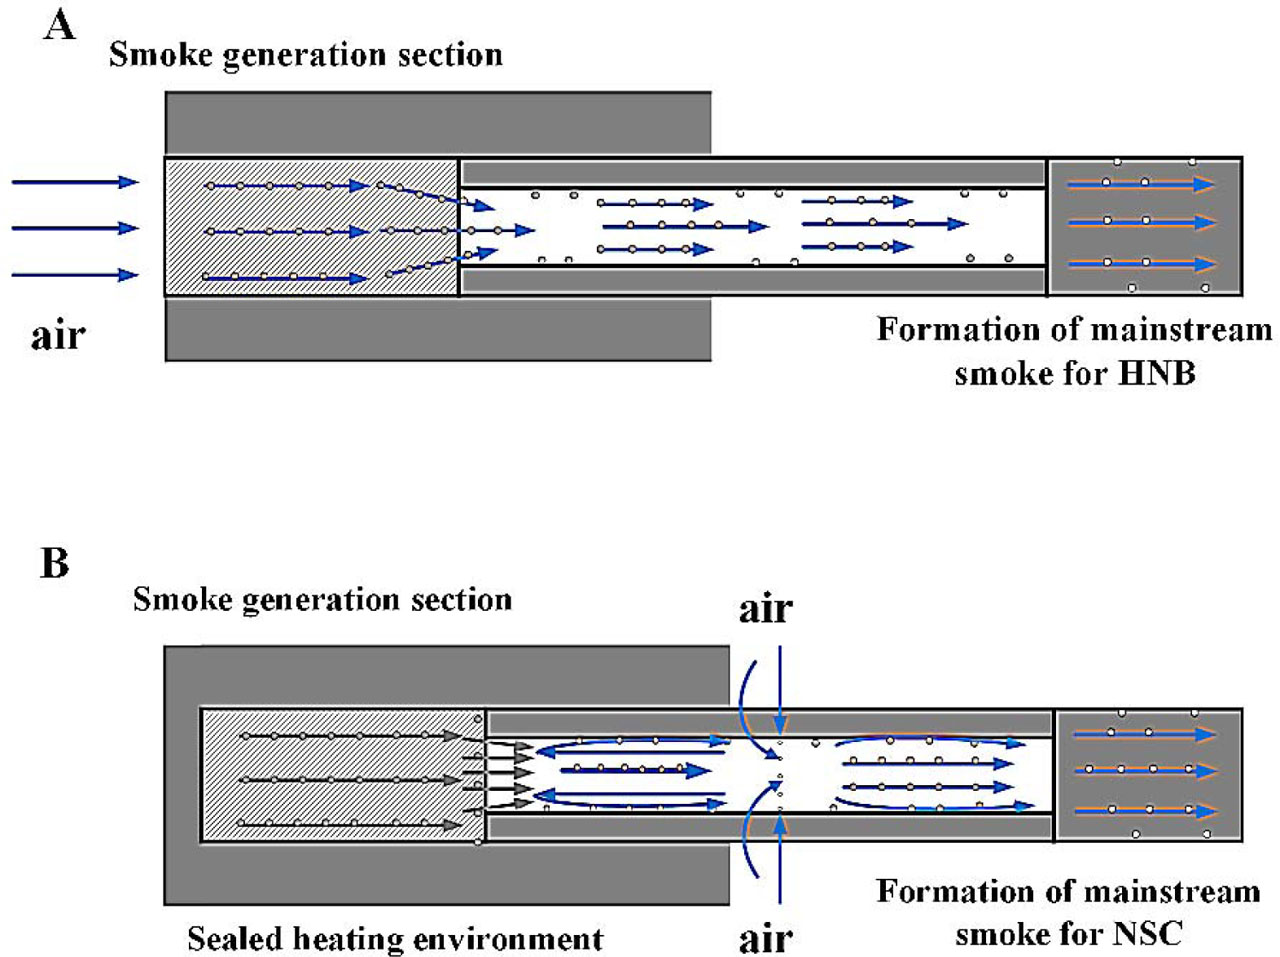
Figure 2
Airflow pathways of HNB (A) and NSC (B) systems.
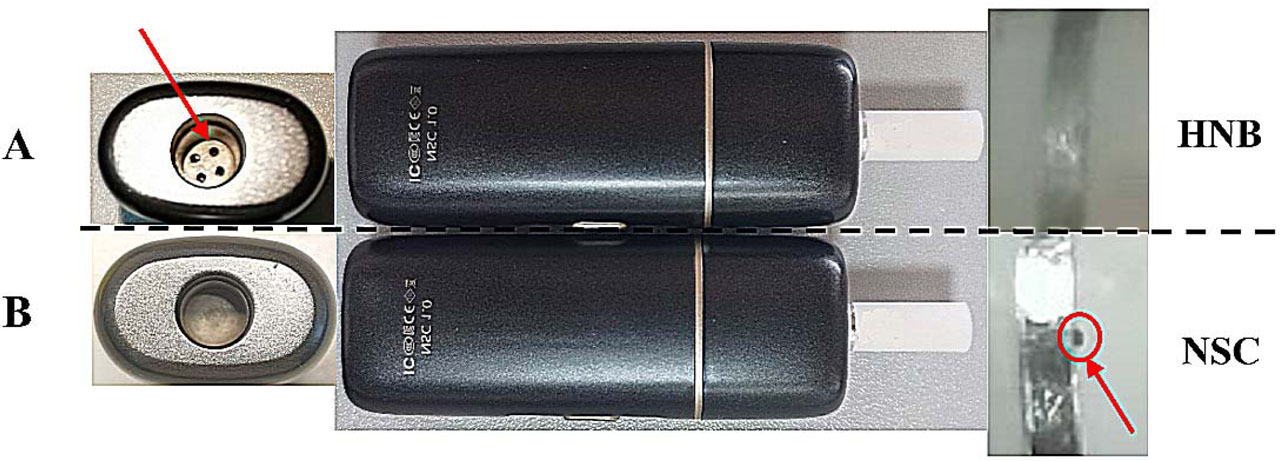
Figure 3
Photos of HNB (A) and NSC (B) systems.
Table 2
Working parameters of the two heating devices.
| Airflow pathway | Heating mode | Heating temperature | Preheating time | Working time |
|---|---|---|---|---|
| HNB | Peripheral resistive heating | 240 °C | 45 s | 4 min 12 s |
| NSC | Peripheral resistive heating | 240 °C | 45 s | 4 min 12 s |
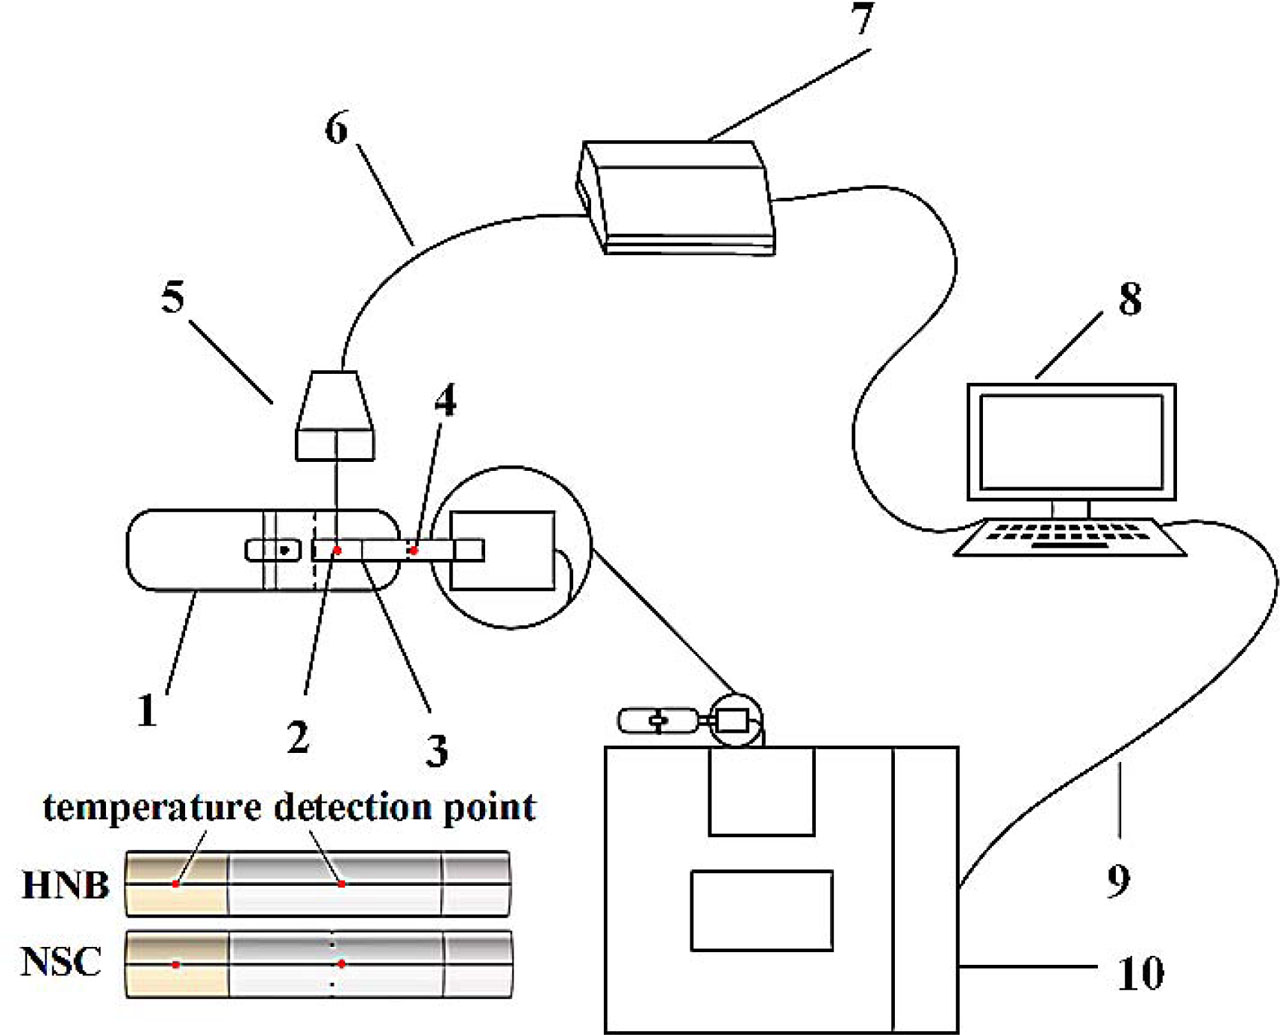
Figure 4
The locations and method for detecting temperature profiles inside the heated tobacco products.
1: Heating device; 2: Temperature detection point of tobacco plug; 3: Tobacco rod; 4: Temperature detection point of hollow acetate tube; 5: Thermocouple; 6: Thermocouple compensation wire; 7: Data collector; 8: Data acquisition software; 9: Data connection cable; 10: Single-channel smoking machine.
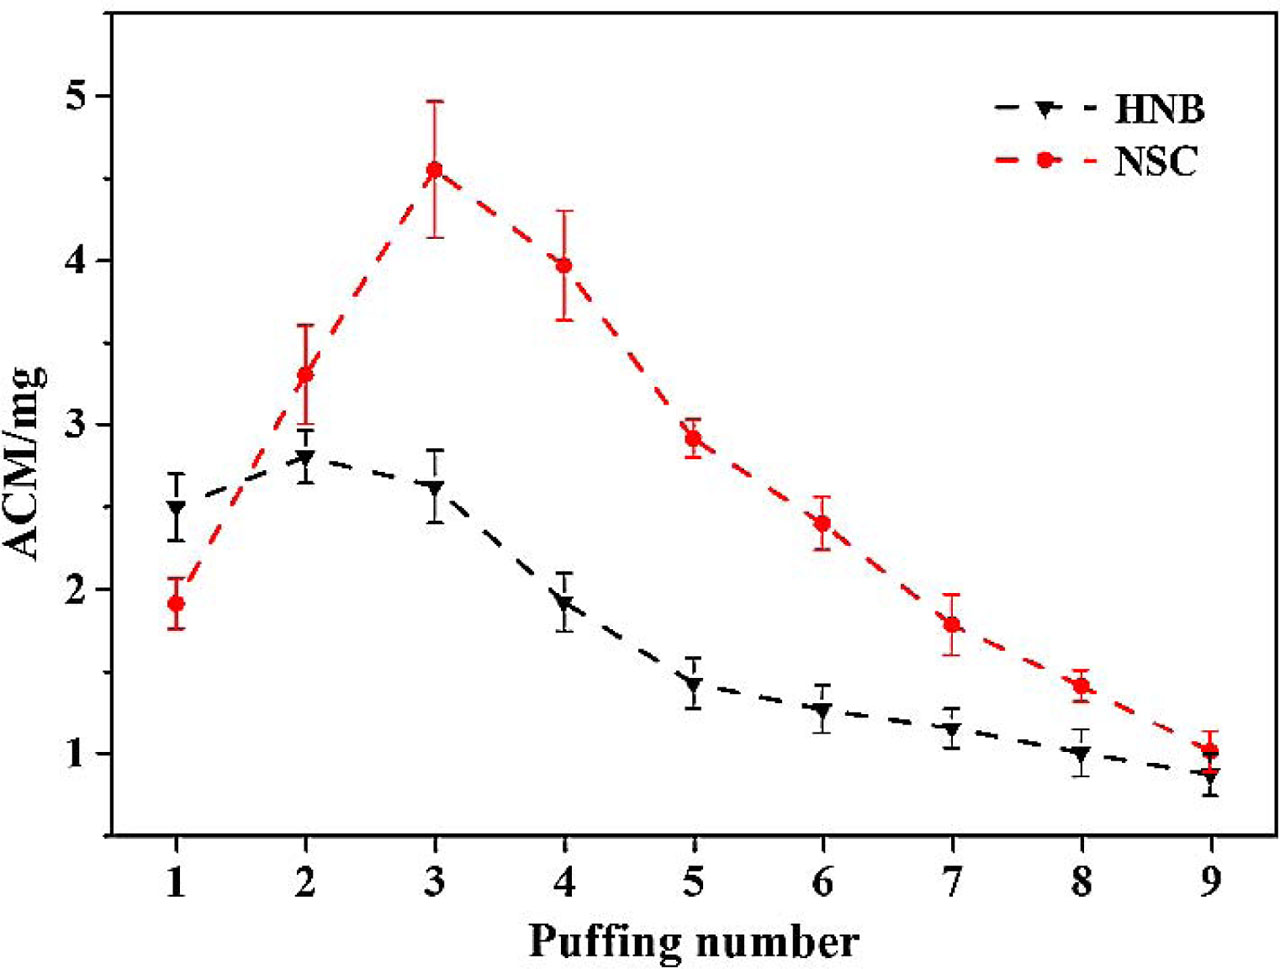
Figure 5
Mainstream aerosol collected mass (ACM) as a function of puff number under the two airflow pathways.
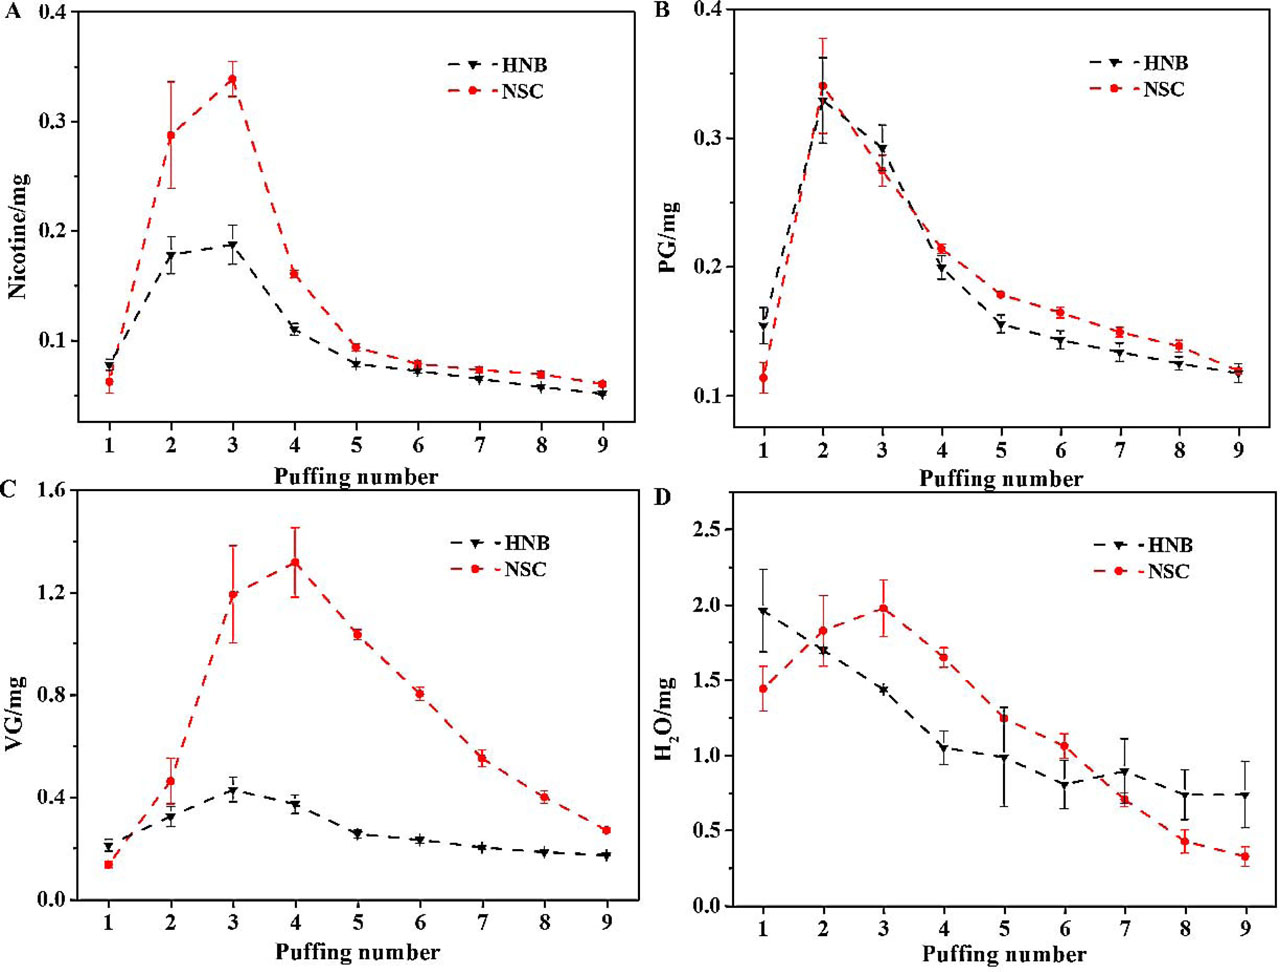
Figure 6
The deliveries of nicotine (A), PG (B), VG (C) and H2O (D) in mainstream aerosol on a puff-by-puff basis for the two different airflow pathways.
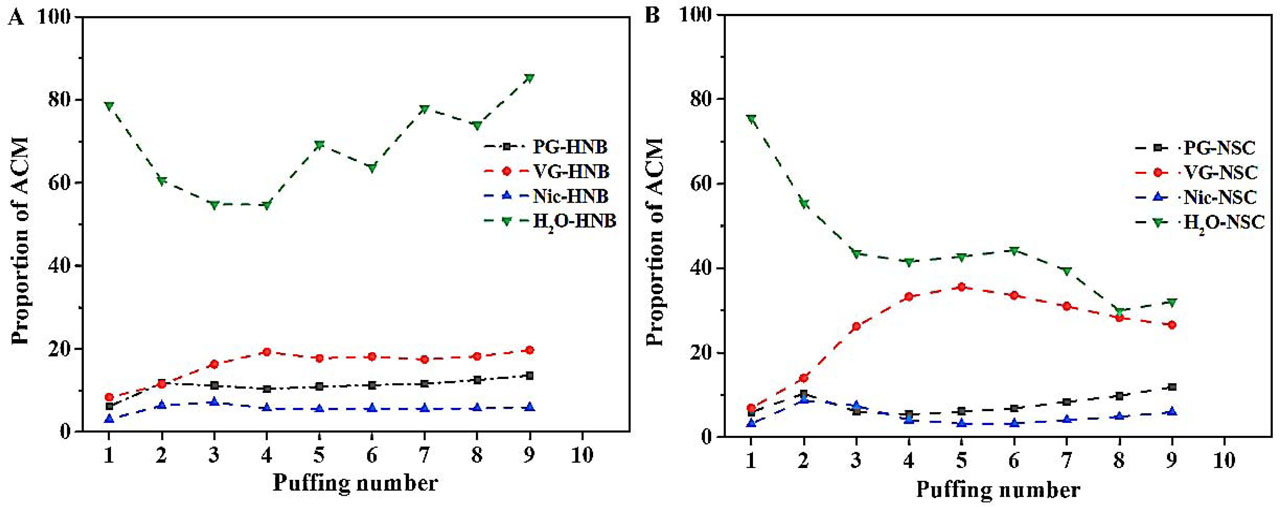
Figure 7
Proportions of nicotine, PG, VG and H2O in the aerosol collected mass (ACM) as a function of puff number for the two airflow pathways: HNB (A) and NSC (B).
Table 3
Total releases of main components in the mainstream aerosol.
| Specimens | ACM | PG | VG | Nicotine | H2O | Other components a |
|---|---|---|---|---|---|---|
| (mg/stick) | ||||||
| HNB | 15.48 ± 1.30 | 1.65 ± 0.09 | 2.35 ± 0.17 | 0.87 ± 0.04 | 10.28 ± 0.26 | 0.33 ± 0.03 |
| NSC | 23.18 ± 1.35 | 1.69 ± 0.05 | 6.15 ± 0.35 | 1.22 ± 0.06 | 10.63 ± 0.53 | 3.49 ± 0.29 |
| NSC / HNB | 150% | 102% | 262% | 140% | 103% | 1058% |
Table 4
Aldehydes and ketones in mainstream aerosol of HNB and NSC systems.
| Specimens | ACM | PG | VG | Nicotine | H2O | Other components a |
|---|---|---|---|---|---|---|
| (mg/stick) | ||||||
| HNB | 15.48 ± 1.30 | 1.65 ± 0.09 | 2.35 ± 0.17 | 0.87 ± 0.04 | 10.28 ± 0.26 | 0.33 ± 0.03 |
| NSC | 23.18 ± 1.35 | 1.69 ± 0.05 | 6.15 ± 0.35 | 1.22 ± 0.06 | 10.63 ± 0.53 | 3.49 ± 0.29 |
| NSC / HNB | 150% | 102% | 262% | 140% | 103% | 1058% |
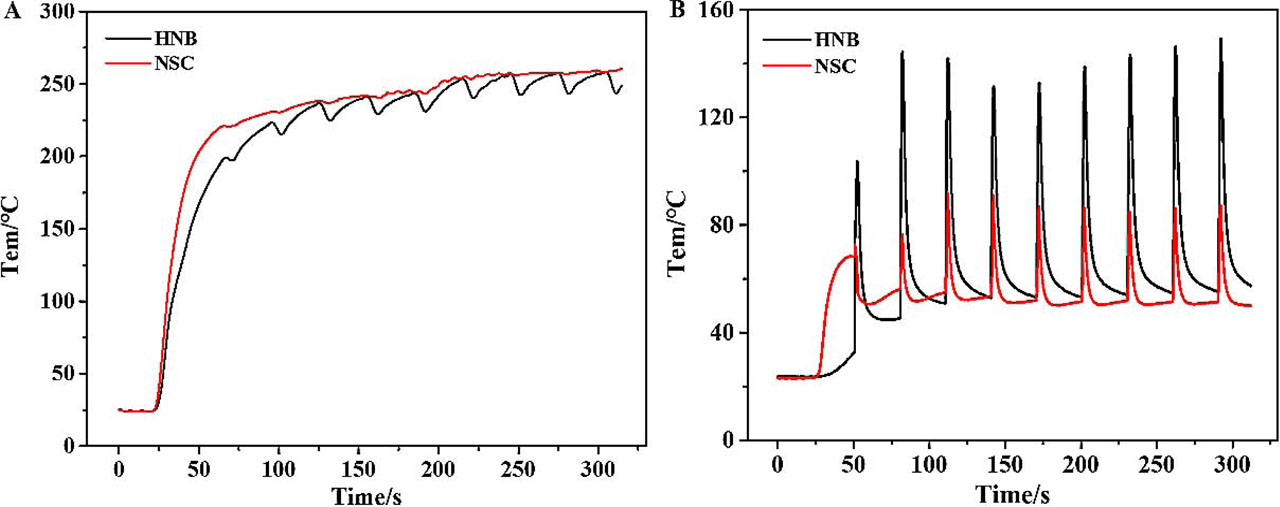
Figure 8
Variation of temperature at the center of tobacco rod (A) and inside the filter rod (B) during puffing for the HNB and NSC systems.
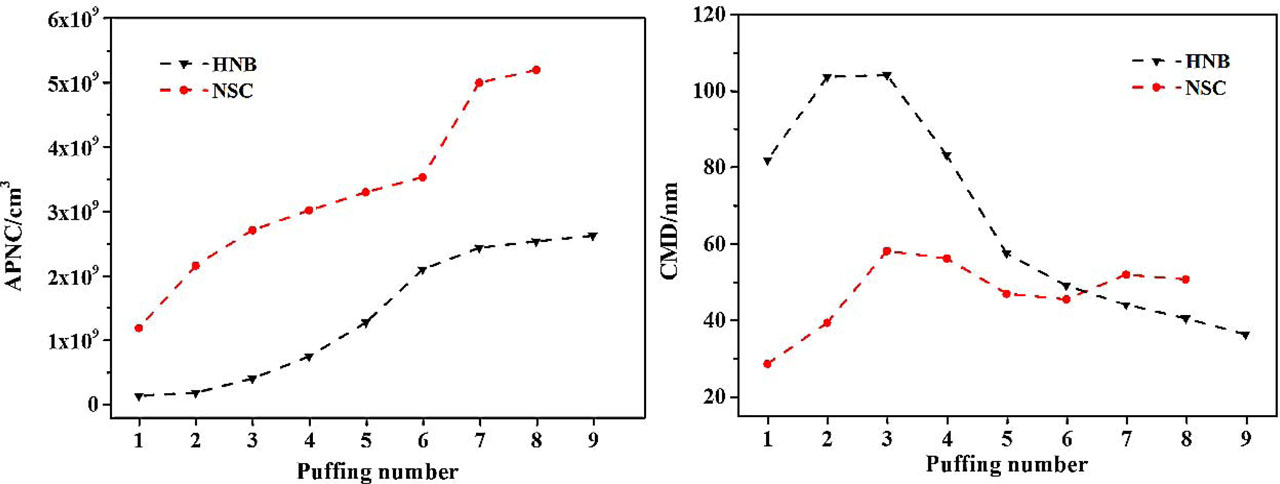
Figure 9
Aerosol particle number concentration (APNC) and count median diameter (CMD) of mainstream aerosols for HNB and NSC systems.
Table 5
Transfer ratio of main components in the tobacco substrate, filter rods, and mainstream aerosol under the HNB and NSC system.
| Specimens | PG | VG | Nicotine | H2O | PG | VG | Nicotine | H2O | ||
|---|---|---|---|---|---|---|---|---|---|---|
| mg/cig | % | |||||||||
| Tobacco | HNB | 0.16 ± 0.14 | 0.00 | 0.03 ± 0.04 | 3.92 ± 0.61 | ηresidual | 3.30 | 0.00 | 0.67 | 11.13 |
| NSC | 0.24 ± 0.00 | 0.00 | 0.08 ± 0.00 | 2.28 ± 0.57 | 4.99 | 0.00 | 2.08 | 6.46 | ||
| Filter rod | HNB | 2.33 ± 0.15 | 9.77 ± 0.79 | 1.26 ± 0.10 | 8.53 ± 0.94 | ηtrapping | 48.93 | 70.91 | 33.11 | 24.22 |
| NSC | 2.59 ± 0.08 | 4.97 ± 0.25 | 1.07 ± 0.05 | 9.28 ± 0.26 | 54.39 | 36.09 | 28.09 | 26.35 | ||
| Aerosol | HNB | 1.65 ± 0.09 | 2.35 ± 0.17 | 0.87 ± 0.04 | 10.28 ± 0.26 | ηcapture | 34.51 | 17.08 | 22.95 | 29.17 |
| NSC | 1.69 ± 0.05 | 6.15 ± 0.35 | 1.22 ± 0.06 | 10.63 ± 0.53 | 35.40 | 44.62 | 32.10 | 30.16 | ||
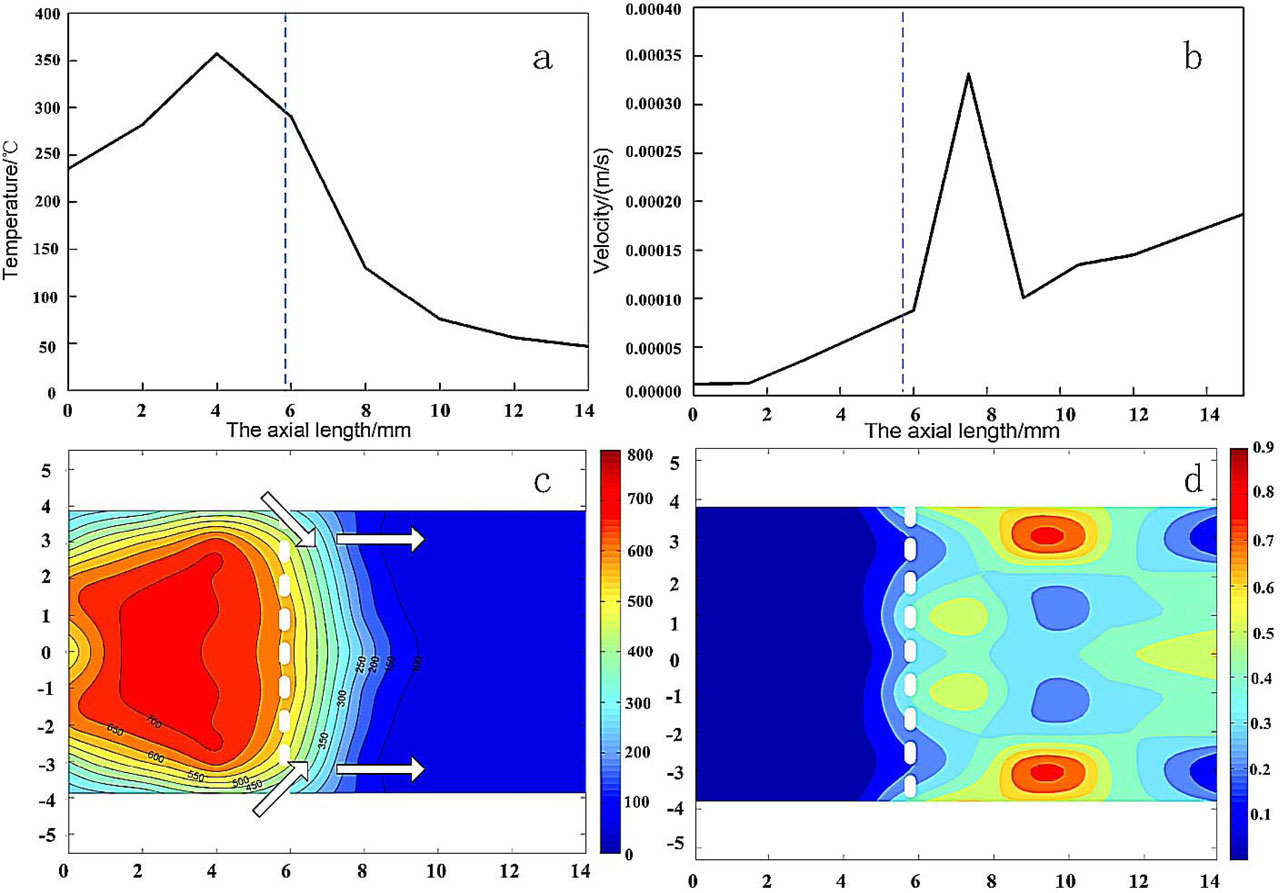
Figure 10
Surface temperature (a) and the radial flow velocity responses (b) at 1-s into a 2-s puff of a burning cigarette cone. Temperature map (c) and axial air flow velocity map (d) at the cross section are also plotted. For full details, please refer to reference 16.