
Figure 1
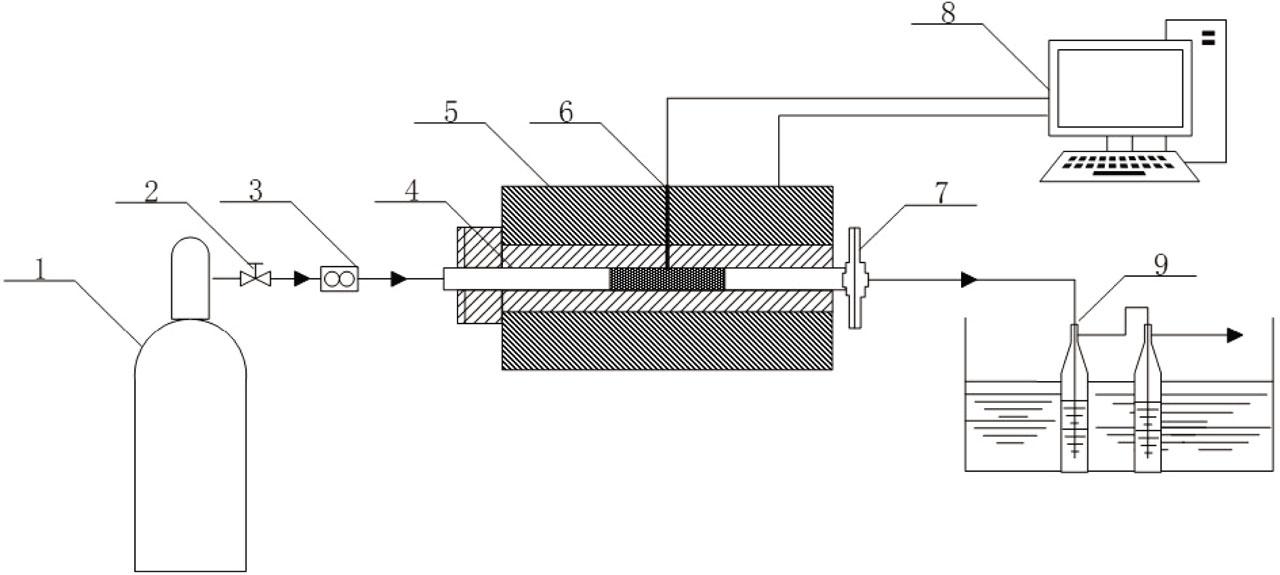
Figure 2

Figure 3

Figure 4

Figure 5

Figure 6

Figure 7

Figure 8
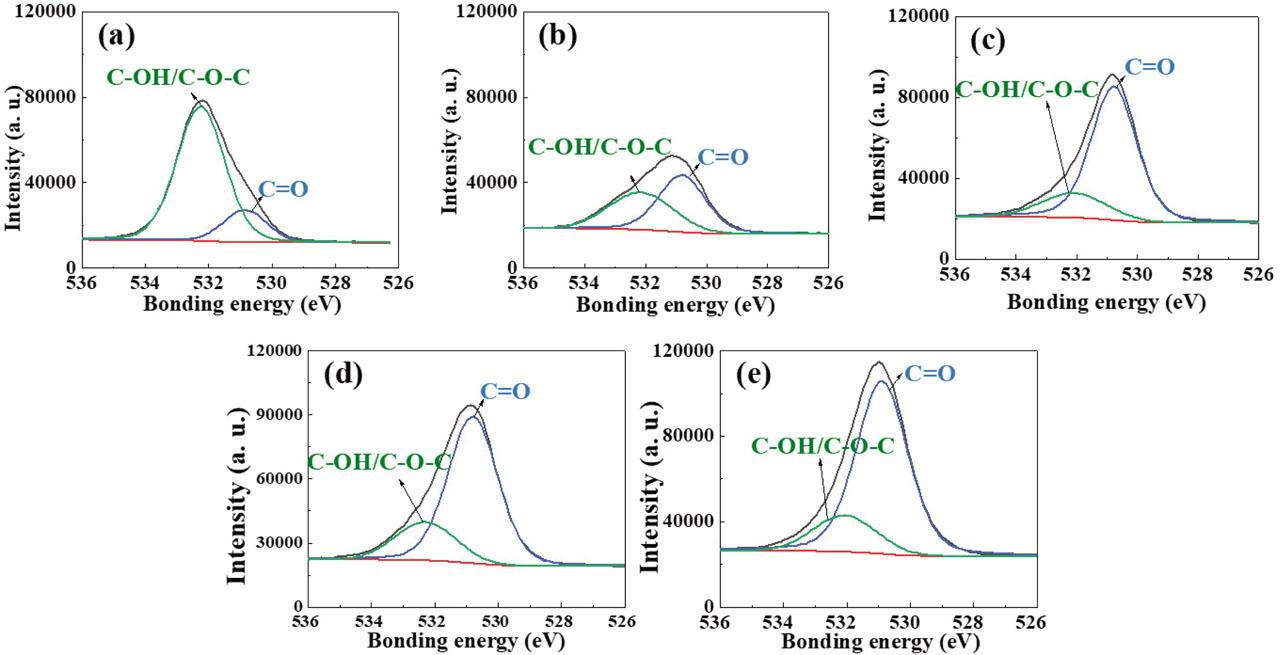
Figure 9
The relative percentage of surface carbon-containing functional groups by X-ray photoelectron spectroscopy_
| Samples | Content of functional groups (%) | |||
|---|---|---|---|---|
| C-H/C-C | C-O/C-O-C | O-C-O/C=O | -O-C=O | |
| Starting material | 75.47 | 17.78 | 6.76 | – |
| S-0-O | 87.79 | 7.59 | 4.62 | – |
| S-5-O | 80.84 | 5.75 | 9.58 | 3.82 |
| S-10-O | 78.56 | 9.04 | 9.03 | 3.37 |
| S-21-O | 74.88 | 9.96 | 8.67 | 6.49 |
j_cttr-2022-0014_tab_004
| Abbreviation | Corresponding full wording or explanatory wording |
|---|---|
| NSC | a label of our novel-designed airflow pathway of heated tobacco products (18) |
| NTC | negative temperature coefficient |
| TG | thermogravimetric |
| DTG | derivative thermogravimetric |
| GC-MS | gas chromatography-mass spectrometry |
| SEM | scanning electron microscope |
| XRD | X-ray diffraction |
| FT-IR | Fourier transform infrared spectra |
| XPS | X-ray photoelectron spectroscopy |
| IT | ignition temperature |
| TG-MS | thermogravimetric analyser with a mass spectrometer |
Elemental analysis on solid residuals under different oxygen concentrations_
| Samples | C (%) | O (%) | H (%) | N (%) | S (%) |
|---|---|---|---|---|---|
| Starting biomass | 41.86 | 45.23 | 6.71 | 1.07 | 0.07 |
| S-0-O | 63.02 | 17.44 | 4.19 | 1.90 | 0.20 |
| S-5-O | 66.57 | 13.79 | 3.83 | 2.09 | 0.34 |
| S-10-O | 63.19 | 13.34 | 3.28 | 1.84 | 0.35 |
| S-21-O | 32.47 | 18.36 | 1.59 | 0.94 | 1.01 |
The relative percentage of surface oxygen-containing functional groups by X-ray photoelectron spectroscopy_
| Samples | Content of the functional groups (%) | |
|---|---|---|
| C=O | C-O-C/C-OH | |
| Raw reconstituted tobacco | 17.58 | 82.42 |
| S-0-O | 69.08 | 30.92 |
| S-5-O | 73.43 | 26.57 |
| S-10-O | 72.46 | 27.54 |
| S-21-O | 81.37 | 18.63 |