
Figure 1
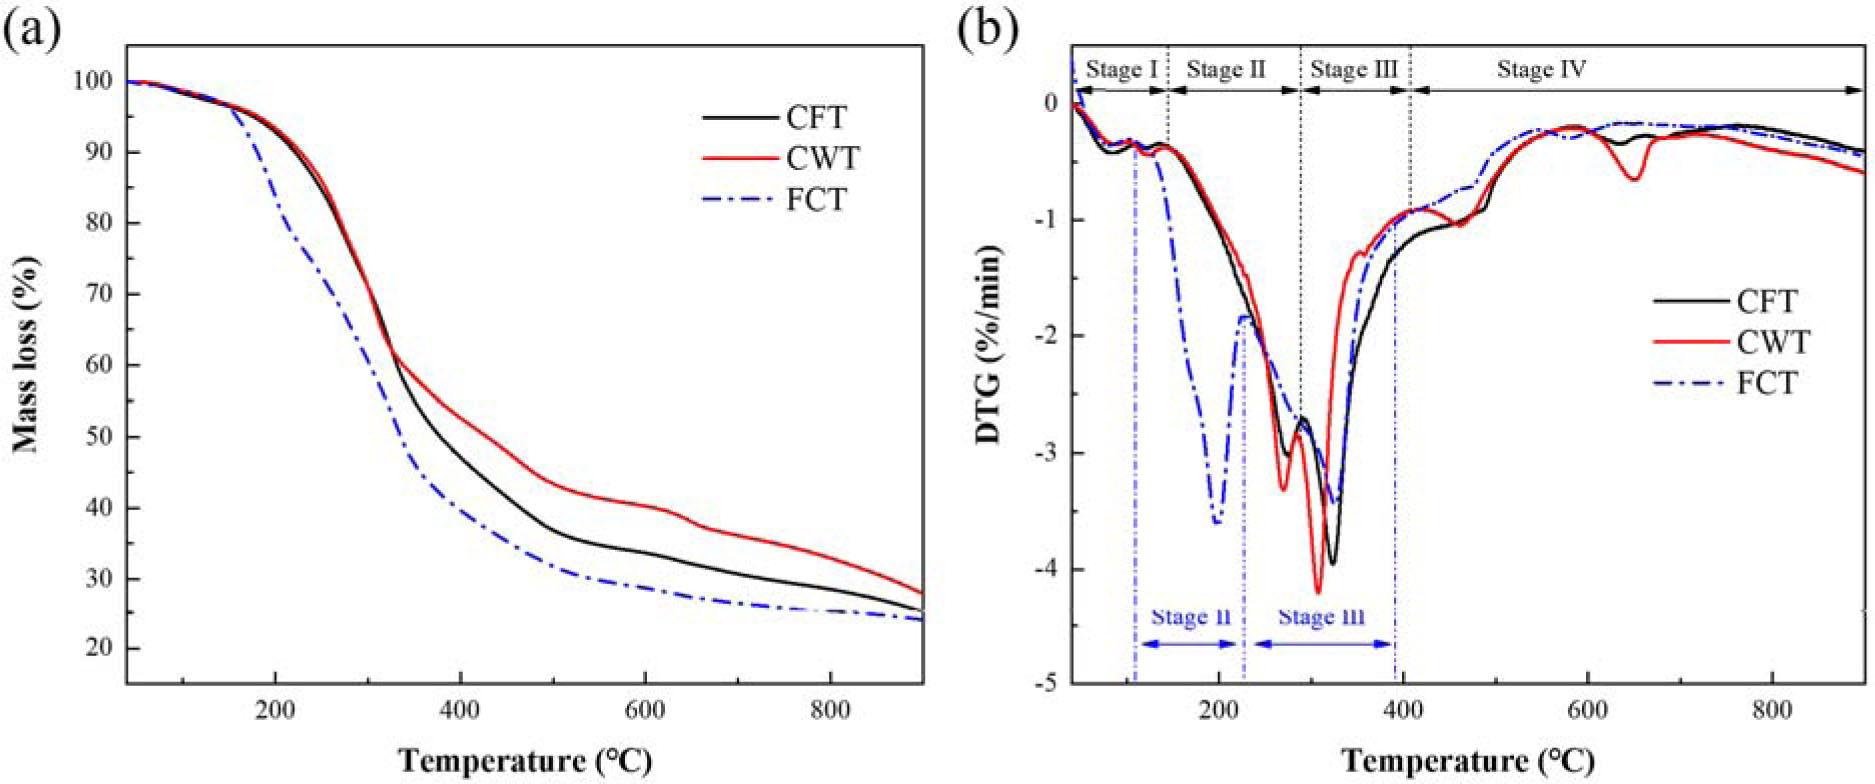
Figure 2
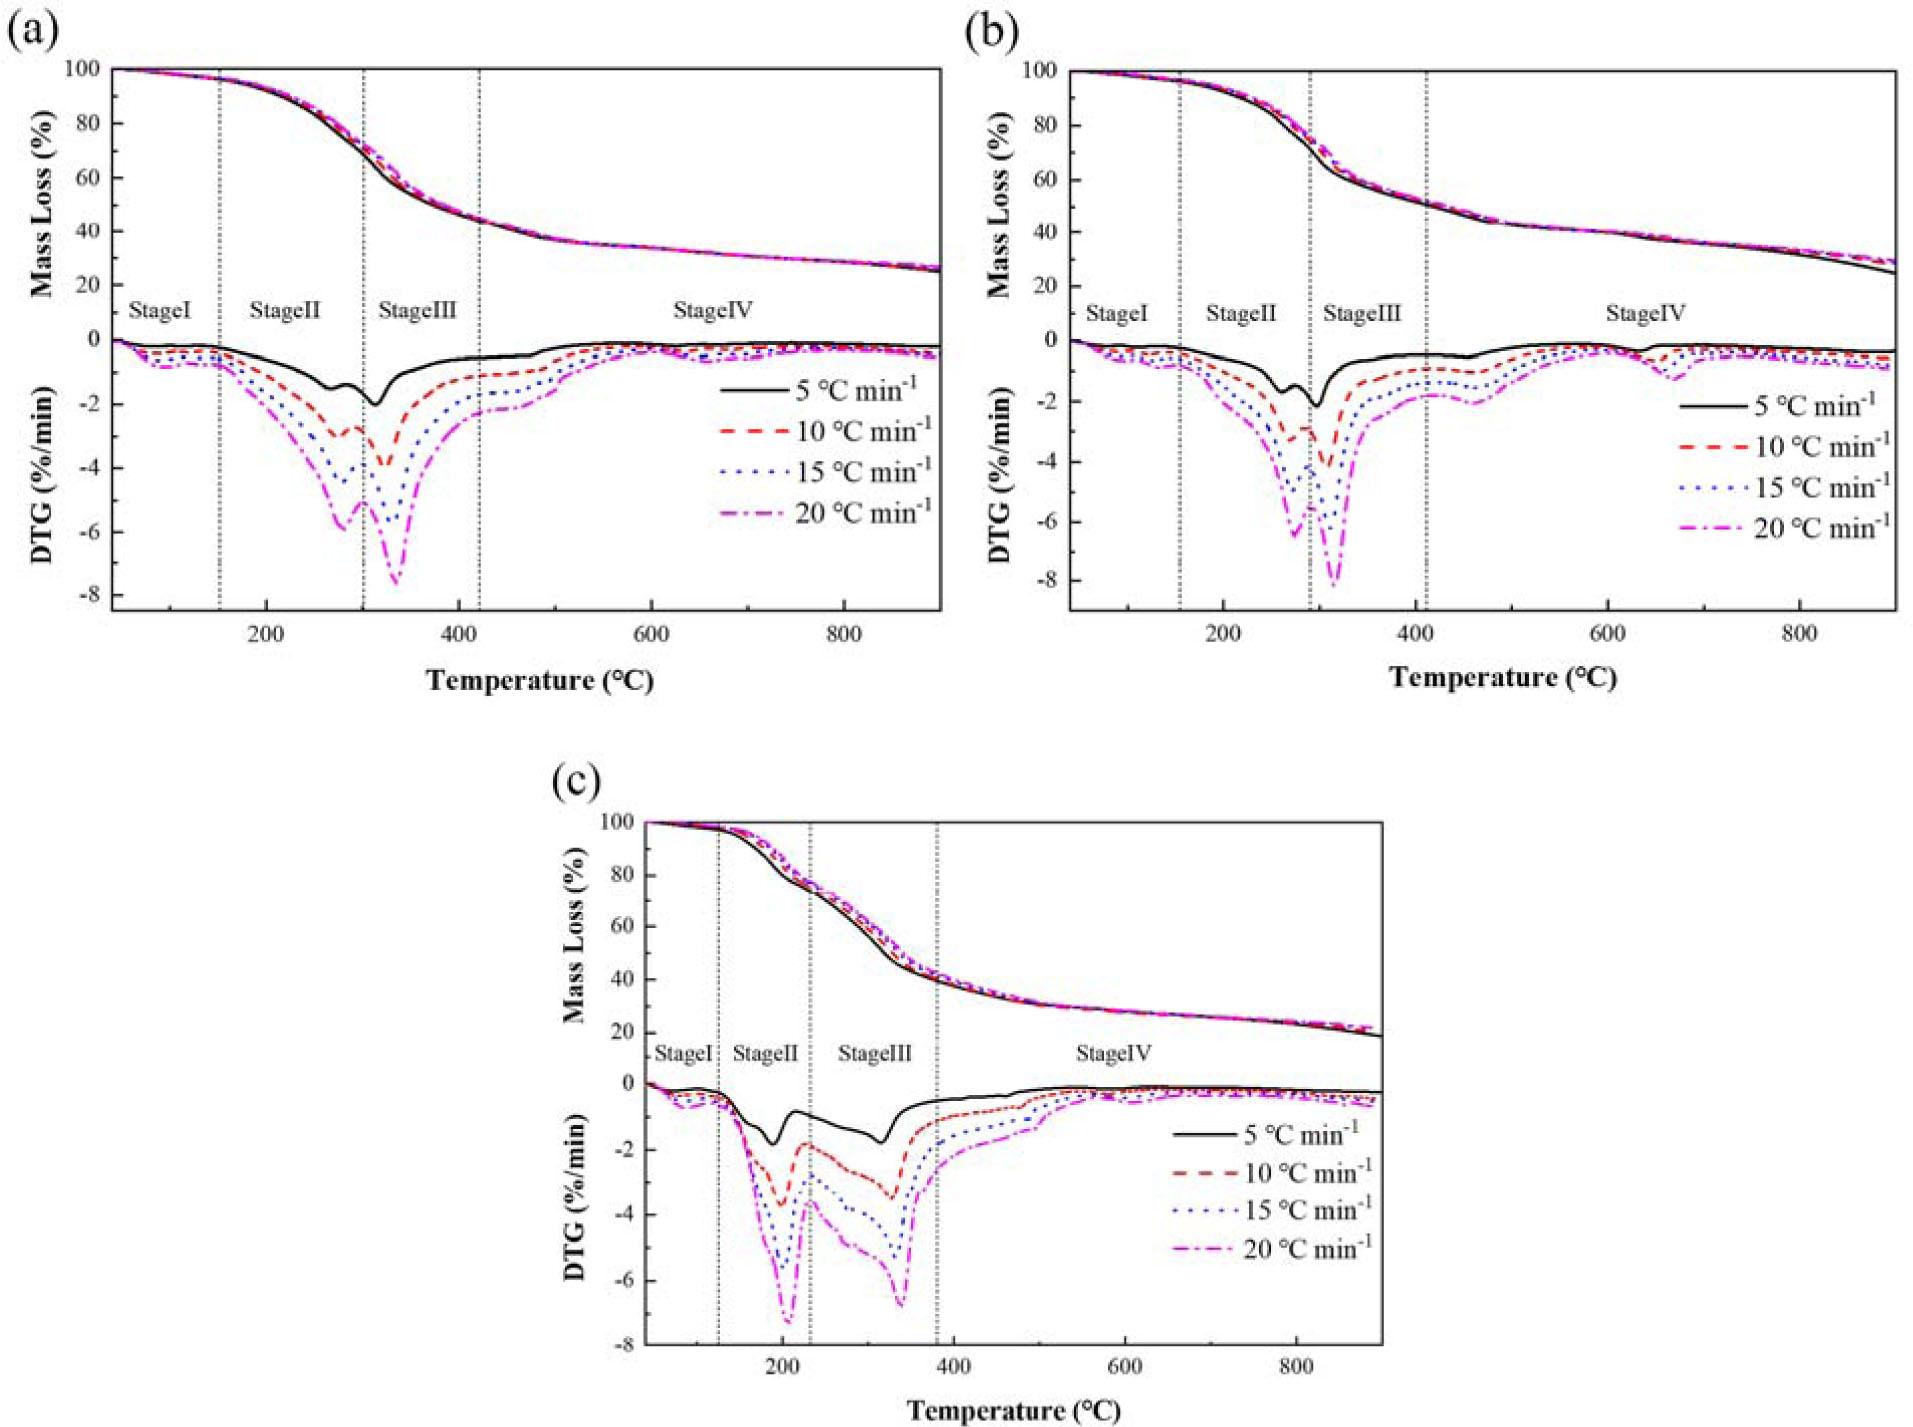
Figure 3
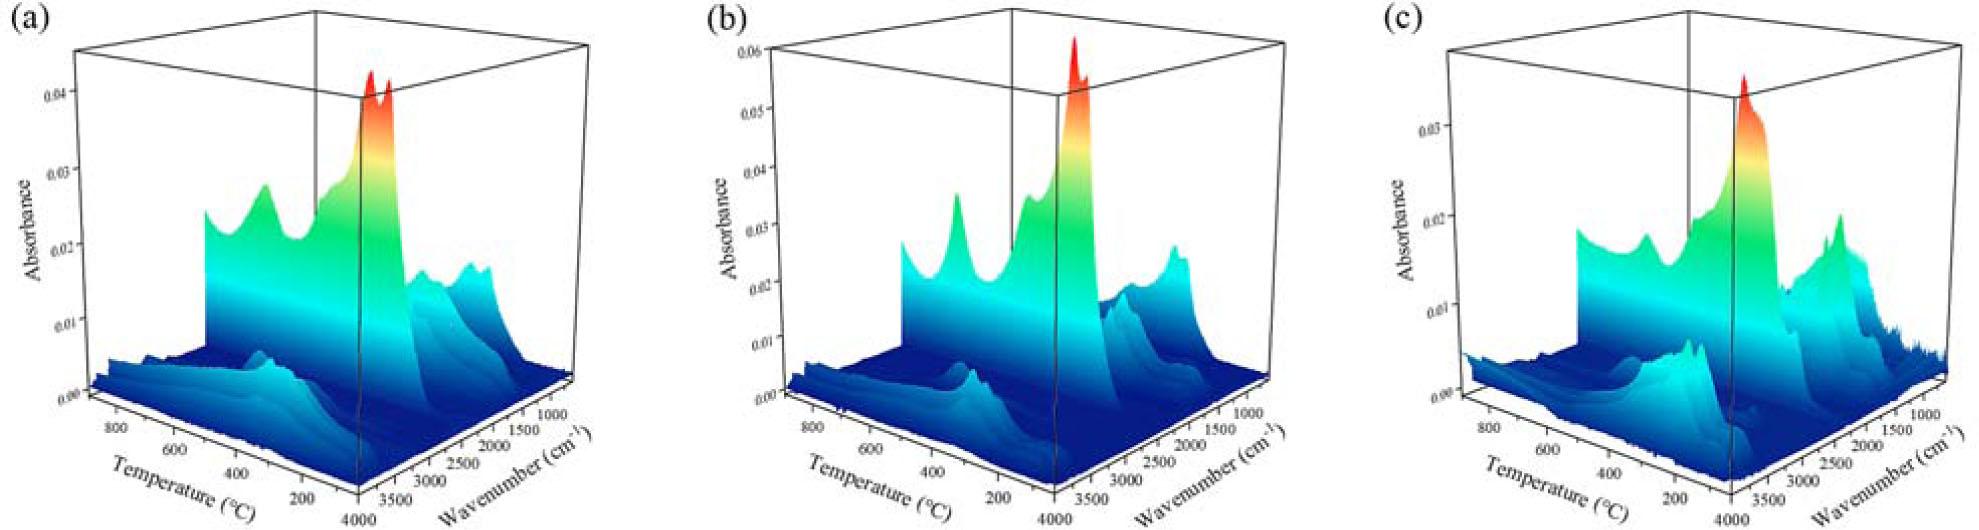
Figure 4
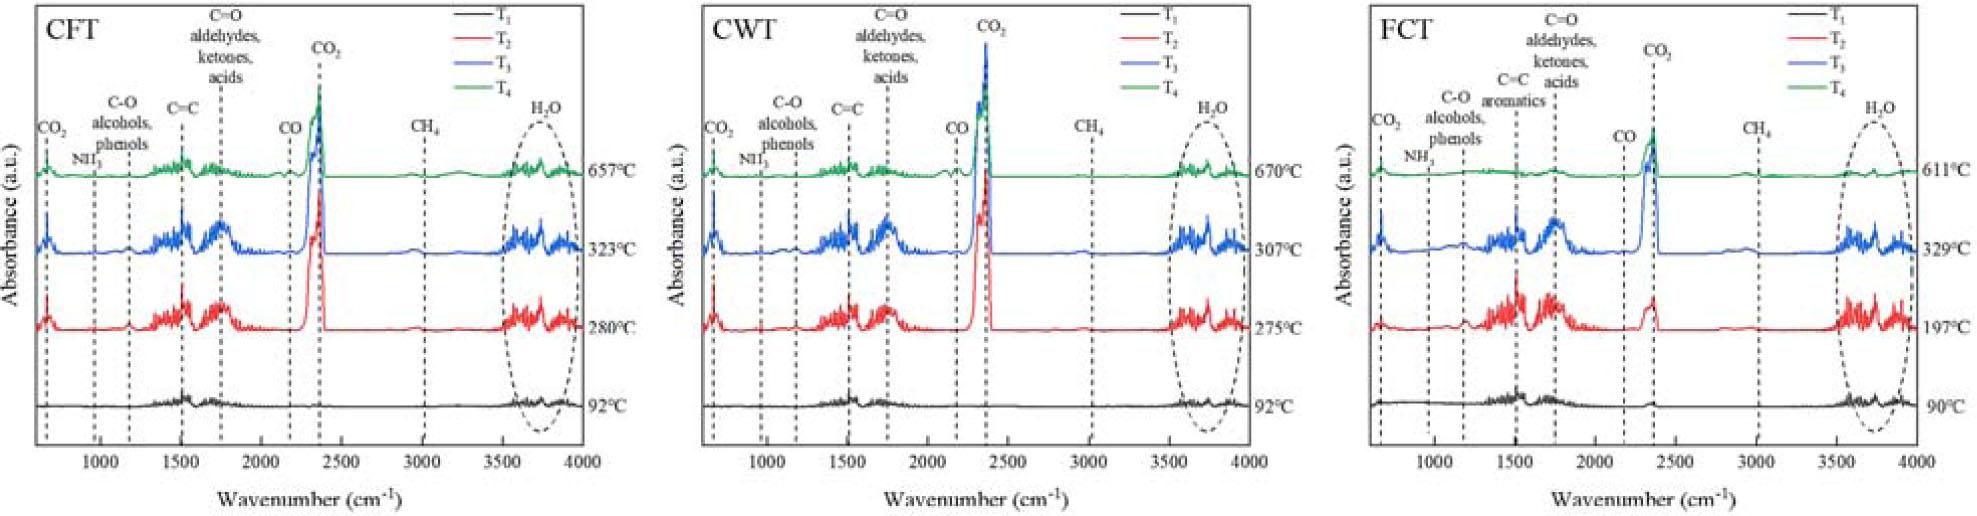
Figure 5
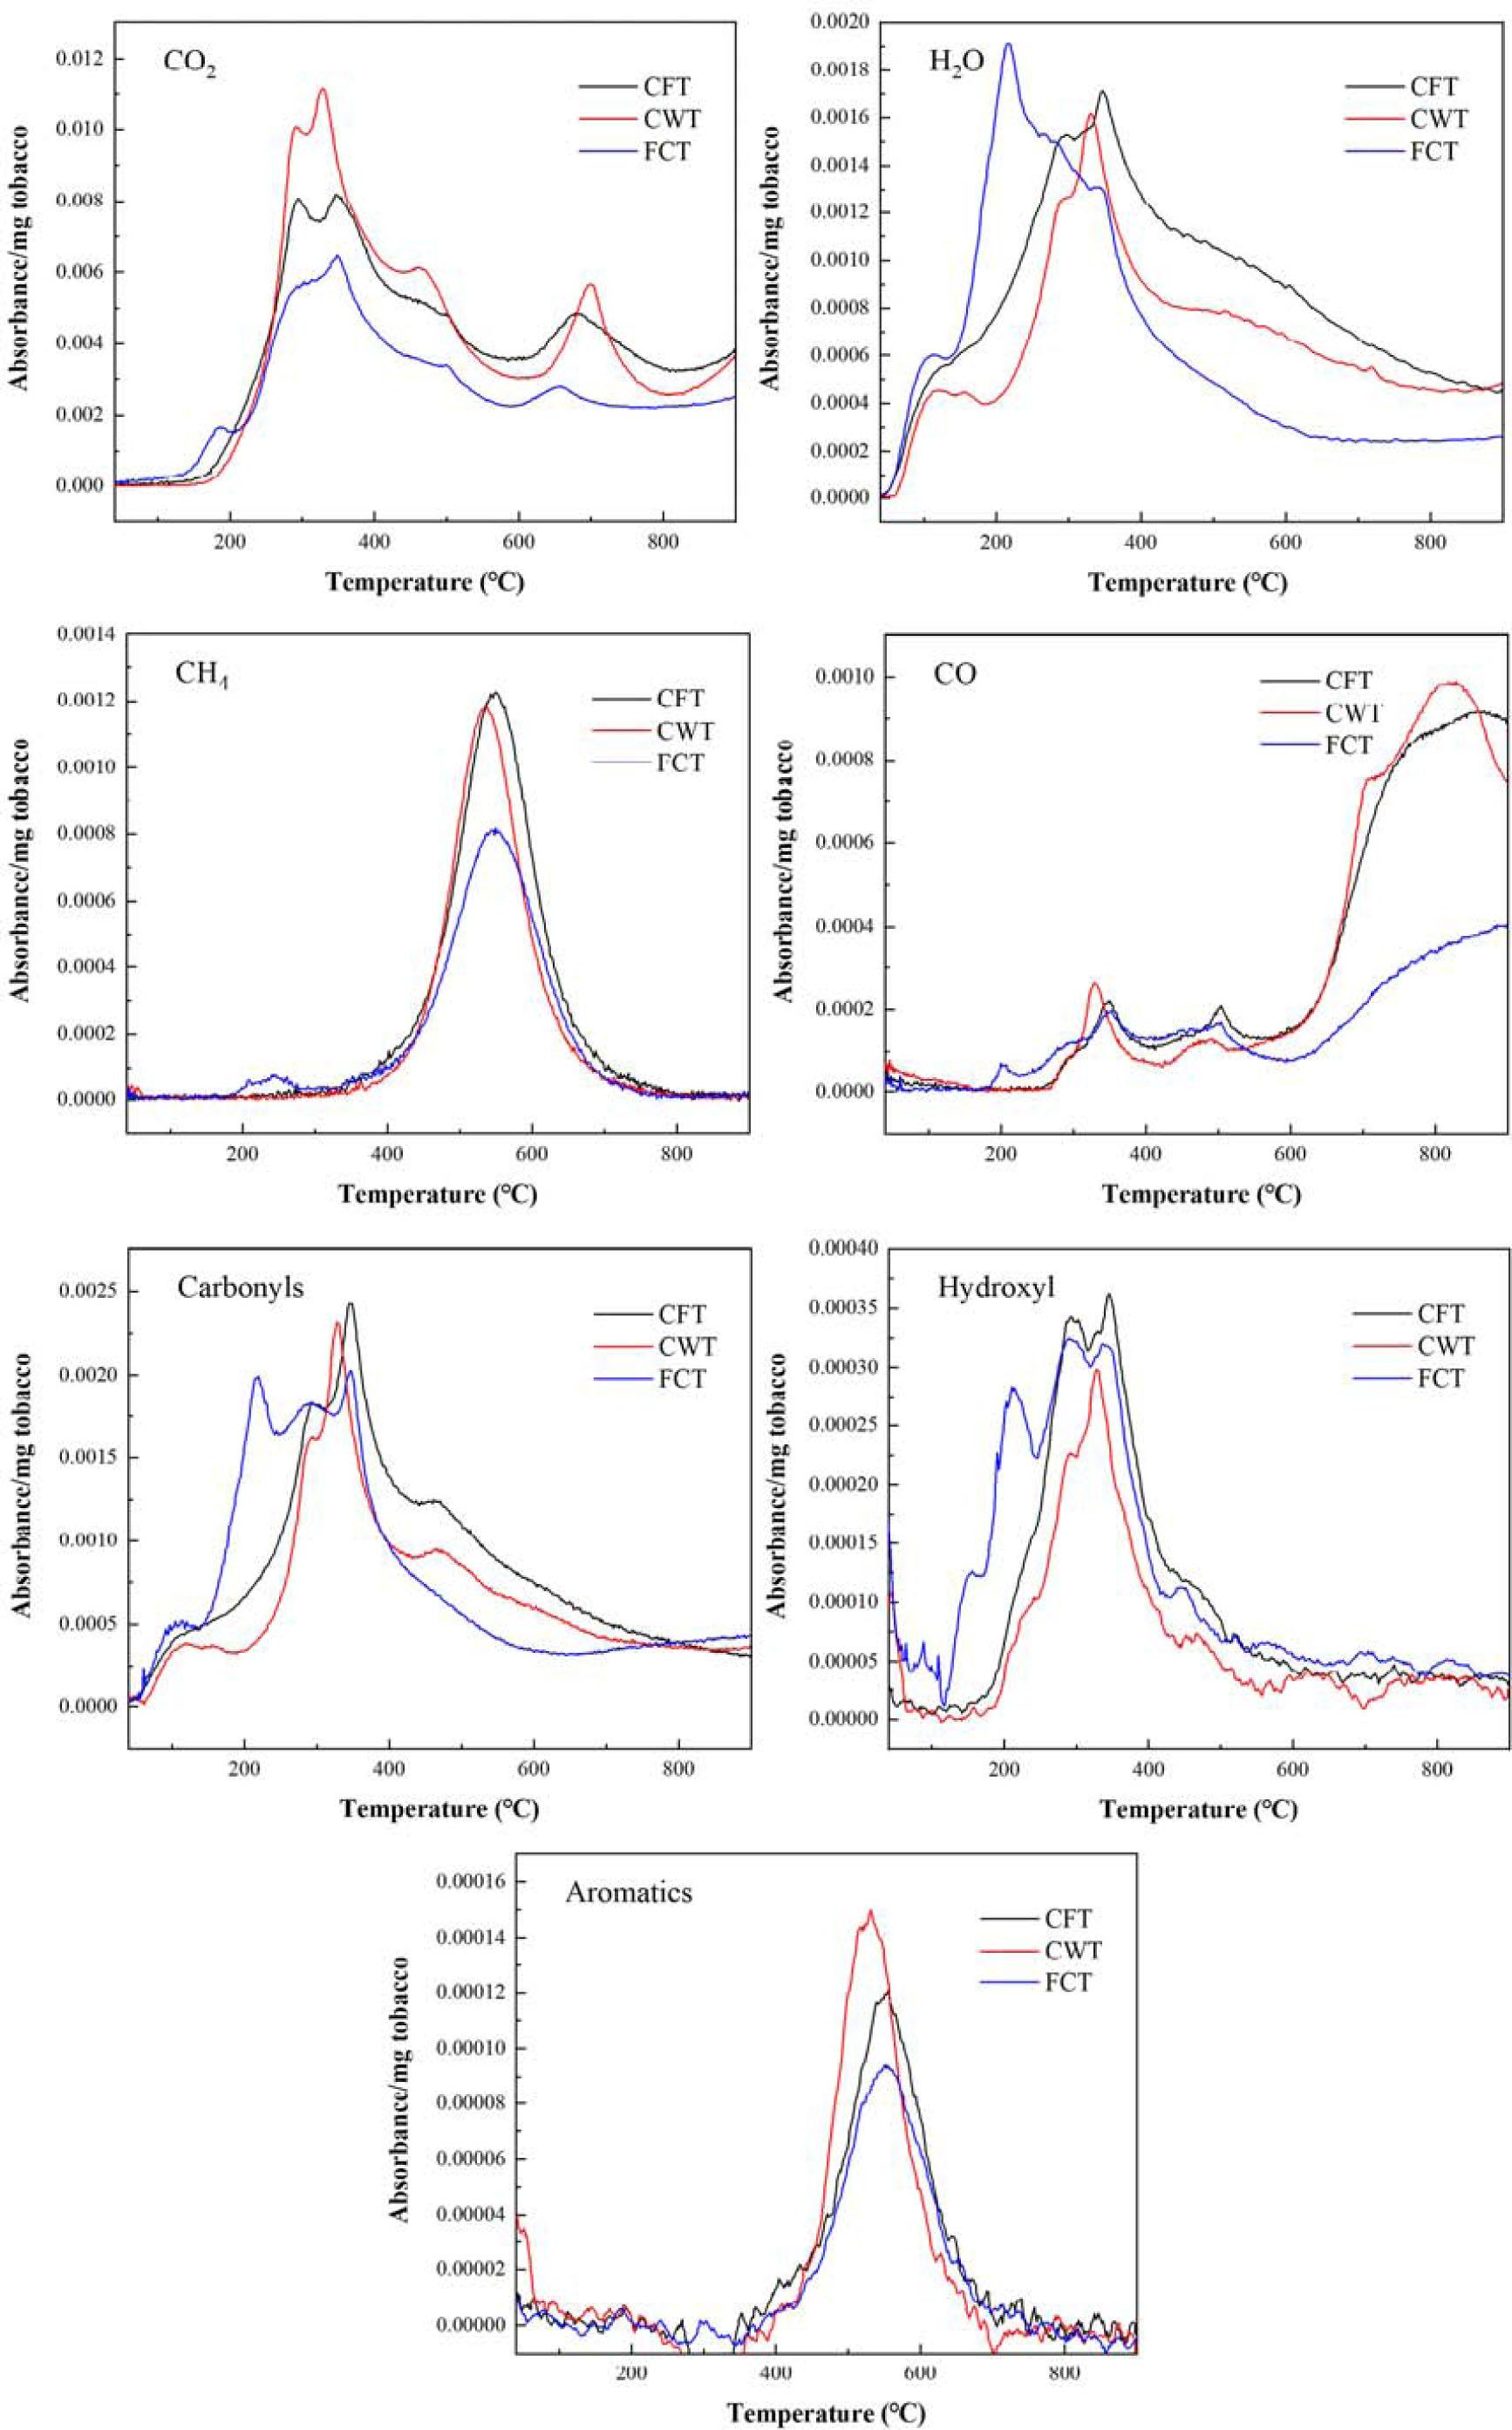
Figure 6
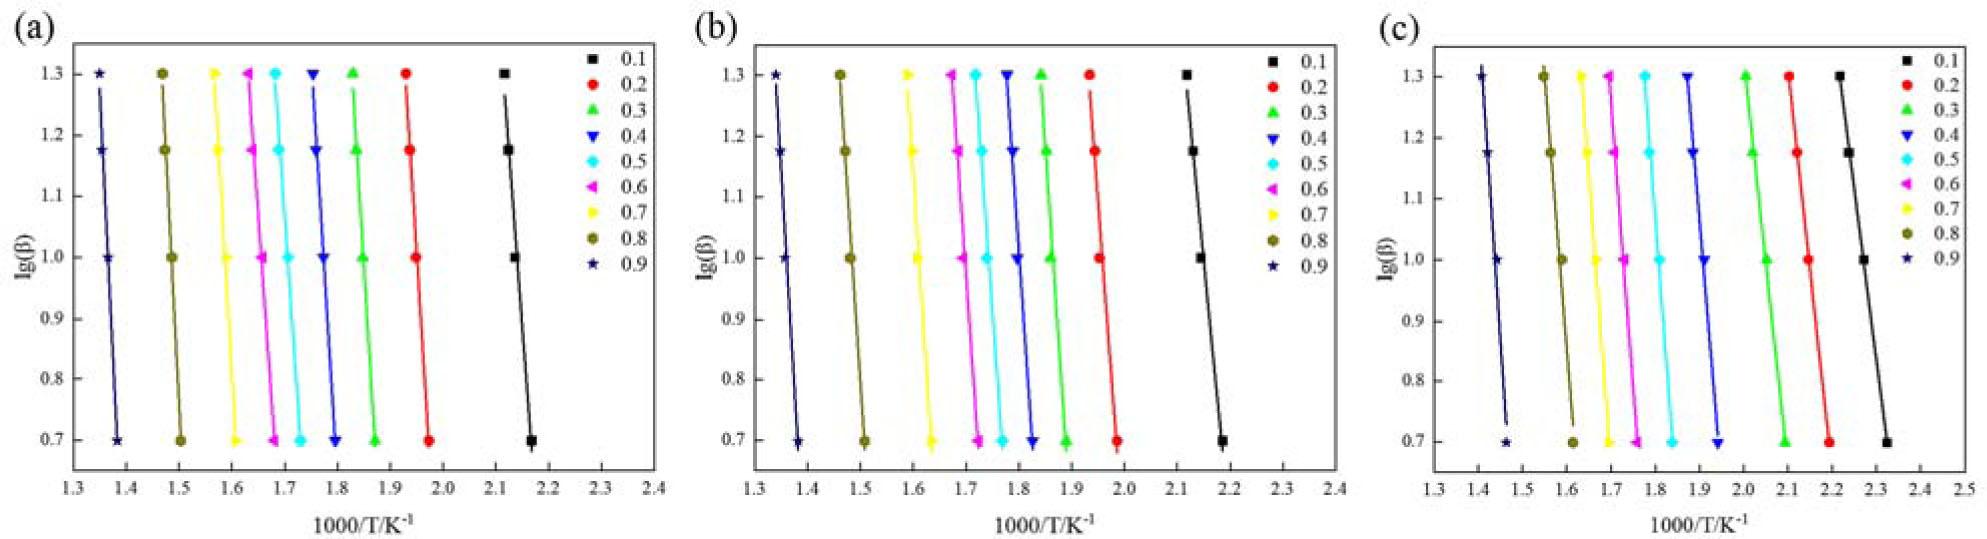
Figure 7
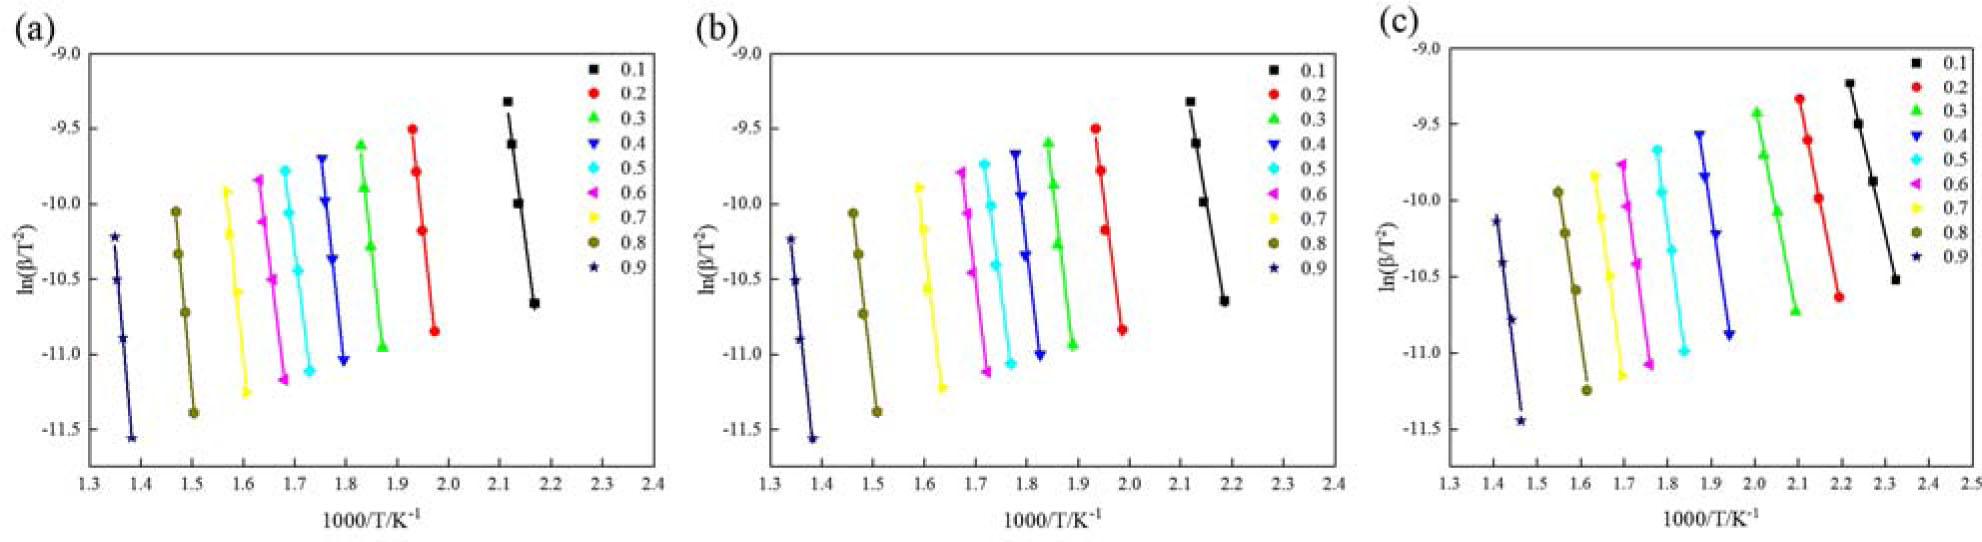
Figure 8
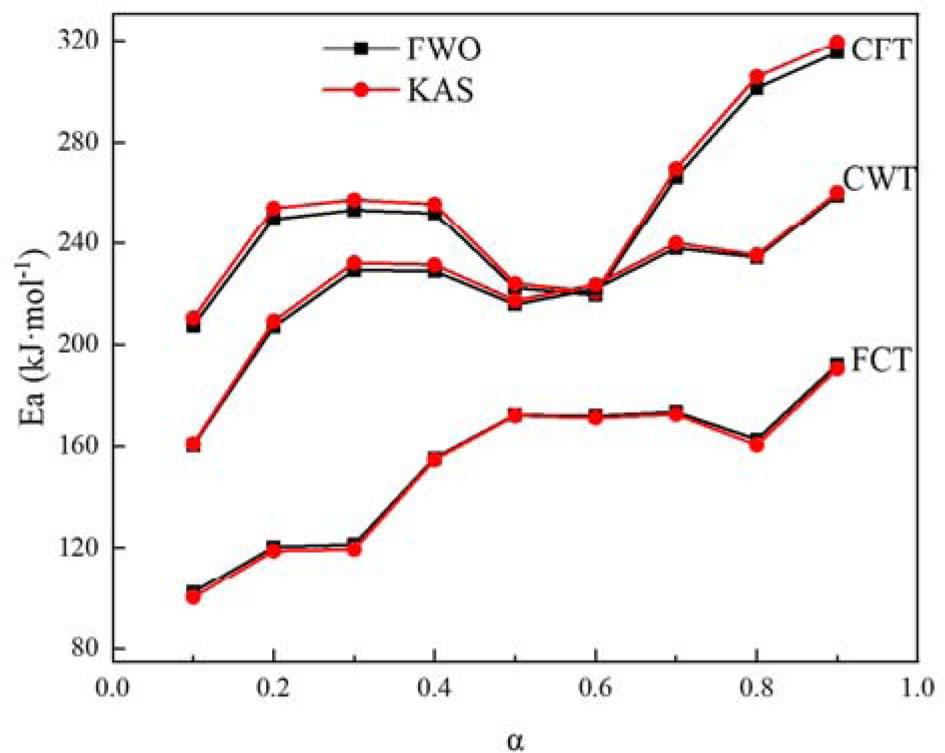
Figure 9
Composition of tobacco leaves_
| Item | CFT | CWT | FCT |
|---|---|---|---|
| Proximate analysis (wt.%) | |||
| Moisture | 2.95 | 3.84 | 1.89 |
| Volatile | 77.31 | 75.41 | 76.79 |
| Fixed carbon | 12.80 | 11.19 | 16.76 |
| Ash | 9.89 | 13.40 | 6.54 |
| Ultimate analysis (wt.%) | |||
| C | 43.57 | 42.95 | 41.83 |
| H | 5.88 | 6.17 | 6.32 |
| N | 3.63 | 3.77 | 1.67 |
| S | 0.00 | 0.18 | 0.17 |
| O | 36.52 | 37.41 | 43.28 |
| Biochemical analysis (wt.%) | |||
| Hemicellulose | 2.25 | 3.24 | 2.81 |
| Cellulose | 11.35 | 13.12 | 14.26 |
| Lignin | 2.84 | 3.65 | 3.21 |
| Nicotine content (wt.%) | 2.20 | 2.33 | 2.07 |
Characteristic parameters of tobacco leaves during pyrolysis_
| Sample | TS (°C) | Tmax (°C) | Rmax (% min−1) | Rmean (% min−1) | ΔT1/2 (°C) | Di (10−7%2 °C−3 min−2) | Residue (%) |
|---|---|---|---|---|---|---|---|
| CFT | |||||||
| 5 | 130 | 313 | −2.01 | −0.43 | 105 | 2.02 | 24.46 |
| 10 | 134 | 323 | −3.96 | −0.86 | 112 | 6.99 | 24.73 |
| 15 | 142 | 330 | −5.78 | −1.27 | 121 | 12.91 | 25.71 |
| 20 | 146 | 335 | −7.65 | −1.68 | 122 | 21.61 | 26.11 |
| CWT | |||||||
| 5 | 131 | 297 | −2.16 | −0.43 | 72 | 3.30 | 24.75 |
| 10 | 140 | 307 | −4.21 | −0.83 | 76 | 10.62 | 27.56 |
| 15 | 144 | 310 | −6.22 | −1.23 | 79 | 21.61 | 28.25 |
| 20 | 151 | 315 | −8.18 | −1.62 | 82 | 33.94 | 28.97 |
| FCT | |||||||
| 5 | 101 | 188 | −1.82 | −0.47 | 60 | 7.51 | 18.75 |
| 10 | 103 | 197 | −3.73 | −0.92 | 62 | 27.30 | 20.06 |
| 15 | 108 | 201 | −5.60 | −1.36 | 64 | 54.80 | 21.38 |
| 20 | 115 | 206 | −7.30 | −1.80 | 65 | 85.30 | 21.82 |
Identification of gas products during pyrolysis of tobacco based on FTIR spectra_
| Wavenumber (cm−1) | Functional groups | Compounds | References |
|---|---|---|---|
| 3500–4000 (selected:3566) | O-H Symmetrical and asymmetrical stretching | H2O | (14, 42, 45) |
| 2250–2500 (selected:2359) | Asymmetrical stretching in O=C=O | CO2 | (14, 45) |
| 2850–3030 (selected:3016) | C-H Stretching | CH4 | (43) |
| 2000–2250 (selected:2190) | Stretching vibration in CO | CO | (14, 45) |
| 1710–1800 (selected:1749) | C=O Stretching | Carbonyl groups | (14, 45) |
| 1050–1200 (selected:1180) | C-O Stretch | Hydroxyl groups | (14) |
| 1450–1650 | Aromatic C=C-C ring stretch | Aromatics | (42, 43) |
| 3070–3130 (selected:3076) | Aromatic C-H in plane bend | ||
| 966 | NH3 | (42) |
Kinetic parameters of tobacco thermal decomposition obtained by Coats-Redfern method_
| Sample | Stage | Reaction | Fitted equation | A (min−1) | Ea (kJ mol−1) | Correlation coefficient R2 |
|---|---|---|---|---|---|---|
| CFT | II | D1 | Y = −10165.86x + 6.09 | 4.49 × 10⁴ | 84.5 | 0.995 |
| III | F3/2 | Y = −23551.40x + 26.44 | 7.12 × 10¹³ | 195.8 | 0.990 | |
| F2 | Y = −28195.40x + 34.48 | 2.65 × 10¹⁷ | 234.4 | 0.997 | ||
| CWT | II | D1 | Y = −10305.79x + 5.30 | 7.74 × 10⁴ | 85.7 | 0.998 |
| III | F3/2 | Y = −22403.96x + 25.26 | 4.17 × 10¹³ | 186.2 | 0.963 | |
| F2 | Y = −27020.35x + 33.40 | 1.73 × 10¹⁷ | 224.7 | 0.984 |
Mass loss at different temperature intervals during pyrolysis of tobacco leaf samples_
| Sample | Stage I | Stage II | Stage III | |||
|---|---|---|---|---|---|---|
| Temperature interval (°C) | Mass loss (%) | Temperature interval (°C) | Mass loss (%) | Temperature interval (°C) | Mass loss (%) | |
| CFT | ||||||
| 5 | 40–130 | 2.84 | 130–283 | 22.60 | 283–397 | 26.43 |
| 10 | 40–134 | 2.88 | 134–292 | 23.26 | 292–411 | 26.78 |
| 15 | 40–142 | 3.03 | 142–296 | 23.07 | 296–415 | 26.77 |
| 20 | 40–146 | 3.06 | 146–299 | 23.35 | 299–424 | 27.34 |
| CWT | ||||||
| 5 | 40–131 | 2.81 | 131–273 | 20.04 | 273–407 | 25.33 |
| 10 | 40–140 | 2.85 | 140–284 | 20.83 | 284–417 | 24.65 |
| 15 | 40–144 | 2.84 | 144–287 | 20.94 | 287–419 | 24.32 |
| 20 | 40–151 | 2.96 | 151–291 | 21.08 | 291–426 | 24.44 |
| FCT | ||||||
| 5 | 40–101 | 1.29 | 101–216 | 21.09 | 216–401 | 38.82 |
| 10 | 40–103 | 1.10 | 103–227 | 22.27 | 227–405 | 38.41 |
| 15 | 40–108 | 1.15 | 108–232 | 21.76 | 232–408 | 38.19 |
| 20 | 40–115 | 1.27 | 115–240 | 22.12 | 240–416 | 37.40 |
Activation energies of cigar tobacco leaves obtained by the FWO method and KAS method_
| Conversion | CFT | CWT | FCT | ||||||||||||
|---|---|---|---|---|---|---|---|---|---|---|---|---|---|---|---|
| FWO | KAS | Difference | FWO | KAS | Difference | FWO | KAS | Difference | |||||||
| Ea (kJ mol−1) | Correlation coefficient R2 | Ea (kJ mol−1) | Correlation coefficient R2 | (%) | Ea (kJ mol−1) | Correlation coefficient R2 | Ea (kJ mol−1) | Correlation coefficient R2 | (%) | Ea (kJ mol−1) | Correlation coefficient R2 | Ea (kJ mol−1) | Correlation coefficient R2 | (%) | |
| 0.1 | 207.4 | 0.984 | 210.3 | 0.982 | 1.40 | 160.4 | 0.993 | 161.0 | 0.993 | 0.35 | 102.2 | 0.999 | 100.1 | 0.999 | 1.02 |
| 0.2 | 249.9 | 0.995 | 254.2 | 0.994 | 1.72 | 206.9 | 0.987 | 209.1 | 0.986 | 1.05 | 120.4 | 0.999 | 118.9 | 0.999 | 0.76 |
| 0.3 | 253.5 | 0.994 | 257.6 | 0.994 | 1.59 | 229.3 | 0.990 | 232.2 | 0.989 | 1.26 | 121.4 | 0.996 | 119.6 | 0.996 | 0.92 |
| 0.4 | 252.2 | 0.995 | 255.9 | 0.994 | 1.42 | 228.8 | 0.992 | 231.4 | 0.991 | 1.12 | 155.4 | 0.994 | 154.7 | 0.994 | 0.35 |
| 0.5 | 222.2 | 0.995 | 224.0 | 0.994 | 0.77 | 215.6 | 0.993 | 217.2 | 0.993 | 0.74 | 172.3 | 0.996 | 172.0 | 0.996 | 0.15 |
| 0.6 | 219.3 | 0.994 | 220.6 | 0.993 | 0.58 | 221.9 | 0.994 | 223.5 | 0.994 | 0.74 | 171.9 | 0.996 | 171.2 | 0.996 | 0.38 |
| 0.7 | 266.4 | 0.999 | 269.7 | 0.988 | 1.21 | 238.0 | 0.989 | 240.0 | 0.988 | 0.82 | 173.5 | 0.998 | 172.5 | 0.998 | 0.52 |
| 0.8 | 301.3 | 0.992 | 305.7 | 0.991 | 1.43 | 234.3 | 0.994 | 235.2 | 0.994 | 0.38 | 162.6 | 0.984 | 160.5 | 0.982 | 1.06 |
| 0.9 | 315.2 | 0.993 | 319.3 | 0.993 | 1.28 | 259.3 | 0.994 | 260.5 | 0.994 | 0.45 | 192.1 | 0.983 | 190.4 | 0.980 | 0.84 |
| Average | 254.2 | 257.5 | 221.6 | 223.3 | 155.4 | 151.1 | |||||||||
Functional expressions of several common response models_
| Mechanisms | Symbol | G(α) | f(α) |
|---|---|---|---|
| One-dimensional diffusion | D1 | α2 |
|
| Two-dimensional diffusion | D2 | α + (1 − α)ln(1 − α) | [−ln(1 − α)]−1 |
| Three-dimensional diffusion | D3 |
|
|
| Avrami-Erofeev | A2 |
|
|
| Avrami-Erofeev | A3 |
|
|
| First-order reaction | F1 | −ln(1 − α) | 1 − α |
| 1.5-order reaction | F3/2 |
|
|
| Second-order reaction | F2 | (1 − α)−1 − 1 | (1 − α)2 |
| Contracting area | R2 |
|
|
| 3D contracting volume | R3 |
|
|