
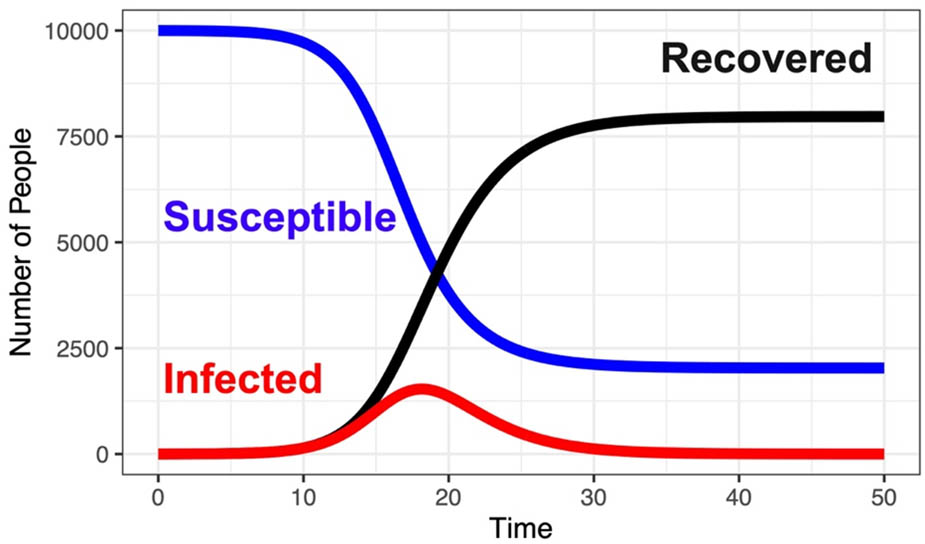
Figure 1
Example SIR model trajectories illustrating the course of an infectious disease outbreak (“Infected”), with and .
Source: Author’s contribution.
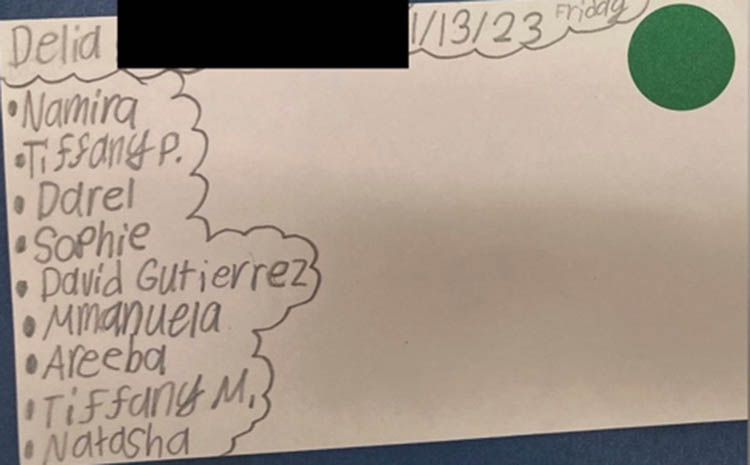
Figure 2
Example notecard from students participating in the activity, showing the list of contacts and a sticker indicating exposure to the simulated infectious disease (January 13, 2023, 5th Grade Classroom).
Source: Author’s contribution.
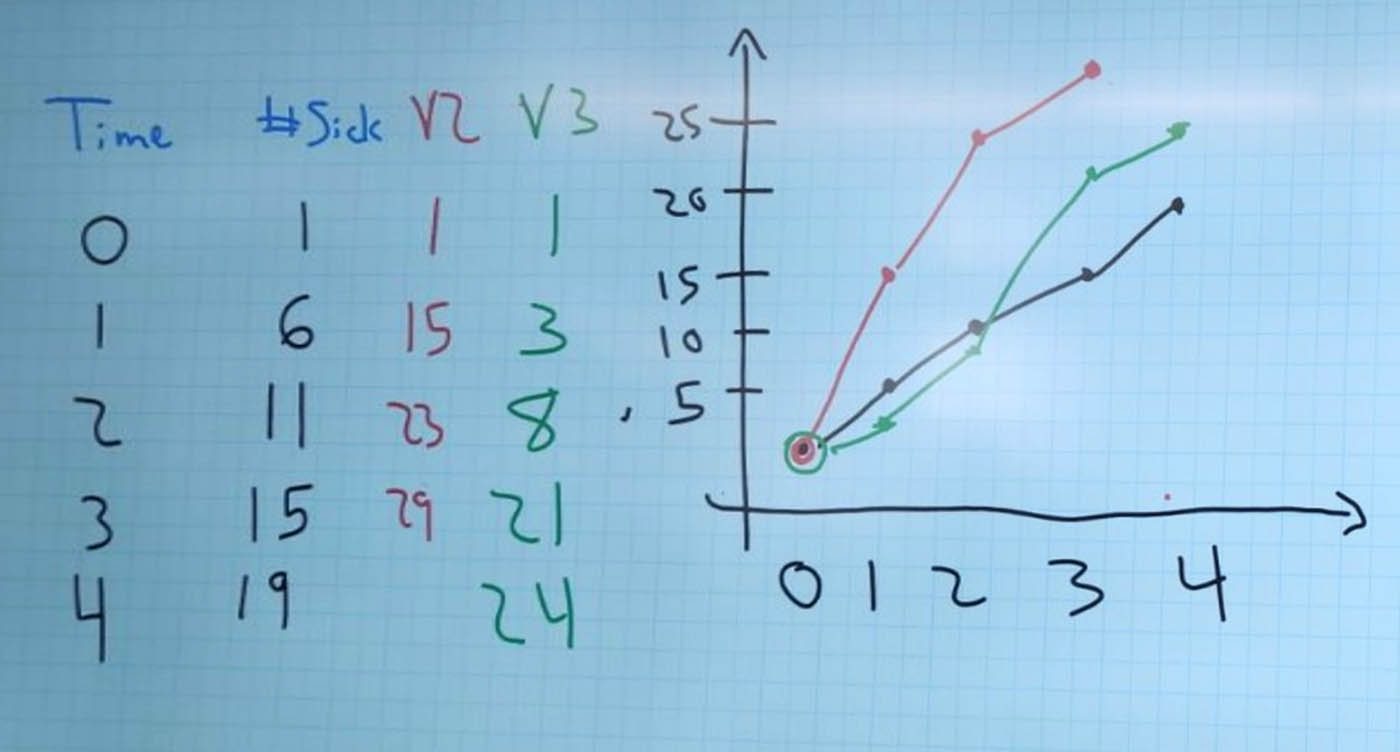
Figure 3
Graphing three different classroom epidemic curves, plotted side-by-side for comparison (October 17, 2023, 10th grade classroom).
Source: Author’s contribution.
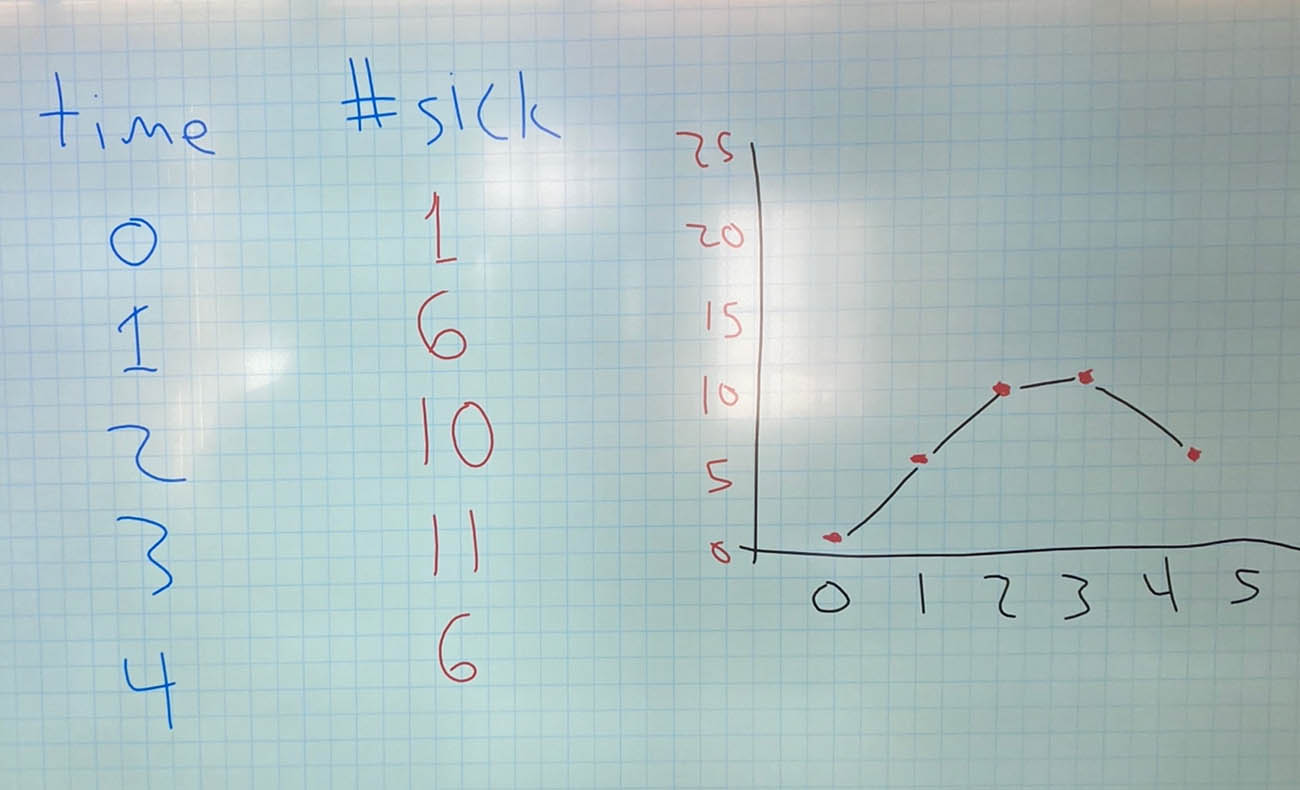
Figure 4
Graph of epidemic curves using a new set of rules, this time allowing “medics” to cure students by removing their stickers (November 14, 2023, 10th grade classroom).
Source: Author’s contribution.