
1. Introduction
The “high five game” is a classroom activity for introducing students to the epidemiological concept of disease outbreaks and uses a simple role-playing game to simulate how infectious diseases spread through contact networks. This activity mimics an agent-based susceptible-infected-recovered (SIR) model of disease transmission, with the students themselves acting as the individual agents.
This lesson plan was initially developed during the 2022–2023 school year through the New York Academy of Sciences Scientist-in-Residence program for a fifth grade (students ages 10–11) science classroom, adapted from a NOVA Online curriculum for teachers on the 1918 influenza epidemic (NOVA Online Teachers n.d.). During the 2023–2024 school year, a similar lesson plan was further developed for a tenth grade (students ages 15–16) biology classroom.
2. Goals
The “high five game” activity is designed to illustrate how contact networks facilitate transmission of disease, and how one can use a simulation game to understand infectious disease outbreaks. The activity serves as an introduction to epidemiological concepts such as contact networks, person-to-person transmission of infectious disease, and disease outbreaks. The activity may also serve as an introduction to using simulations to investigate real-world scientific questions. It is flexible enough to be transportable to many different classroom contexts, including biology, health, general science, math, or computer science.
The SIR model represents how infectious disease can spread through a susceptible population. In its most basic form, it can be expressed as a set of ordinary differential equations, which describes a well-mixed, uniform population and tracks the trajectory of an outbreak of disease (Keeling & Rohani, 2011):
In the aforementioned set of equations, represent the numbers of susceptible, infected, and recovered members of the total population , respectively; the parameter represents the per-contact transmission rate; and the parameter represents the recovery rate. As long as the ratio , the infection will spread faster than infected people can recover and the model will demonstrate an outbreak (Figure 1).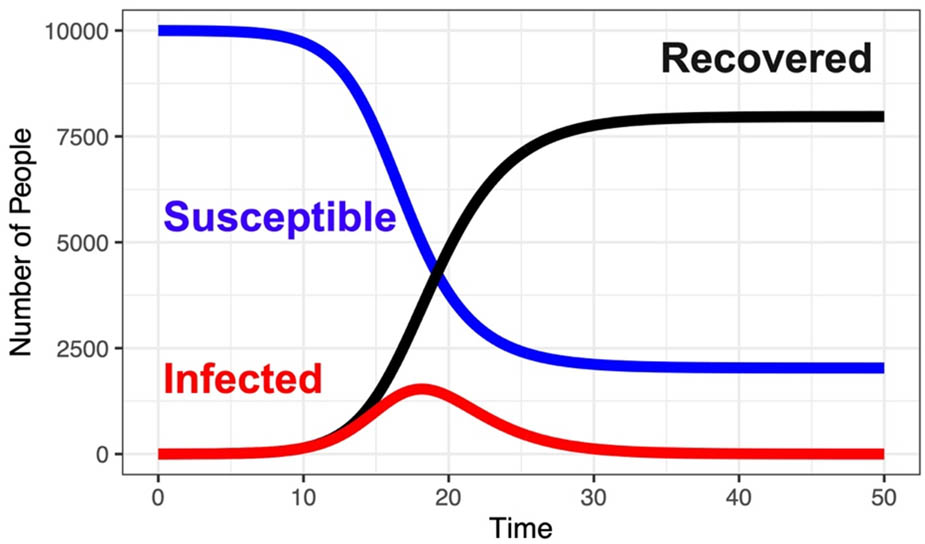
Figure 1
Example SIR model trajectories illustrating the course of an infectious disease outbreak (“Infected”), with and .
Source: Author’s contribution.
To capture the heterogeneity of the population, this model may be adapted as an agent-based model, in which the population is represented as a group of individual agents and the infection may be transmitted from one agent to another through a direct interaction (Perez and Dragicevic, 2009). Such interactions may be considered as forming a contact network, which serves to facilitate the transmission of disease from person to person (Barrat et al., 2008; Newman, 2018).
The “high five game” is designed to replicate an SIR-type agent-based simulation model in which the students act as the agents. The act of participating in the game allows them to role-play an outbreak of disease, all while replicating the mathematical process, which one might investigate with a computer simulation.
3. Setup
This activity requires index cards or notebook paper, stickers which adhere to the cards, and a whiteboard for plotting data and facilitating discussion. To begin, each student is given a notecard and instructed to write their name at the top of the card. Next, instructors inform students about the rules of the game.
4. Procedure
All students begin without a sticker on their notecard (“susceptible”) except for one student who is chosen in secret by the instructor (“infected”). The instructor announces that the game has started, and students then spend 1 min mingling around the classroom and either high five (or shake hands) with their classmates. Each time they high five another classmate, they pause and write the name of that classmate on their notecard, recording each high five as a contact. If they encounter someone with a sticker on their notecard, they then add a sticker to their own notecard (Figure 2). After two subsequent handshakes, a student with a sticker loses their infectiousness (“recovery”) and crosses out their sticker. In this way, the spread of stickers through the class (“stickerpox”) emulates how an infectious disease might similarly spread through the class.
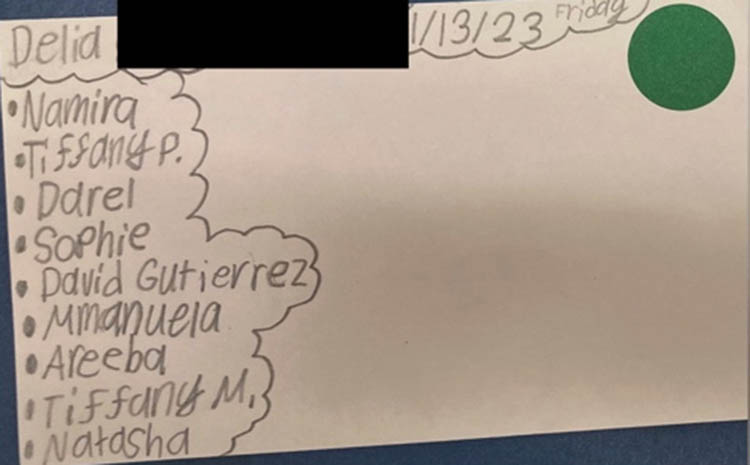
Figure 2
Example notecard from students participating in the activity, showing the list of contacts and a sticker indicating exposure to the simulated infectious disease (January 13, 2023, 5th Grade Classroom).
Source: Author’s contribution.
At the end of 1 min, the instructor announces a pause to the game. All students close their eyes and students with stickers raise their hands to be counted. The instructor counts the number of students who have been infected and records the number on the whiteboard (Figure 3). The game then continues for 3–4 rounds or until everyone has become infected.
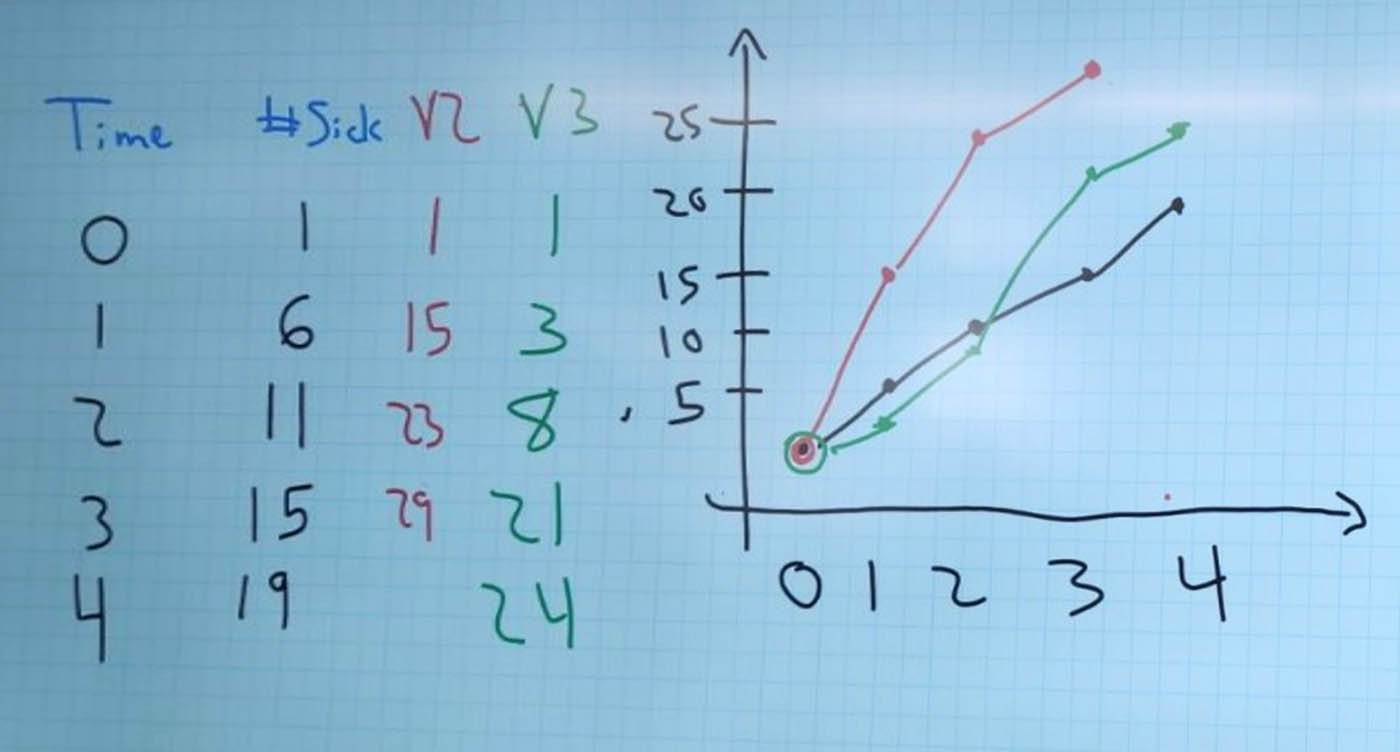
Figure 3
Graphing three different classroom epidemic curves, plotted side-by-side for comparison (October 17, 2023, 10th grade classroom).
Source: Author’s contribution.
At the end of the game, students are then asked to think-pair-share and reflect on the experience of playing the game, as well as what they notice about the collected data.
For the second part of the activity, students are then asked to think up a new rule to add to the game. Examples of new rules that students came up with in the past versions of this classroom activity include: allowing some students to “vaccinate” and acquire immunity against stickers; assigning one student to be a “medic,” who “cures” infected classmates that they encounter (Figure 4); and varying the duration of the infection such that the infectious period lasts longer or shorter. It is recommended that students be allowed to be creative – this is their opportunity to experiment with designing the game themselves – but instructors may take care to discourage rules that would make the game much more difficult (or unsafe) to play. After discussing and voting on the new rule, students then write down a hypothesis for how the epidemic will proceed differently with the new rule. The students then participate in the game a second time, reflect on the outcome of the second round of the game, and decide whether to accept or reject their hypotheses.
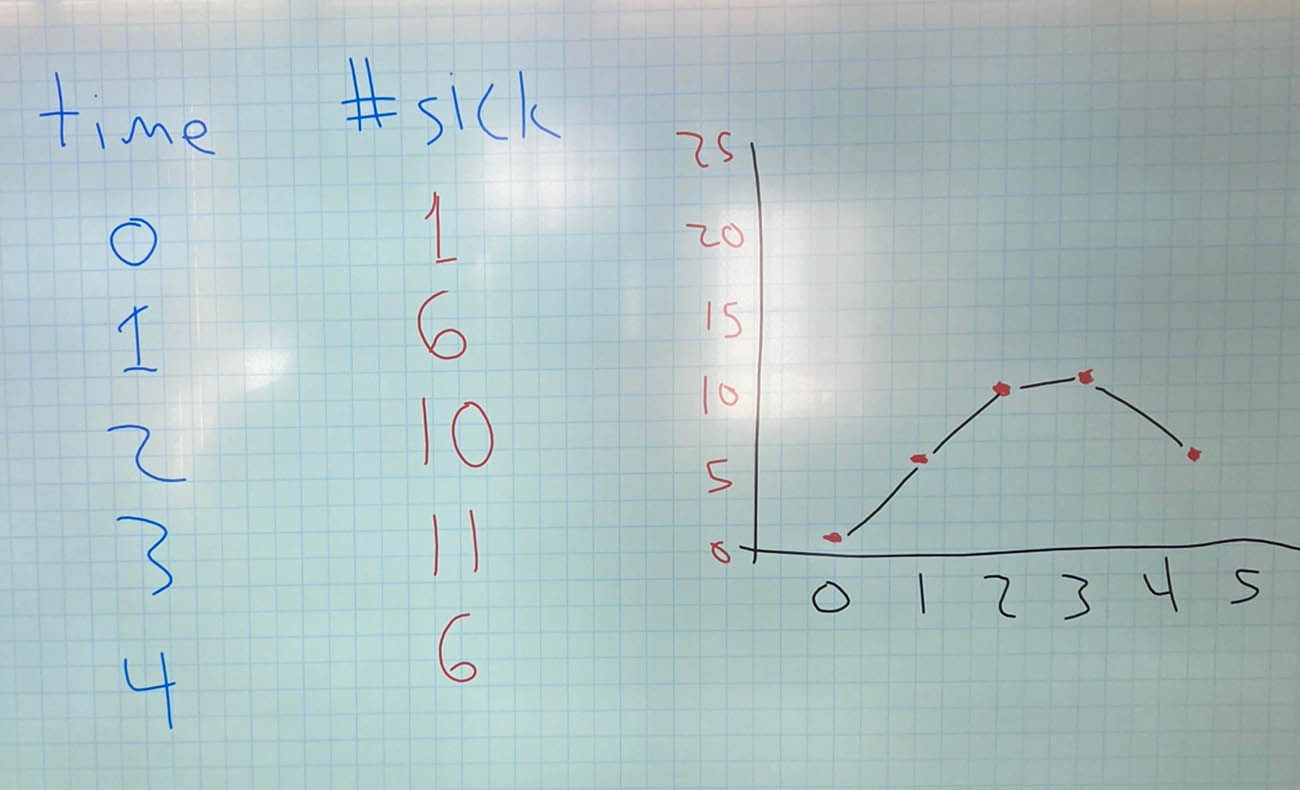
Figure 4
Graph of epidemic curves using a new set of rules, this time allowing “medics” to cure students by removing their stickers (November 14, 2023, 10th grade classroom).
Source: Author’s contribution.
If the instructor wants to continue to build on this exercise, further activities could include recreating and visualizing the contact network outlined on students’ notecards, and using contact tracing to trace the history of the sticker epidemic through the class. This activity may also serve as an introduction to inquiry through computer simulations, where advanced students with sufficient programming skills may be invited to replicate the classroom simulation using a computer program.
5. Lessons
There are two main lessons, which the instructor may draw from this exercise. The first is the concept of how person-to-person transmission of disease through a contact network can lead to an epidemic. The dynamics of the SIR model and activity have far-reaching consequences in public health relating to how scientists understand and work to stop infectious disease outbreaks. Second, the act of making and testing a hypothesis about the outcome of a game serves as an introduction to using simulation tools to investigate real-world scientific problems: the instructor may emphasize that the students are playing a game, the rules of that game define the simulated reality, and the outcome of the game reflects the chosen rules. Depending on the classroom context and how advanced the students are, the instructor may choose to where to focus the lesson.
6. Reflections
In my experience leading this activity in classrooms, the biggest challenge to successfully executing the activity is making sure the game is not too complicated; all students need to know the rules of the game and understand how to participate. It is recommended to start with a simplified version of the game and add more complexity in later rounds of the game (e.g., starting with an SI model without recovery). This is particularly important with younger students for whom learning and playing new games may come as a challenge.
Students were excited to participate in this activity because of the novelty as well as the active engagement involved with mingling around the classroom with their classmates. One other way for instructors to bring students to engage with the material would be to discuss the sociobehavioral aspects of the exercise: Which students were actively trying to become infected, and which students were actively trying to avoid it? Helping students see and understand the wide variety of behaviors or strategies adopted while playing the game may spark discussions around important social and political aspects of real-world disease outbreaks.
One final consideration for instructors is how to center this classroom activity around real-world outbreaks of disease. When this was taught to high schoolers (ages 15–16) in 2023, the instructors did introduce epidemiological concepts – particularly the collection of epidemiological data – through a discussion of New York City’s COVID-19 dashboards and the timeline of the COVID-19 epidemic in New York City (Respiratory Illness Data., n.d.). Starting with this added context may help ground students in their real-world experiences.
Acknowledgments
I would like to acknowledge Rosalyn Macheras and Rocheli Apilan for welcoming me into their classrooms and assisting with organizing and teaching this lesson plan, as well as support from Adrienne Umali and Rea Ruiz from the New York Academy of Sciences.
Funding information
This work was supported through the New York Academy of Sciences Scientist-in-Residence program.
Author contributions
DTC designed the activity and wrote the manuscript.
Conflict of interest statement
No competing interests to disclose.
Data availability statement
Data available on request from the authors.