
Table 1
Summary of theoretically informed research questions.
| DNT concept | Research question |
|---|---|
| Mentor network structures including churn can evolve over time | To what degree do students’ mentor networks churn/change over 6 months (fall to spring semesters)? |
| Mentee factors, such as developmental stage and the perceived need for mentoring, may influence network formation and maintenance | To what degree is churn related to students’ college rank (i.e., a proxy for developmental stage), the size of their pre-existing mentor network, their interest in the earth and environmental sciences, or their intentions to persist in a STEM career (i.e., proxies for perceived need for mentoring)? |
| Environments that encourage or afford more mentorship opportunities should influence networks | To what degree is churn related to institutional or major-based differences (i.e., proxies for environmental influences)? |
| Person–environment fit processes, such as person–environment fit, influence networks | To what extent is churn related to students’ sense of belonging at their university, their perceptions of the opportunities a career in STEM offers for achieving goals such as serving or helping others (i.e., communal goals) or gaining recognition and success (i.e., agentic goals), and the degree of a mismatch or misalignment between their personally valued goals (communal/agentic) and perceived goal affordances from STEM careers (proxies for person–environment fit)? |
Source: Authors’ contribution.
Table 2
Summary of sample characteristics (N = 184).
| Characteristics | n | % |
|---|---|---|
| Racial/ethnic descent | ||
| African | 13 | 7.07 |
| Asian | 12 | 6.52 |
| European | 104 | 56.52 |
| Hispanic | 10 | 5.43 |
| Native American/Pacific Islander | 2 | 1.09 |
| Multiracial/ethnic | 28 | 15.22 |
| Prefer to not say | 15 | 8.15 |
| Parental highest level of education | ||
| High school graduate | 16 | 8.70 |
| Some college | 20 | 10.87 |
| Associates (2-year) degree | 13 | 7.07 |
| Baccalaureate (4-year) degree | 43 | 23.37 |
| Master’s degree | 68 | 36.96 |
| Doctoral degree | 24 | 13.04 |
| Current college rank | ||
| Junior year | 54 | 29.35 |
| Senior year | 100 | 54.35 |
| Fifth year or beyond | 12 | 6.52 |
| Advanced degree | 18 | 9.78 |
| Current major | ||
| Agriculture/natural resources | 11 | 5.98 |
| Biological sciences | 71 | 38.59 |
| Physical sciences | 28 | 15.22 |
| Technology/computer sciences | 8 | 4.35 |
| Engineering | 30 | 16.30 |
| Mathematics/statistics | 3 | 1.63 |
| Environmental sciences | 16 | 8.70 |
| S&E related | 7 | 3.80 |
| Non-STEM | 10 | 5.43 |
| Current university | ||
| Colorado College | 11 | 5.98 |
| Colorado State University | 40 | 21.74 |
| Metropolitan State University of Denver | 9 | 4.89 |
| North Carolina A&T University | 9 | 4.89 |
| North Carolina State University | 24 | 13.04 |
| University of Colorado – Boulder | 23 | 12.50 |
| University of North Carolina – Charlotte | 21 | 11.41 |
| University of South Carolina | 17 | 9.24 |
| University of Wyoming | 11 | 5.98 |
| Other | 19 | 10.33 |
Notes: The current average GPA was 3.36 (SD = 0.50). The sample average family socio-economic status at the time of enrollment in the study was 4.40 (SD = 1.43) on a scale from 1 ($12,000 or below) to 6 ($100,000+).
Source: Authors’ contribution.
Table 3
Summary of descriptive statistics for the mentor network churn and predictors of churn (N = 184).
| Variables | M | SD | Minimum | Maximum | Skew | Kurtosis |
|---|---|---|---|---|---|---|
| Mentor network size | ||||||
| Churn | 0.69 | 0.32 | 0 | 1 | −0.67 | 2.42 |
| Interest in earth/environmental sciences | 4.36 | 2.13 | 1 | 7 | −0.17 | 1.69 |
| Scientific persistence intentions | 5.45 | 1.48 | 1 | 7 | −1.19 | 4.08 |
| Agentic goal affordances in STEM | 6.03 | 1.11 | 1.5 | 7 | −1.49 | 5.47 |
| Agentic goal endorsement | 5.83 | 1.15 | 1 | 7 | −1.20 | 4.68 |
| Agentic goal mismatcha | 0.76 | 0.88 | 0 | 4.5 | 1.80 | 6.70 |
| Communal goal affordances in STEM (CGA) | 5.88 | 1.19 | 2 | 7 | −1.00 | 3.29 |
| Centered CGA2 | 1.42 | 2.15 | 0.16 | 15.02 | 3.65 | 20.21 |
| Communal goal endorsement | 6.34 | 0.97 | 3 | 7 | −1.57 | 4.99 |
| Communal goal mismatcha | 0.75 | 0.98 | 0 | 5 | 1.83 | 6.78 |
| University belonging | 5.25 | 1.14 | 1 | 7 | −0.91 | 3.97 |
| Baseline mentor network size (MNS) | 2.04 | 1.49 | 0 | 5 | 0.39 | 2.33 |
| Centered MNS2 | 2.22 | 2.56 | 0.00 | 8.74 | 1.34 | 3.96 |
| Follow-up mentor network size | 2.15 | 1.44 | 0 | 5 | 0.16 | 2.23 |
Note: aMeasured as the absolute values of the difference score between endorsements and affordances, so higher scores indicate greater misfit.
Source: Authors’ contribution.
Table 4
Summary of pairwise correlations between mentor network churn and predictors of churn (N = 184).
| Variables | 1. | 2. | 3. | 4. | 5. | 6. | 7. | 8. | 9. | 10. | 11. |
|---|---|---|---|---|---|---|---|---|---|---|---|
| 1. Churn | – | ||||||||||
| 2. Interest in earth/environmental sciences | −0.14 | — | |||||||||
| 3. Scientific persistence intentions | −0.19* | 0.30* | — | ||||||||
| 4. Agentic goal affordances in STEM | −0.12 | 0.23* | 0.44* | — | |||||||
| 5. Agentic goal mismatcha | 0.03 | −0.06 | −0.30* | −0.41* | — | ||||||
| 6. Communal goal affordances in STEM (CGA) | 0.01 | 0.15* | 0.33* | 0.54* | −0.26* | — | |||||
| 7. CGA2 | 0.13 | −0.18* | −0.26* | −0.42* | 0.12 | −0.66* | — | ||||
| 8. Communal goal mismatcha | −0.002 | −0.22* | −0.38* | −0.44* | 0.31* | −0.72* | 0.61* | — | |||
| 9. University belonging | −0.11 | 0.19* | −0.20* | 0.15* | −0.16* | 0.16* | −0.13 | −0.17* | — | ||
| 10. Baseline mentor network size (MNS) | −0.31* | 0.17* | 0.22* | 0.17* | −0.19* | 0.14 | −0.11 | −0.14 | 0.13 | — | |
| 11. MNS2 | 0.21* | 0.14 | −0.02 | 0.05 | −0.10 | 0.11 | −0.05 | −0.07 | −0.03 | 0.34* | — |
Note: aMeasured as the absolute values of the difference score, so higher scores indicate greater misfit, *p < 0.05.
Source: Authors’ contribution.
Table 5
Summary of regression coefficients predicting mentor network churn (N = 184).
| Predictors | β | b | SERobust | 95% CI [LL, UL] |
|---|---|---|---|---|
| Interest in earth/environmental sciences | −0.10 | −0.01 | 0.01 | [−0.04, 0.01] |
| Scientific persistence intentions | −0.08 | −0.02 | 0.02 | [−0.06, 0.02] |
| Agentic goal affordances in STEM | −0.03 | −0.01 | 0.03 | [−0.06, 0.05] |
| Agentic goal mismatch | −0.05 | −0.02 | 0.03 | [−0.08, 0.04] |
| Communal goal affordances in STEM (CGA) | 0.07 | 0.02 | 0.03 | [−0.05, 0.08] |
| CGA2 | 0.24* | 0.034 | 0.015 | [0.004, 0.065] |
| Communal goal mismatch | −0.21 | −0.07 | 0.04 | [−0.15, 0.01] |
| University belonging | −0.05 | −0.01 | 0.02 | [−0.06, 0.03] |
| Baseline mentor network size (MNS) | −0.43*** | −0.091 | 0.015 | [−0.120, −0.063] |
| MNS2 | 0.33*** | 0.040 | 0.009 | [0.022, 0.059] |
| Current college rank | ||||
| Junior yeara | −0.03 | −0.02 | 0.06 | [−0.13, 0.09] |
| Fifth year or beyonda | 0.05 | 0.07 | 0.11 | [−0.14, 0.28] |
| Advanced degreea | 0.01 | 0.01 | 0.13 | [−0.25, 0.26] |
| Current major | ||||
| Agriculture/natural resourcesb | 0.001 | 0.001 | 0.08 | [−0.16, 0.16] |
| Physical sciencesb | −0.13 | −0.11 | 0.08 | [−0.27, 0.05] |
| Technology/computer sciencesb,d | 0.14* | 0.209 | 0.080 | [0.050, 0.368] |
| Engineeringb | 0.08 | 0.06 | 0.07 | [−0.08, 0.21] |
| Mathematics/statisticsb | −0.03 | −0.07 | 0.39 | [−0.83, 0.69] |
| Environmental sciencesb | 0.17 | 0.19 | 0.10 | [−0.004, 0.39] |
| S&E relatedb | 0.01 | 0.01 | 0.11 | [−0.21, 0.24] |
| Non-STEMb | −0.03 | −0.05 | 0.14 | [−0.31, 0.22] |
| Current university | ||||
| Colorado Collegec | −0.03 | −0.04 | 0.12 | [−0.27, 0.20] |
| Metropolitan State University of Denverc | −0.11 | −0.16 | 0.13 | [−0.41, 0.08] |
| North Carolina A&T Universityc | 0.09 | 0.13 | 0.09 | [−0.05, 0.30] |
| North Carolina State Universityc | −0.09 | −0.08 | 0.08 | [−0.24, 0.07] |
| University of Colorado – Boulderc | −0.10 | −0.09 | 0.08 | [−0.25, 0.06] |
| University of North Carolina – Charlottec | −0.15 | −0.14 | 0.12 | [−0.38, 0.09] |
| University of South Carolinac | −0.04 | −0.05 | 0.12 | [−0.28, 0.19] |
| University of Wyomingc | −0.07 | −0.09 | 0.12 | [−0.33, 0.14] |
| Otherc | −0.08 | −0.08 | 0.13 | [−0.34, 0.17] |
| Intercept | 0.60 | 0.08 | [0.45, 0.75] | |
Note: The regression model test was F(30, 153) = 6.26, p < 0.001, R 2 = 0.36. SERobust are for the unstandardized coefficient (b). aComparison versus senior year in college. bComparison versus biological sciences. cComparison versus Colorado State University. dSensitivity analysis (Cook’s distance) indicated no influential outliers within this subsample. *p < 0.05, **p < 0.01, ***p < 0.001.
Source: Authors’ contribution.
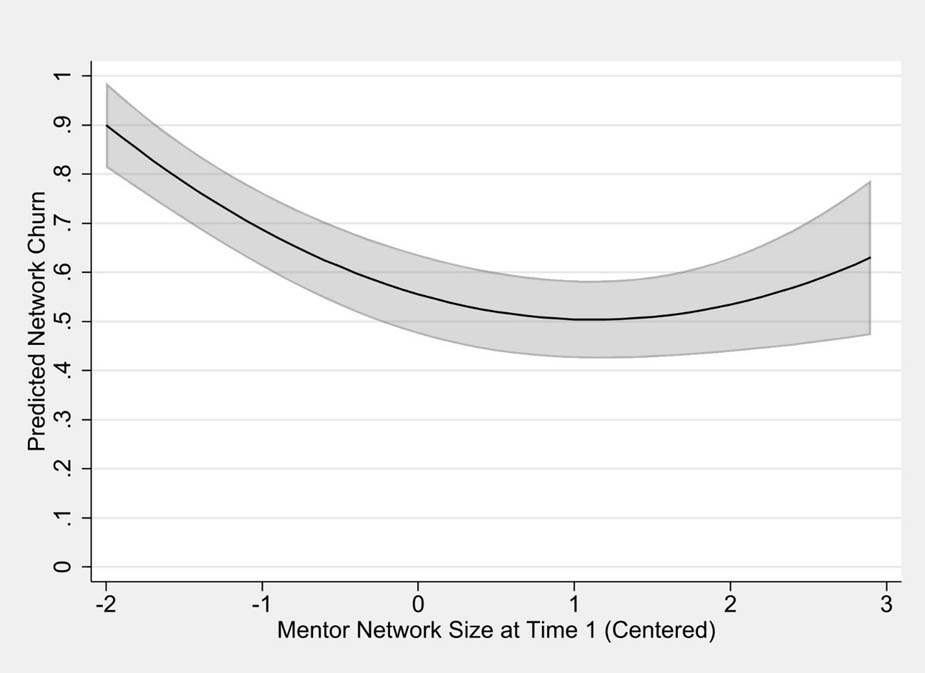
Figure 1
Curvilinear influence of baseline mentor network size on mentor network churn. Note: The gray area surrounding the black predicted network churn line represents 95% confidence bands.
Source: Authors’ contribution.
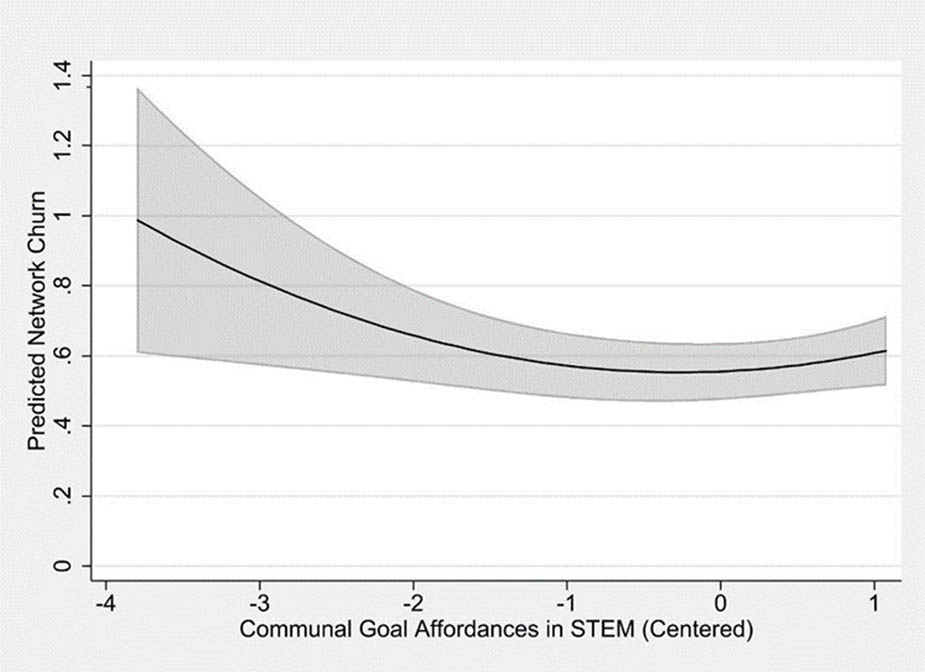
Figure 2
Curvilinear influence of perceived CGAs in STEM on mentor network churn. Note: The gray area surrounding the black predicted network churn line represents 95% confidence bands.
Source: Authors’ contribution.
Table 6
Changes in mentor role composition from time 1 to time 2.
| Mentor role | Time 1 count | Time 2 count | Net change | % Change |
|---|---|---|---|---|
| University faculty | 234 | 256 | +22 | +9.4 |
| Professional (non-university) | 121 | 140 | +19 | +15.7 |
| Graduate student | 25 | 41 | +16 | +64.0 |
| Postdoc | 10 | 9 | −1 | −10.0 |
| Undergraduate student | 10 | 8 | −2 | −20.0 |
| Other | 28 | 20 | −8 | −28.6 |
Note: Net Change represents the aggregate difference in total mentions of each role across all participants.
Source: Authors’ contribution.