
1. Introduction
Mentoring relationships can be pivotal to a person’s personal and professional success (Eby et al., 2008). These relationships emphasize helping a person grow and accomplish goals, providing psychosocial support (e.g., empathy and counseling), offering career-related support (e.g., opportunities for skill development), being an inspirational role model for how to achieve success, and protecting the person from negative experiences (Hernandez, 2018). Recent research highlights the importance of mentorship for recruiting, developing, and retaining students in science, technology, engineering, and mathematics (STEM), particularly for students from historically underrepresented groups in STEM fields.
Most people graduating with STEM degrees and matriculating into STEM careers are men. Despite making up 57.3% of bachelor’s degree recipients in the United States, only 38.6% of STEM undergraduate degrees and 32.4% of graduate degrees in STEM are awarded to women. Nearly half (49.2%) of women who intend to major in STEM as a first-year student end up switching to a non-STEM major, compared to 32.5% of men (National Science Foundation, 2019). Further, women make up less than a third (29.2%) of the STEM workforce across the globe (World Economic Forum, 2024). Several studies indicate that persons from underrepresented groups in STEM fields, including women, report feeling invisible, isolated, and undervalued as students and throughout their careers (Bloodhart et al., 2020; Jiang, 2021; Walton & Cohen, 2007).
Unsurprisingly, this underrepresentation is propagated into academia, with only 36.6% of full-time STEM faculty members being women (National Science Foundation, 2019). As a result, undergraduate STEM students who are women do not have the same access to robust support networks and social capital critical to academic success and career advancement as students who are men (Mishra, 2020). Students often access social support and social capital through networks whose members consist of similar-background role models, mentors, and other high-status/influential people (Byars-Winston et al., 2019; Feeney & Bernal, 2010; Hernandez et al., 2023; Saw, 2020). On the contrary, students who lack role models and mentors face reductions in satisfaction, self-efficacy, engagement, and achievement (Kricorian et al., 2020; Syed et al., 2019).
2. Social network theory and network dynamics
A social network perspective can inform our understanding of these demographic disparities and identify paths toward remediation (Mishra, 2020). Social network theory (SNT) posits that individuals are embedded in a web of relationships that simultaneously constrain and provide opportunities (Borgatti et al., 2018). These networks possess dynamic dimensions including structure (the architectural patterns of ties), function (the types of support exchanged), strength (intensity of bonds), and content (attitudes/beliefs) (Perry et al., 2018). While static network measures provide a snapshot of support, they fail to capture the dynamic nature of the undergraduate experience.
Dynamic network analysis allows for the observation of “turnover,” or the entry and exit of members within a network over time. This turnover is quantified as network churn, defined as “a proportional measure of instability as a function of total network size” (Perry et al., 2018, p. 255). A churn score ranges from 0 (perfect stability) to 1 (complete turnover).
A critical theoretical tension exists regarding the implications of network churn for students. Traditionally, SNT suggests that network stability is crucial for fostering trust and consistent psychosocial support, which are essential for belonging in STEM (Walton & Cohen, 2007). From this perspective, high churn could be viewed as “relational instability,” signaling a failure to retain supportive mentors. However, we argue that network churn is not inherently maladaptive. Recent work on network oscillation supports this view. Burt and Merluzzi (2016) demonstrated that networks naturally fluctuate between states of closure (dense, cohesive ties providing trust and support) and brokerage (sparser ties that bridge structural holes and provide access to novel information). They found that this oscillation (i.e., the dynamic movement between network states) is associated with positive career outcomes. In this case, dropping connections within mentor networks may not be negative; it often shows that students are outgrowing their peer groups and moving toward professional mentors who can better help their careers and professional development. As students advance from introductory coursework to specialized major requirements, their mentorship needs evolve from general social support (often provided by peers or family) to specific career guidance (provided by faculty and professionals) (Baker & Lattuca, 2010). Thus, high mentor network churn may represent a dual process: “pruning” ties that no longer fit evolving needs while simultaneously “adding” new ties that offer instrumental career value. By combining these added and dropped nodes into a single index, we capture a snapshot of this developmental restructuring effort. For example, Siciliano et al. (2018) found that while maintaining existing ties (exploitation) predicted higher quantity of output for scientists, exploring new ties (exploration) predicted higher quality work.
3. Developmental network theory
To explore factors that may be associated with these network changes, we turn to developmental network theory (DNT). DNT integrates mentorship and social network theories, positing that mentee factors (e.g., career stage), environmental factors (e.g., organizational contexts), and person-environment fit shape the structure of a student’s network (Dobrow et al., 2012; Higgins & Kram, 2001). While mentee and environmental factors provide the structural context for development, to operationalize person–environment fit, we examine sense of belonging and goal congruity.
Belonging serves as a foundational indicator of social integration; we hypothesize that students with low belonging may actively restructure their networks (churn) to find mentors who can provide the necessary psychosocial support to validate their place in the institution (Strayhorn, 2018). Complementing this, we draw on the goal congruity theory (Diekman et al., 2010, 2017), which posits that students persist in fields that afford the attainment of their valued goals. Research consistently demonstrates that women in STEM tend to endorse communal goals (working with and helping others) more highly than men, yet often perceive STEM careers as impeding these goals in favor of agentic goals (power, achievement, and individualism) (Brown et al., 2015). This discrepancy creates a ‘Goal Mismatch.’ We hypothesize that network churn may be a behavioral response to this mismatch: students perceiving a lack of fit may destabilize their networks as they seek new mentors who can model how to align communal values with scientific success.
Although a nascent body of research has applied DNT to STEM retention (e.g., Hernandez et al., 2020), less attention has been paid to the factors that influence the dynamics of these networks over time. Existing research has focused largely on static structures, such as network size or density (Pedersen et al., 2024). No previous investigations have examined how mentee, environmental, and person–environment fit characteristics influence the network churn in STEM contexts.
4. Current study
Most studies using SNA to examine mentorship networks are cross-sectional and have not considered network churn as part of the developmental process (e.g., Hernandez et al., 2023; Pedersen et al., 2024). This exploratory analysis fills this gap by examining short-term mentorship network churn over a 6-month period among undergraduate women in STEM. Given that our data include only two time points, we characterize this as an analysis of short-term network turnover rather than a comprehensive examination of long-term change processes. We aim to consider whether churn may represent a loss of support or an expansion of resources by examining not only the rate of churn but also the compositional nuances of network evolution (i.e., the specific professional roles of added versus dropped mentors).
Informed by DNT, this study addresses four research questions. We selected specific independent variables to serve as proxies for the DNT constructs of mentee, environmental, and person–environment fit factors.
Research Question 1 asks: To what degree do students’ mentor networks churn/change over six months? Beyond the aggregate rate of turnover, we also examine the nature of this change to determine if students are transitioning toward more professionalized mentorship structures.
Research Question 2 asks: To what degree is churn related to developmental stage (college rank) and perceived need for mentoring (network size, STEM persistence, interest)? We hypothesize that as students progress in rank (developmental stage), their support needs shift from general psychosocial adjustment to specific career-entry strategies, potentially necessitating a change in mentors. Similarly, students with higher persistence intentions or specific discipline interests (e.g., in Earth/Environmental Sciences, the focus of the recruitment context) may exercise greater agency in optimizing their networks, leading to higher churn.
Research Question 3 asks: To what degree is churn related to institutional or major-based differences? We examine these variables to account for structural variations in mentorship availability across different university settings and STEM disciplines.
Research Question 4 asks: To what extent is churn related to person–environment fit (belonging, goal affordances, and goal mismatch)? We focus specifically on communal goal affordance (CGA) and goal mismatch because women in STEM frequently report a conflict between their prosocial values and the perceived solitary culture of science. We hypothesize that students perceiving a poor fit (low CGA or high mismatch) may be associated with greater network instability as they struggle to find mentors who align with their values (Table 1).
Table 1
Summary of theoretically informed research questions.
| DNT concept | Research question |
|---|---|
| Mentor network structures including churn can evolve over time | To what degree do students’ mentor networks churn/change over 6 months (fall to spring semesters)? |
| Mentee factors, such as developmental stage and the perceived need for mentoring, may influence network formation and maintenance | To what degree is churn related to students’ college rank (i.e., a proxy for developmental stage), the size of their pre-existing mentor network, their interest in the earth and environmental sciences, or their intentions to persist in a STEM career (i.e., proxies for perceived need for mentoring)? |
| Environments that encourage or afford more mentorship opportunities should influence networks | To what degree is churn related to institutional or major-based differences (i.e., proxies for environmental influences)? |
| Person–environment fit processes, such as person–environment fit, influence networks | To what extent is churn related to students’ sense of belonging at their university, their perceptions of the opportunities a career in STEM offers for achieving goals such as serving or helping others (i.e., communal goals) or gaining recognition and success (i.e., agentic goals), and the degree of a mismatch or misalignment between their personally valued goals (communal/agentic) and perceived goal affordances from STEM careers (proxies for person–environment fit)? |
Source: Authors’ contribution.
5. Methods
5.1. Participants
Data for this study were collected as part of a larger, multiyear National Science Foundation–funded initiative designed to increase the retention and persistence of women in the Earth and Environmental Sciences (EES). The program recruited undergraduate women from broad STEM disciplines (biology, chemistry, engineering) who expressed interest in EES careers to participate in a semester-long mentoring and professional development intervention designed to expose them to EES career pathways. The participants for this study were recruited in the Fall semesters of 2015 (Cohort 1) and 2016 (Cohort 2) as part of a larger project that aimed at studying and promoting women’s retention in STEM. At the time of recruitment, the 484 participants were undergraduates majoring (or intending to major) in a STEM discipline from nine universities in the Colorado/Wyoming Front Range and North/South Carolinas. The observations used in the current study were extracted from survey responses administered in the Fall semester of 2018 and the Spring semester of 2019 (named T1 and T2 hereafter for simplicity). These two time points were the survey administrations that included an ego-centric mentor network questionnaire. The analytical sample size for this study consists of 184 college women (19.6% first generation). At T1, most participants were in their senior year of college (n = 100, 54.3%). Other demographics are listed in Table 2.
Table 2
Summary of sample characteristics (N = 184).
| Characteristics | n | % |
|---|---|---|
| Racial/ethnic descent | ||
| African | 13 | 7.07 |
| Asian | 12 | 6.52 |
| European | 104 | 56.52 |
| Hispanic | 10 | 5.43 |
| Native American/Pacific Islander | 2 | 1.09 |
| Multiracial/ethnic | 28 | 15.22 |
| Prefer to not say | 15 | 8.15 |
| Parental highest level of education | ||
| High school graduate | 16 | 8.70 |
| Some college | 20 | 10.87 |
| Associates (2-year) degree | 13 | 7.07 |
| Baccalaureate (4-year) degree | 43 | 23.37 |
| Master’s degree | 68 | 36.96 |
| Doctoral degree | 24 | 13.04 |
| Current college rank | ||
| Junior year | 54 | 29.35 |
| Senior year | 100 | 54.35 |
| Fifth year or beyond | 12 | 6.52 |
| Advanced degree | 18 | 9.78 |
| Current major | ||
| Agriculture/natural resources | 11 | 5.98 |
| Biological sciences | 71 | 38.59 |
| Physical sciences | 28 | 15.22 |
| Technology/computer sciences | 8 | 4.35 |
| Engineering | 30 | 16.30 |
| Mathematics/statistics | 3 | 1.63 |
| Environmental sciences | 16 | 8.70 |
| S&E related | 7 | 3.80 |
| Non-STEM | 10 | 5.43 |
| Current university | ||
| Colorado College | 11 | 5.98 |
| Colorado State University | 40 | 21.74 |
| Metropolitan State University of Denver | 9 | 4.89 |
| North Carolina A&T University | 9 | 4.89 |
| North Carolina State University | 24 | 13.04 |
| University of Colorado – Boulder | 23 | 12.50 |
| University of North Carolina – Charlotte | 21 | 11.41 |
| University of South Carolina | 17 | 9.24 |
| University of Wyoming | 11 | 5.98 |
| Other | 19 | 10.33 |
Notes: The current average GPA was 3.36 (SD = 0.50). The sample average family socio-economic status at the time of enrollment in the study was 4.40 (SD = 1.43) on a scale from 1 ($12,000 or below) to 6 ($100,000+).
Source: Authors’ contribution.
6. Procedure
The participants were recruited via listserv emails, on-campus flyers, or in-classroom announcements. They completed an informed consent form and an application survey to express interest in the project. At the time of recruitment, students were invited to participate in the project if they met the following criteria: (1) aged 18 years and older, (2) majoring (or intending to major) in a STEM discipline, (3) interested in earth/environmental sciences, and (4) identified as female. They were invited to a professional development workshop to promote their interest and resilience in STEM disciplines (Hernandez et al., 2017). Following the workshop, participants were introduced to a local earth/environmental science mentor and encouraged to connect with mentors and peers from the workshop. The participants were surveyed once each Fall/Spring semester following the workshop for up to 4 years.
7. Measures
7.1. Social network churn (outcome)
Participants were asked to complete an ego-centric mentor network questionnaire at T1 and T2. First, participants read a definition of a mentor as “someone who provides guidance, assistance, and encouragement on professional and academic issues. A mentor is more than an academic advisor and is someone you turn to for guidance and assistance beyond selecting classes or meeting academic requirements” (Hernandez et al., 2023). With this definition in mind, they were asked if there were any persons they considered to be a career mentor, and if “Yes,” they were asked to name up to five career mentors. Based on this information, social network churn was used to capture turnover in mentoring networks over time. Churn was calculated based on the formula:
where Nd refers to the number of mentors dropped between time points, Na represents the number of mentors added from T1 to T2, and Nu refers to the number of unique mentors in T1 and T2 (Perry et al., 2018).7.2. Baseline mentor network size
Participants were asked to indicate up to five people they considered mentors. The baseline mentor network size was calculated based on the total number of mentors nominated at T1. We examined the potential for a ceiling effect and found that only 9.2% (n = 20) of the sample reported five network members. A sensitivity analysis excluding these participants yielded results consistent with the full model; therefore, they were retained in the final analysis.
7.3. Communal/agentic goal affordance, endorsement, and mismatch
Goal affordance in STEM refers to the perception of how a career in STEM can fulfill agentic goals (agentic goal affordance) or communal goals (CGA). These two constructs were measured at T1 by a two-item scale (Smith et al., 2015), see item content in Supplemental Table S1. Participants expressed their perception of goal fulfillment from 1 (not at all important) to 7 (extremely important). Example statements would be “Please rate how much a career in science, technology, engineering or mathematics would fulfill the following goals – achievement” for the agentic goal and “Please rate how much a career in science, technology, engineering or mathematics would fulfill the following goals – helping others” for the communal goal. The responses were averaged to form a composite score, which showed acceptable levels of correlation between the agentic (r = 0.63) and the communal (r = 0.80) items.
Goal endorsement refers to the extent to which a person values agentic goals (agentic goal endorsement) or communal goals (communal goal endorsement). These two constructs were measured at T1 by a two-item scale (Smith et al., 2015). Participants rated the extent to which they value the goals from 1 (not at all important) to 7 (extremely important). An example statement is, “Please rate how important each of the following kinds of goals is to you personally – achievement.” The item responses were averaged to derive a composite score, which showed acceptable correlations between the agentic (r = 0.62) items and the communal (r = 0.79) items.
Goal mismatch refers to the difference between goal affordance and goal endorsement. Agentic goal mismatch was calculated by taking the absolute value of the difference in the two related composite scores (i.e., agentic goal affordance and agentic goal endorsement). Similarly, communal goal mismatch was calculated by the absolute value of the difference between the CGA and the communal goal endorsement. A higher value means a higher mismatch in these two constructs.
7.4. Interest in earth/environmental sciences
Interest in earth/environmental sciences was measured at T1 by a two-item scale (Adapted from Hulleman et al., 2010, e.g., “How interested are you in taking courses in Earth Systems or Environmental Sciences?”, items are shown in Supplemental Table S1). Participants rated their interest in taking courses and pursuing careers in Environmental Sciences from 1 (definitely will not) to 7 (definitely will). The response items were averaged to derive a composite score, which showed strong correlation within the interest items (r = 0.87). Given that the study was conducted within the context of a recruitment initiative for EES, this variable was included as a specific indicator of discipline-specific motivation and person-major fit.
7.5. Scientific persistence intentions
Persistence intentions in STEM majors were assessed at T1 using a three-item scale (Schultz et al., 2011; Woodcock et al., 2012; e.g., “What is the likelihood of you obtaining a science-related degree?”, items are shown in Supplemental Table S1). Participants rated their intentions to stay in STEM from 1 (definitely will not) to 7 (definitely will). A composite score was derived by calculating the mean of the response items, which showed acceptable evidence of reliability (α = 0.75).
7.6. University belonging
University belonging was measured at T1 by eight items (Shook & Clay, 2012). Participants were asked to rate the extent to which they agreed with the given statements from 1 (strongly disagree) to 7 (strongly agree). One example statement is, “I feel a sense of belonging to my university” (all items are shown in Supplemental Table S1). The item responses were averaged to derive a composite score, which showed strong evidence of reliability (α = 0.88).
8. Analysis
We used multiple regression analysis in Stata 18.0 (StataCorp, 2023) to examine the relationship between predictors and social network churn. Before conducting the substantive analysis, we examined the missingness pattern and assumptions for multiple regression analysis. For missingness, Little’s test (Little, 1988) was conducted to test the missing completely at random assumption. The result suggested that there is no significant difference between cases with and without missingness. After listwise deletion, the final analytical sample consists of 184 participants.
Because participants were clustered in universities at recruitment, intraclass correlation (ICC) was used to test the independence of observations. The result suggested that the clustering effect was negligible (ICC = 0.003). Seven outliers were identified by Leverage, standardized deleted residuals, and Cook’s D. A sensitivity analysis with and without the outliers indicated similar results. Thus, the results from the original dataset were reported. The normality and homoscedasticity assumptions did not hold for the current data. Thus, the robust standard error estimation was used in the following regression analysis. That is, an HC3 robust standard error estimation was used to correct for the violation of normality and heteroskedasticity (Davidson et al., 1995). When testing the linearity assumption, plots showed a curvilinear relationship in network churn with respect to the baseline network size (BNS) and CGA as predictors. Thus, quadratic terms were created for each to be included in the final model.
Accordingly, continuous independent variables were mean centered to facilitate the interpretation of the intercept and to mitigate potential structural multicollinearity. Post hoc diagnostic checks confirmed that variance inflation factor values for all predictors remained below the recommended threshold of 5 (Hair, 2010), indicating that multicollinearity did not bias the regression estimates.
Finally, to characterize the changing nature of the students’ support systems (i.e., network composition), we coded the professional role of each nominated mentor into six mutually exclusive categories: (1) University Faculty, (2) Professionals outside the university, (3) Graduate Students, (4) Postdoctoral Researchers, (5) Undergraduate Students/Peers, and (6) Other. We calculated the net change in the frequency of each mentor role from Time 1 to Time 2 to assess whether the composition of the networks shifted toward specific types of support. Additionally, to determine if specific roles were driving network volatility, we examined bivariate correlations between the number of mentors in each role category and the specific components of churn: the number of ties dropped (Nd) and the number of ties added (Na).
We note that this study includes two data collection time points (Fall and Spring semesters), which allows us to calculate churn but provides only a snapshot of what is likely a longer developmental process. Accordingly, we frame our findings as descriptive of short-term network dynamics rather than definitive evidence of a complete change process.
9. Results
We first examined the descriptive statistics and the correlations between variables (see Tables 2–4). Concerning research question 1, we found that participants had a churn value of 0.69 on average, indicating a relatively large change in the networks across time for participants. Further, churn was negatively correlated with scientific persistence intentions (r = −0.19, p = 0.01) and BNS (r = −0.31, p < 0.001), indicating that participants with higher intention to persist in STEM and larger networks experienced less change in their social network from T1 to T2.
Table 3
Summary of descriptive statistics for the mentor network churn and predictors of churn (N = 184).
| Variables | M | SD | Minimum | Maximum | Skew | Kurtosis |
|---|---|---|---|---|---|---|
| Mentor network size | ||||||
| Churn | 0.69 | 0.32 | 0 | 1 | −0.67 | 2.42 |
| Interest in earth/environmental sciences | 4.36 | 2.13 | 1 | 7 | −0.17 | 1.69 |
| Scientific persistence intentions | 5.45 | 1.48 | 1 | 7 | −1.19 | 4.08 |
| Agentic goal affordances in STEM | 6.03 | 1.11 | 1.5 | 7 | −1.49 | 5.47 |
| Agentic goal endorsement | 5.83 | 1.15 | 1 | 7 | −1.20 | 4.68 |
| Agentic goal mismatcha | 0.76 | 0.88 | 0 | 4.5 | 1.80 | 6.70 |
| Communal goal affordances in STEM (CGA) | 5.88 | 1.19 | 2 | 7 | −1.00 | 3.29 |
| Centered CGA2 | 1.42 | 2.15 | 0.16 | 15.02 | 3.65 | 20.21 |
| Communal goal endorsement | 6.34 | 0.97 | 3 | 7 | −1.57 | 4.99 |
| Communal goal mismatcha | 0.75 | 0.98 | 0 | 5 | 1.83 | 6.78 |
| University belonging | 5.25 | 1.14 | 1 | 7 | −0.91 | 3.97 |
| Baseline mentor network size (MNS) | 2.04 | 1.49 | 0 | 5 | 0.39 | 2.33 |
| Centered MNS2 | 2.22 | 2.56 | 0.00 | 8.74 | 1.34 | 3.96 |
| Follow-up mentor network size | 2.15 | 1.44 | 0 | 5 | 0.16 | 2.23 |
Note: aMeasured as the absolute values of the difference score between endorsements and affordances, so higher scores indicate greater misfit.
Source: Authors’ contribution.
Table 4
Summary of pairwise correlations between mentor network churn and predictors of churn (N = 184).
| Variables | 1. | 2. | 3. | 4. | 5. | 6. | 7. | 8. | 9. | 10. | 11. |
|---|---|---|---|---|---|---|---|---|---|---|---|
| 1. Churn | – | ||||||||||
| 2. Interest in earth/environmental sciences | −0.14 | — | |||||||||
| 3. Scientific persistence intentions | −0.19* | 0.30* | — | ||||||||
| 4. Agentic goal affordances in STEM | −0.12 | 0.23* | 0.44* | — | |||||||
| 5. Agentic goal mismatcha | 0.03 | −0.06 | −0.30* | −0.41* | — | ||||||
| 6. Communal goal affordances in STEM (CGA) | 0.01 | 0.15* | 0.33* | 0.54* | −0.26* | — | |||||
| 7. CGA2 | 0.13 | −0.18* | −0.26* | −0.42* | 0.12 | −0.66* | — | ||||
| 8. Communal goal mismatcha | −0.002 | −0.22* | −0.38* | −0.44* | 0.31* | −0.72* | 0.61* | — | |||
| 9. University belonging | −0.11 | 0.19* | −0.20* | 0.15* | −0.16* | 0.16* | −0.13 | −0.17* | — | ||
| 10. Baseline mentor network size (MNS) | −0.31* | 0.17* | 0.22* | 0.17* | −0.19* | 0.14 | −0.11 | −0.14 | 0.13 | — | |
| 11. MNS2 | 0.21* | 0.14 | −0.02 | 0.05 | −0.10 | 0.11 | −0.05 | −0.07 | −0.03 | 0.34* | — |
Note: aMeasured as the absolute values of the difference score, so higher scores indicate greater misfit, *p < 0.05.
Source: Authors’ contribution.
Next, to address research questions 2–4, a multiple regression analysis was conducted. Specifically, churn was regressed on the DNT-relevant mentee (RQ2: BNS, BNS2, college rank, interest, persistence intention), environmental (RQ3: university and major), and person-environment fit (RQ4: agentic goal affordance, agentic goal mismatch, CGA, CGA2, communal goal mismatch, and university belonging) predictors measured at T1. The overall model was statistically significant and explained a large proportion (36%) of variation in network churn (see Table 5).
Table 5
Summary of regression coefficients predicting mentor network churn (N = 184).
| Predictors | β | b | SERobust | 95% CI [LL, UL] |
|---|---|---|---|---|
| Interest in earth/environmental sciences | −0.10 | −0.01 | 0.01 | [−0.04, 0.01] |
| Scientific persistence intentions | −0.08 | −0.02 | 0.02 | [−0.06, 0.02] |
| Agentic goal affordances in STEM | −0.03 | −0.01 | 0.03 | [−0.06, 0.05] |
| Agentic goal mismatch | −0.05 | −0.02 | 0.03 | [−0.08, 0.04] |
| Communal goal affordances in STEM (CGA) | 0.07 | 0.02 | 0.03 | [−0.05, 0.08] |
| CGA2 | 0.24* | 0.034 | 0.015 | [0.004, 0.065] |
| Communal goal mismatch | −0.21 | −0.07 | 0.04 | [−0.15, 0.01] |
| University belonging | −0.05 | −0.01 | 0.02 | [−0.06, 0.03] |
| Baseline mentor network size (MNS) | −0.43*** | −0.091 | 0.015 | [−0.120, −0.063] |
| MNS2 | 0.33*** | 0.040 | 0.009 | [0.022, 0.059] |
| Current college rank | ||||
| Junior yeara | −0.03 | −0.02 | 0.06 | [−0.13, 0.09] |
| Fifth year or beyonda | 0.05 | 0.07 | 0.11 | [−0.14, 0.28] |
| Advanced degreea | 0.01 | 0.01 | 0.13 | [−0.25, 0.26] |
| Current major | ||||
| Agriculture/natural resourcesb | 0.001 | 0.001 | 0.08 | [−0.16, 0.16] |
| Physical sciencesb | −0.13 | −0.11 | 0.08 | [−0.27, 0.05] |
| Technology/computer sciencesb,d | 0.14* | 0.209 | 0.080 | [0.050, 0.368] |
| Engineeringb | 0.08 | 0.06 | 0.07 | [−0.08, 0.21] |
| Mathematics/statisticsb | −0.03 | −0.07 | 0.39 | [−0.83, 0.69] |
| Environmental sciencesb | 0.17 | 0.19 | 0.10 | [−0.004, 0.39] |
| S&E relatedb | 0.01 | 0.01 | 0.11 | [−0.21, 0.24] |
| Non-STEMb | −0.03 | −0.05 | 0.14 | [−0.31, 0.22] |
| Current university | ||||
| Colorado Collegec | −0.03 | −0.04 | 0.12 | [−0.27, 0.20] |
| Metropolitan State University of Denverc | −0.11 | −0.16 | 0.13 | [−0.41, 0.08] |
| North Carolina A&T Universityc | 0.09 | 0.13 | 0.09 | [−0.05, 0.30] |
| North Carolina State Universityc | −0.09 | −0.08 | 0.08 | [−0.24, 0.07] |
| University of Colorado – Boulderc | −0.10 | −0.09 | 0.08 | [−0.25, 0.06] |
| University of North Carolina – Charlottec | −0.15 | −0.14 | 0.12 | [−0.38, 0.09] |
| University of South Carolinac | −0.04 | −0.05 | 0.12 | [−0.28, 0.19] |
| University of Wyomingc | −0.07 | −0.09 | 0.12 | [−0.33, 0.14] |
| Otherc | −0.08 | −0.08 | 0.13 | [−0.34, 0.17] |
| Intercept | 0.60 | 0.08 | [0.45, 0.75] | |
Note: The regression model test was F(30, 153) = 6.26, p < 0.001, R 2 = 0.36. SERobust are for the unstandardized coefficient (b). aComparison versus senior year in college. bComparison versus biological sciences. cComparison versus Colorado State University. dSensitivity analysis (Cook’s distance) indicated no influential outliers within this subsample. *p < 0.05, **p < 0.01, ***p < 0.001.
Source: Authors’ contribution.
Concerning research question 2, the results showed that only the mentee characteristic of baseline mentor network size (i.e., a proxy for perceived need for mentoring) uniquely predicted churn. There was a statistically significant linear (β = −0.43) and quadratic (β = 0.33) association between BNS and churn, indicating that participants with small and large initial network sizes experienced more turnover in their mentor networks than those with middling network sizes (Figure 1).
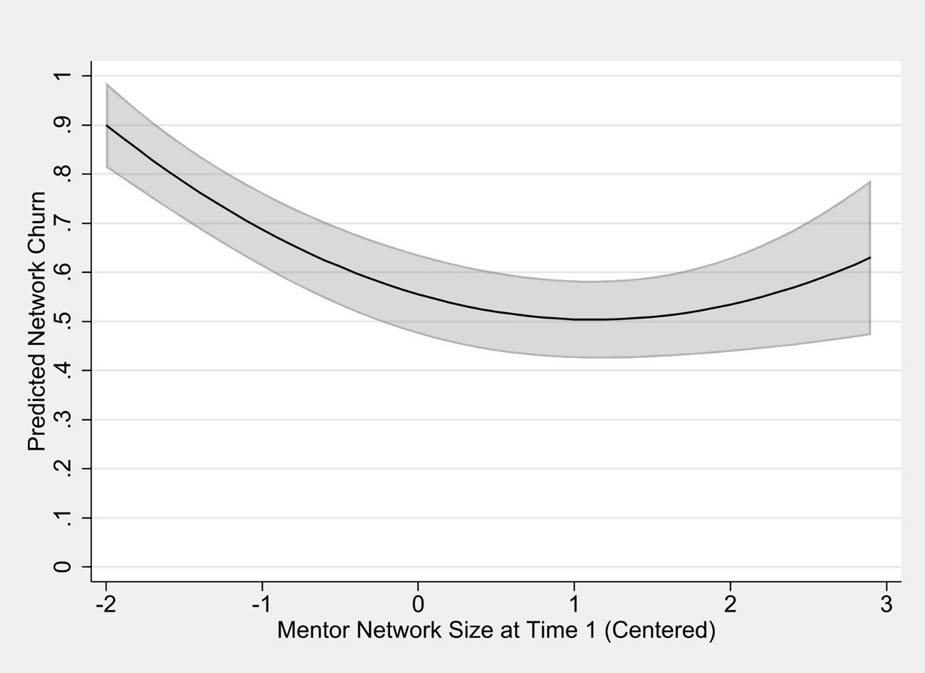
Figure 1
Curvilinear influence of baseline mentor network size on mentor network churn. Note: The gray area surrounding the black predicted network churn line represents 95% confidence bands.
Source: Authors’ contribution.
Concerning research question 3, environmental differences across majors, but not universities, were associated with churn. That is, participants from Technology/Computer Science majors exhibited more change in network churn across time compared to those in Bio/Life Science majors (β = 0.14). Given the small subsample size of the Technology/Computer Science group (n = 8), we conducted a post hoc sensitivity analysis using Cook’s Distance to test for influential outliers. All values were below the conservative threshold of 1.0, suggesting that this finding is robust and not driven by specific individuals.
Finally, concerning research question 4, the results indicated that only perceptions of communal affordances in STEM fields uniquely predicted churn. The coefficients revealed a curvilinear relationship between CGAs and churn, indicating that participants who perceived few opportunities to satisfy communal goals in STEM fields (i.e., help others) experienced more change in their network from T1 to T2 than did those who perceived many opportunities to satisfy communal goals (Figure 2).
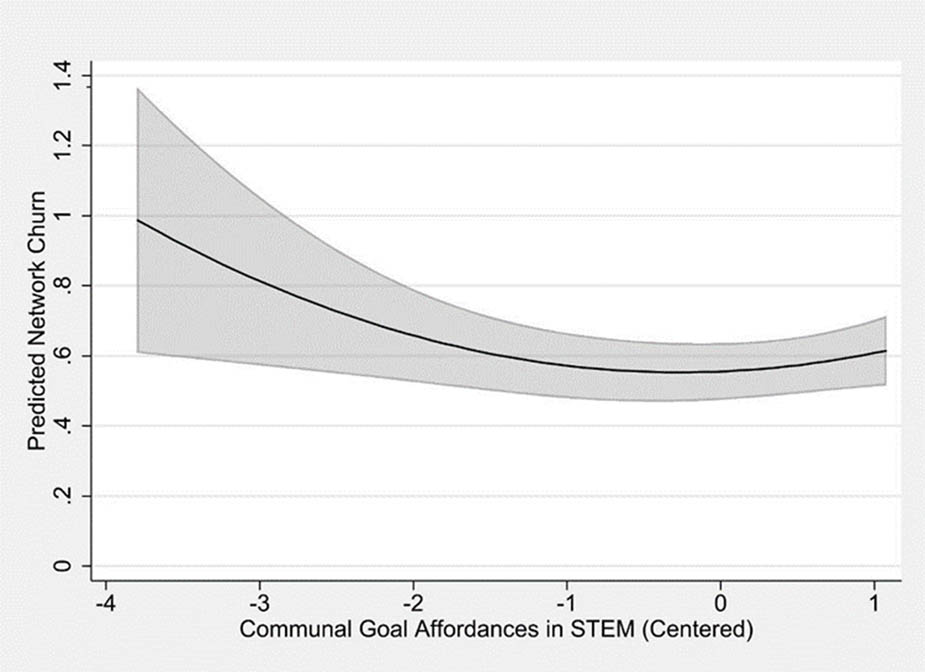
Figure 2
Curvilinear influence of perceived CGAs in STEM on mentor network churn. Note: The gray area surrounding the black predicted network churn line represents 95% confidence bands.
Source: Authors’ contribution.
To better understand the nature of the observed network churn, we examined the professional roles of the mentors entering and exiting the students’ networks. Table 6 displays the aggregate shifts in mentor roles from time 1 to time 2. The data reveal a pattern of network “professionalization.” While ties with peer mentors and nonacademic others declined (−20.0 and −28.6%, respectively), participants reported a net increase in ties with more senior academic and professional mentors. Specifically, ties with graduate students increased by 64.0%, and ties with professionals outside the university increased by 15.7%. Ties with university faculty, which constituted the largest share of the networks at both time points, grew by 9.4%.
Table 6
Changes in mentor role composition from time 1 to time 2.
| Mentor role | Time 1 count | Time 2 count | Net change | % Change |
|---|---|---|---|---|
| University faculty | 234 | 256 | +22 | +9.4 |
| Professional (non-university) | 121 | 140 | +19 | +15.7 |
| Graduate student | 25 | 41 | +16 | +64.0 |
| Postdoc | 10 | 9 | −1 | −10.0 |
| Undergraduate student | 10 | 8 | −2 | −20.0 |
| Other | 28 | 20 | −8 | −28.6 |
Note: Net Change represents the aggregate difference in total mentions of each role across all participants.
Source: Authors’ contribution.
We also examined whether specific roles were associated with the specific components of churn (i.e., ties added vs. ties dropped). Both the number of ties dropped (r = 0.57, p < 0.001) and ties added (r = 0.59, p < 0.001) were most strongly correlated with the number of faculty mentors. This suggests that while the net change reflects a shift toward professionalization, the volatility (high churn) is largely driven by the rotation of faculty mentors (e.g., changing instructors or lab supervisors).
To further clarify the processes underlying network churn, we conducted supplemental regression analyses predicting the number of ties added (Na) and the number of ties dropped (Nd) separately (see Supplemental Table S2). The model predicting ties dropped explained substantially more variance (R 2 = 0.61) than the model predicting ties added (R 2 = 0.29). Baseline mentor network size showed divergent patterns: for ties dropped, there was a significant positive linear effect (β = 0.52, p < 0.001), while for ties added, the relationship was curvilinear (linear β = −0.22, p < 0.001; quadratic β = 0.13, p = 0.002). Communal goal mismatch was significantly associated with ties dropped (β = −0.21, p = 0.024) but not ties added; unexpectedly, the direction was negative, indicating students with higher mismatch dropped fewer ties.
10. Discussion
The purpose of this study was to use social network and developmental network theories to describe and predict changes to mentor networks among undergraduate female students in STEM. We found that our sample experienced an average of 70% network churn over the 6 months. Beyond the rate of churn, an aggregate role-composition analysis showed a shift toward more senior academic and professional mentors, a pattern consistent with network professionalization. Further, churn was curvilinearly associated with perceptions of CGAs in STEM careers and initial mentor network size, as well as being linearly associated with major.
One critical question raised by the high rates of churn is whether this volatility represents instability (a loss of support) or adaptation (a realignment of resources). Our compositional analysis is consistent with the adaptation interpretation. This aligns with Burt and Merluzzi’s (2016) theory of network oscillation, which posits that effective networkers do not maintain static structures but instead oscillate between closure and brokerage depending on their developmental needs. The aggregate increase in faculty, graduate student, and professional ties, alongside a decline in peer and other ties, appears consistent with students transitioning from a closure phase (where dense peer support fosters belonging and psychosocial adjustment) toward a brokerage phase (where ties to senior academics provide access to career opportunities and novel professional networks). From this perspective, churn is not a failure to maintain relationships but potentially a marker of developmental progression. The growth in graduate student (+64%) and professional (+16%) ties, concurrent with a decline in peer (−20%) and general (−29%) ties could suggest that students are curating their networks, though we acknowledge that these patterns may also reflect passive processes such as changes in course schedules or lab rotations rather than deliberate optimization (Cotton et al., 2011). Rather than simply “losing” mentors, these patterns may reflect diversification of support systems to include more specialized career advice (Granovetter, 1973; Higgins & Kram, 2001). Thus, the churn observed here could be potentially suggestive of student agency and professional socialization, rather than a warning sign of isolation (Estrada et al., 2011; Ibarra, 1999), though alternative explanations are possible.
Despite this positive trend toward professionalization, the sheer volume of turnover (70%) remains noteworthy. This aligns with the previous peer network research on college students, which suggests a large amount of shifting in personal relationships (Benson, 2007; Skahill, 2002). Knowing the importance of long-term mentorship on success, particularly for students who come from less represented backgrounds (Brown et al., 2021; Nugent et al., 2004), a tension exists between the need for stability and the need for network evolution. While students must evolve their networks to gain career-specific capital, they also require consistent psychosocial support. This indicates a need to facilitate mentorship relationships for students that can evolve with them, allowing them to benefit from stable interactions even as they add new, specialized mentors to their network.
Students who reported lower CGA scores at T1 were likely to experience more churn in their mentorship networks. There are several potential explanations for this. First, college is known as a time for identity development and perspective shifts for undergraduate students (Perez et al., 2014). It is possible that students who began with lower communal goal affordances could discover broader impacts of their work as they navigate through school and build new mentorship relationships as they do so. Further, it is likely that as students are exposed to new mentors, their community goal affordances might change (and grow) due to their exposure to new people and experiences that affirm the communal nature of scientific communities (Brown et al., 2015). Conversely, if a student does not feel like their career in STEM could meet community goals, they may be motivated to engage with new or different mentors for a fresh perspective.
Network size, in terms of having smaller or larger networks to start in T1, was related to network churn. DNT suggests the importance of having multiple mentors, with some research suggesting at least two being related to longer-term success in STEM (Aikens et al., 2016; Hernandez et al., 2023; Packard et al., 2004). Thus, for students who began with few or no mentors, churn may be capturing the growth in their networks over time. SNT posits that “more is not always better” when it comes to members of personal networks, which might explain why students with larger networks either reduce the size of their network to a more concentrated set of mentors or integrate new mentors in place of past mentors (Perry et al., 2018). Students with larger networks may also face added challenges in deepening relationships with mentors, given their mentorship is stretched across potentially too many people. Research suggests that as networks grow, individuals are more taxed to upkeep their relationships, potentially sacrificing quality for quantity (Granovetter, 1973). In this case, students who begin with more mentors may be creating a core group of mentors with more interchangeable, peripheral mentors that ebb and flow as the student develops and their needs change. Either way, students who had a middling level of mentors seemed to report more stability in their mentorship networks over time, suggesting the potential benefit of creating opportunities for students to build a smaller yet effective mentorship network early on in their STEM pursuits.
Finally, university majors were related to network churn in that students from technology/computer science backgrounds reported more churn than their peers in bio/life sciences. This could be a discipline-specific/cultural phenomenon, where students in computer science and technology are exposed to a larger pool of potential mentors, particularly those outside the university setting (De Janasz & Sullivan, 2004). Computer science and technology is still a quickly evolving and developing space, and churn in mentorship networks may reflect an innovative, dynamic, and less stable field as a whole.
Our supplemental analyses that distinctly explored ties added and ties dropped revealed that baseline network size operated differently across these processes: larger networks predicted more tie dissolution, while curvilinear effects characterized tie addition. Interestingly, the communal goal mismatch effect was limited to tie dissolution and in an unexpected direction. Students with higher mismatch dropped fewer ties, which complicates a straightforward strategic optimization interpretation and suggests that students experiencing values misalignment may be maintaining rather than pruning existing mentor relationships, perhaps in search of support or validation. Because mismatch was operationalized as an absolute difference, this index combines two substantively distinct profiles: students who perceive that STEM affords more communal opportunity than they personally value, and students who perceive that it affords less. Although both yield identical mismatch scores, these profiles likely carry different motivational implications for network behavior, so collapsing them into a single magnitude may obscure or even reverse the expected association; disaggregating the direction of mismatch is a promising avenue for future work. These findings underscore the value of examining tie addition and dissolution as distinct processes and highlight the need for future research examining students’ motivations for network changes.
11. Implications for future research and practice
This study extends the previous work on the importance of mentorship networks for retaining students in STEM (W. C. Brown et al., 2021; Hernandez et al., 2023), and fills gaps in understanding the dynamics that are associated with changes in these mentorship networks. Findings from this study confirm that students’ networks change in relatively short amounts of time (i.e., 6 months). However, our analysis of “added” versus “dropped” ties suggests that these changes could reflect strategic restructuring, though passive processes cannot be ruled out. Our findings challenge the traditional assumption in higher education that network stability is the primary indicator of a healthy mentorship system (Grossman & Rhodes, 2002; Keller, 2005). For the women in our sample, high rates of network churn (70%) may not be symptomatic of isolation or support loss but could potentially reflect adaptive network restructuring. This distinction offers critical practical implications for university administrators and STEM program directors. Drawing on the network oscillation framework (Burt & Merluzzi, 2016), programs might help students recognize that their networking needs will naturally shift over time, from seeking dense, supportive peer communities early in their academic careers to cultivating bridging ties with professionals who can facilitate professional connections and development. Rather than viewing the loss of early peer mentors as a problem, students can be coached to understand this as a natural oscillation toward career-relevant brokerage.
Our findings suggest that practitioners might consider helping students frame network churn as professionalization. When evaluating student success programs, high turnover in mentorship ties is often flagged as a failure to retain mentors (Eby et al., 2008; Spencer et al., 2015). However, an aggregate compositional analysis shows fewer peer ties and more faculty, graduate student, and professional ties. Consequently, programs aimed at supporting mentorship for students in STEM should distinguish between “maladaptive instability” (losing essential support without replacement) and “adaptive restructuring” (evolving the network to match career stages; Dobrow et al., 2012; Higgins & Kram, 2001). Using this framework, a “stable” network in the junior or senior year might actually signal stagnation, whereas a churning network may signal professional growth (Granovetter, 1973; Ibarra, 1999). This framing should be considered in the context of the individual student and their specific experience with, or without, network churn.
Second, interventions should move beyond simply assigning mentors and instead focus on teaching network agency. If churn reflects, at least in part, a mechanism for professional advancement, students may benefit from being equipped with the skills to manage it. We suggest that STEM retention programs include curriculum on teaching students how to gracefully exit mentoring relationships that no longer serve their developmental needs while also identifying gaps in their current support systems (De Janasz & Sullivan, 2004). By explicitly teaching these skills, educators can help students view their networks as dynamic assets that require active curation, rather than static safety nets.
Finally, these findings suggest a need for flexible program structures. Many mentorship programs match a student with a single mentor for the duration of their degree. However, our data show that student needs may shift from psychosocial support to instrumental career support. Programs should consider rotational models that normalize the addition of new mentors and the natural sunsetting of older ties, thereby validating the high rates of churn we observed as a healthy component of STEM identity development.
12. Limitations
Despite the novelty and relevance of these findings, we acknowledge that our research design limits the conclusions we can draw. First, while we analyzed the changing roles of mentors (e.g., faculty vs. peer), we lack data on the specific quality or strength of the added ties compared to the dropped ties. Future research should examine whether the “upgraded” academic ties actually provide better psychosocial support than the peer ties they replaced.
A critical limitation of this study is that we did not collect data on students’ motivations for adding or dropping mentors. Consequently, we cannot determine whether the observed churn reflects intentional network optimization or passive processes (e.g., changing course schedules, lab rotations, or mentor availability). The compositional shift toward more senior mentors is consistent with strategic professionalization, but alternative explanations, such as structural changes in academic environments, remain plausible. Further, while our supplemental analyses examining ties added and ties dropped separately provide additional insight into the distinct processes underlying churn, these models revealed some unexpected patterns (e.g., higher communal goal mismatch predicting fewer ties dropped) that do not straightforwardly support a strategic optimization interpretation. These findings warrant future research that directly assesses students’ reasons for mentor transitions to disentangle active curation from circumstantial turnover.
Finally, this study concerned the nature of the networks, which were egocentric rather than sociometric (i.e., a personal network rather than the whole network). Thus, we are unable to inform on how students’ positions or access to social capital within their local network (e.g., within their major or university) impact churn in their personal mentorship network. Moreover, the current study focused on churn as the outcome of interest rather than proximal or distal outcomes (e.g., motivation, persistence). Future network research should explore the individual, dyadic, and network-level factors that result in positive and productive mentorship dyads and how churn might impact important student outcomes, including persistence in the field, GPA, and mental well-being over time.
13. Conclusion
By using social network analysis to identify factors associated with churn among undergraduate students’ mentorship networks, this study found that STEM majors experience a 70% churn rate among members of their mentorship networks on average. However, this churn appears to be largely adaptive, with an aggregate compositional shift toward more senior academic and professional mentors. Additionally, the initial size of a student’s network, CGA scores at baseline, and academic major all informed the degree of churn. This study is novel in assessing the dynamics of a student’s mentorship network and adds to an existing body of literature assessing factors that contribute to positive mentorship relationships.
Acknowledgements
We thank Drs. Amanda Adams, Brittany Bloodhart, Melissa Burt, Elaine Godfrey, and Ilana Pollack for their assistance on this project. We also thank members of the program evaluation team, Cheryl Bowker, Carlie Trott, and Laura Sample McMeeking, for their helpful feedback for program improvement. We also acknowledge the many volunteer mentors who have made this research possible.
Funding information
This study was funded by the National Science Foundation (DUE: #1431795, #1431823, #1460229, #2013312, #2013318, #2013323, #2013326, and #2013333).
Author contributions
MP led data analyses, interpretation of results, and drafting of this manuscript; QZ assisted with data analyses and drafting of the manuscript; EF served as PI and conceptualized the project, edited and reviewed the manuscript, secured funding; SC conceptualized the project, edited and reviewed the manuscript, secured funding; RB conceptualized the project, edited and reviewed the manuscript, secured funding; PH conceptualized the project; assisted with data analyses, contributed to manuscript drafting, edited and reviewed the manuscript, secured funding.
Conflict of interest statement
Authors state no conflict of interest.
Data availability statement
The data that support the findings of this study are openly available in the Texas Data Repository at https://doi.org/10.18738/T8/BKFRUB.