

Table 1.
Descriptive statistics of Euro Stoxx 50 log returns
| Mean | SD | Min | Max | Skewness | Kurtosis | JarqueBera_p |
|---|---|---|---|---|---|---|
| −2.232438e-06 | 0.0169396 | −0.2526991 | 0.1485792 | −0.7748423 | 26.33626 | 0 |
[i] Note: The table presents descriptive statistics for the logarithmic returns of the Euro Stoxx 50. The results show that log returns are non-normal, negatively skewed and leptokurtic, with the Jarque–Bera test highly significant, confirming deviations from normality. These characteristics support the use of GARCH-type models to capture volatility dynamics.
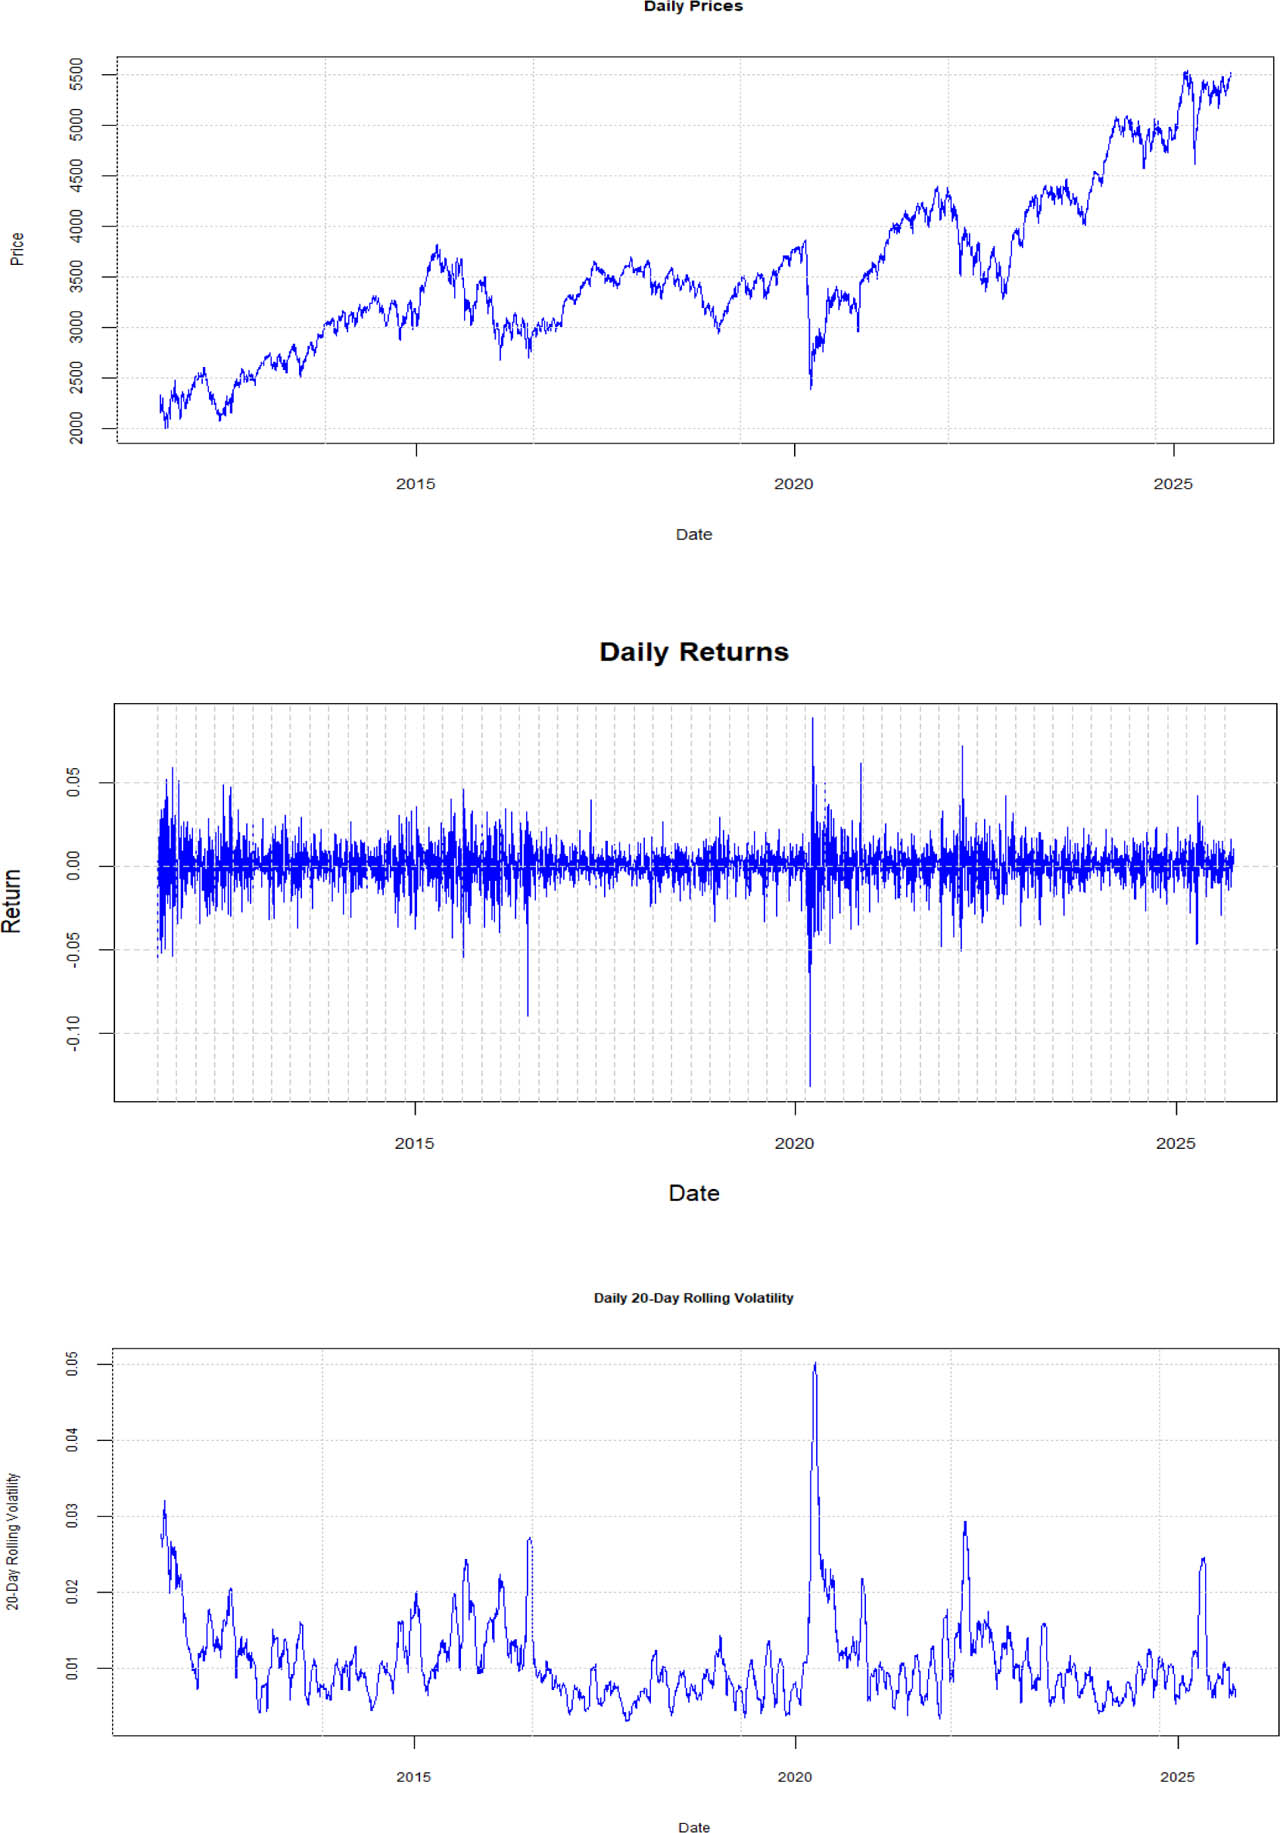
Figure 1.
Daily price, return and volatility of the Euro Stoxx 50
Note: The first part of the figure shows the daily price during the analysed period; the figure in the middle part shows the return of the analysed period; the third part shows the 20-day rolling volatility of the Euro Stoxx 50. The 20-day rolling volatility has been selected as it approximates one trading month
Table 2.
In-sample parameter estimates
| Parameter | Estimate | Std. error | t-value |
|---|---|---|---|
| GARCH | |||
| μ | 0.000214 | 0.000167 | 1.2773 |
| ω | 0.000007*** | 0.000001 | 6.0969 |
| α1 | 0.064832*** | 0.002266 | 28.6155 |
| β1 | 0.934159*** | 0.006376 | 146.5103 |
| Shape | 2.593921 | 0.078449 | 33.0650 |
| AIC | −5.8302 | ||
| BIC | −5.8217 | ||
| EGARCH μ | |||
| 0.000132 | 0.000155 | 0.85105 | |
| ω | −0.174654*** | 0.003201 | −54.55830 |
| α1 | −0.153043*** | 0.015497 | −9.87557 |
| β1 | 0.979142*** | 0.000124 | 7874.31135 |
| γ1 | 0.108245*** | 0.012534 | 8.63620 |
| Shape | 2.741881 | 0.137481 | 19.94372 |
| AIC | −5.8744 | ||
| BIC | −5.8641 | ||
| GJR-GARCH μ | |||
| 0.000192 | 0.000159 | 1.207957 | |
| ω | 0.000007*** | 0.000000 | 19.769616 |
| α1 | 0.000000 | 0.004249 | 0.000003 |
| β1 | 0.923050*** | 0.007547 | 122.309813 |
| γ1 | 0.151898*** | 0.022638 | 6.709946 |
| Shape | 2.678598 | 0.093473 | 28.656460 |
| AIC | −5.8622 | ||
| BIC | −5.8519 |
[i] Note: *, ** and *** represent significance levels of 5%, 1% and 0.1%, respectively. The results show strong volatility persistence across all models and significant asymmetry in the EGARCH and GJR-GARCH models, confirming the presence of leverage effects. Based on AIC and BIC, EGARCH provides the best in-sample fit among the analysed models.
Table 3.
Out-of-sample accuracy metrics
| Model | QLIKE | MSE | MAE | HMSE | HMAE |
|---|---|---|---|---|---|
| GARCH | −7.260182 | 2.10395e-06 | 0.0004357386 | 0.004309232 | 0.02136632 |
| EGARCH | −7.352322 | 2.07787e-06 | 0.000400113 | 0.003523288 | 0.02027521 |
| GJR-GARCH | −7.32378 | 2.209141e-06 | 0.0004335917 | 0.003646335 | 0.02082398 |
[i] Note: EGARCH(1,1) outperforms both GARCH(1,1) and GJR-GARCH(1,1) in most forecast accuracy measures, particularly QLIKE, MSE and MAE, indicating the best quality volatility forecasting performance. While GJR-GARCH(1,1) performs competitively in terms of HMSE and HMAE, it does not consistently outperform EGARCH across all criteria. Overall, EGARCH provides the most stable and accurate performance among the three models.
Table 4.
Post-estimation diagnostic tests
| Model | LB residuals | LB squared residuals | ARCH-LM | Sign bias |
|---|---|---|---|---|
| GARCH(1,1) | 0.1227 | 0.7718 | 0.8559 | 0.0296 |
| EGARCH(1,1) | 0.1199 | 0.2361 | 0.6006 | 0.3663 |
| GJR-GARCH(1,1) | 0.1932 | 0.2286 | 0.5433 | 0.2072 |
[i] Note: The p-values from post-estimation diagnostic tests are provided in the table for all the employed models. The Ljung–Box tests applied to standardised residuals and squared standardised residuals indicate no significant serial correlation or residual ARCH effects across all specifications, as all p-values exceed 0.05. Similarly, the ARCH-LM test confirms that each model adequately captures conditional heteroskedasticity. The sign-bias test reveals evidence of asymmetric effects only in the GARCH(1,1) specification (p < 0.05), suggesting that the symmetric GARCH model does not fully capture leverage effects. Both EGARCH(1,1) and GJR-GARCH(1,1) show no significant sign bias, indicating that these asymmetric specifications adequately account for volatility asymmetry in the data. Overall, the diagnostic results support the adequacy of the EGARCH(1,1) and GJR-GARCH(1,1) models over the standard GARCH(1,1) model in capturing the underlying volatility dynamics.