

Map 1.
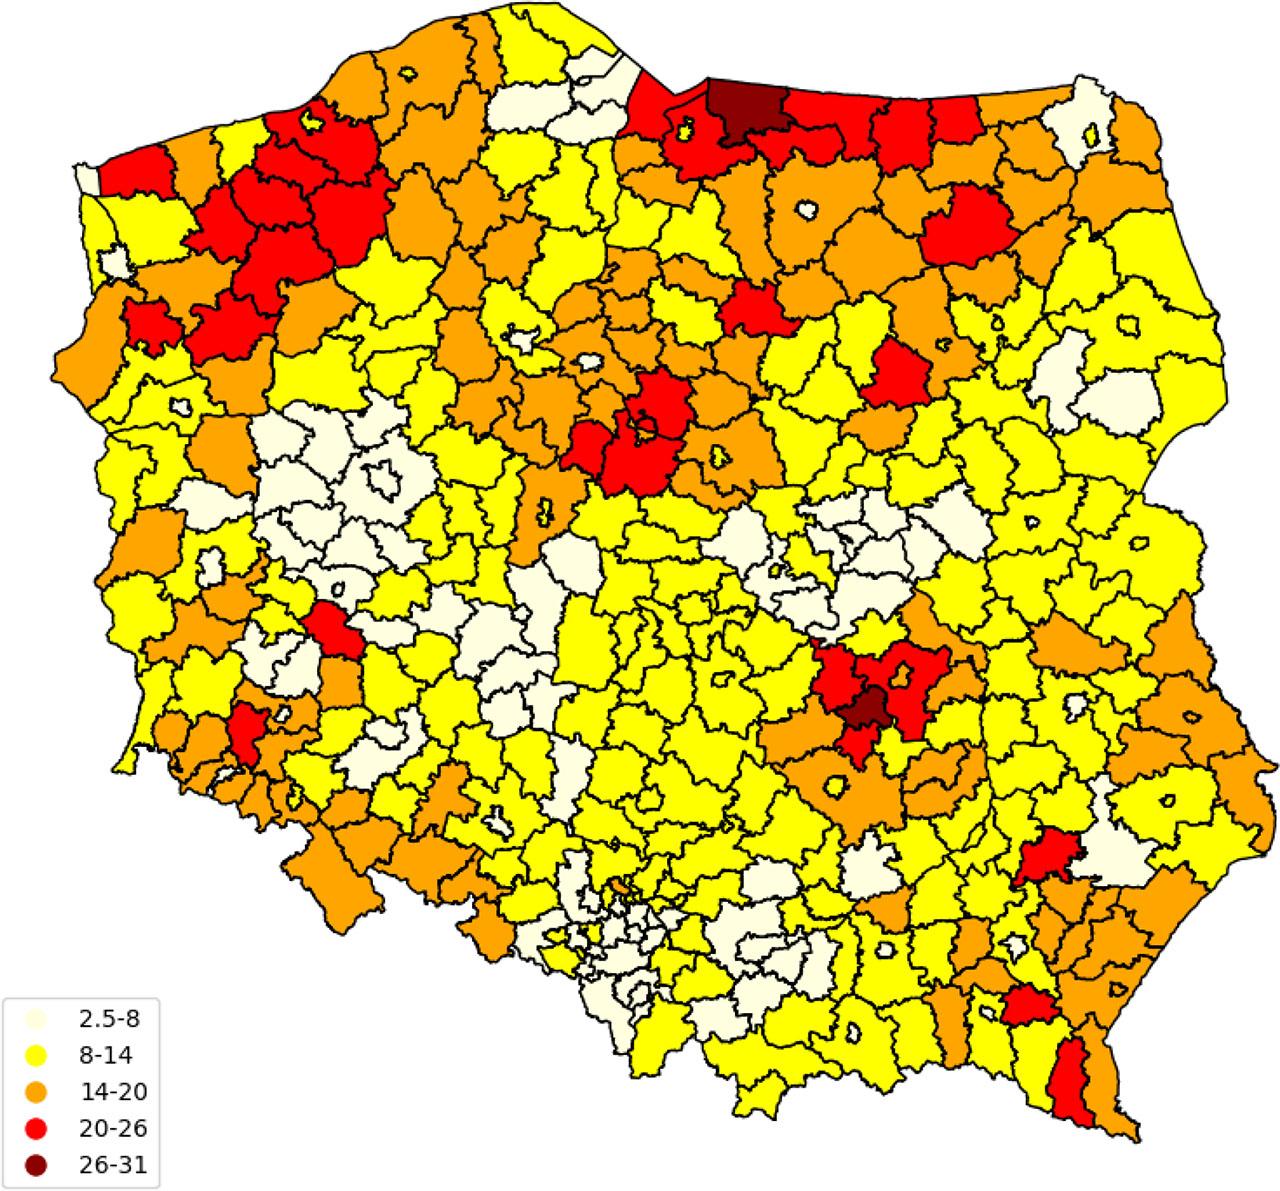
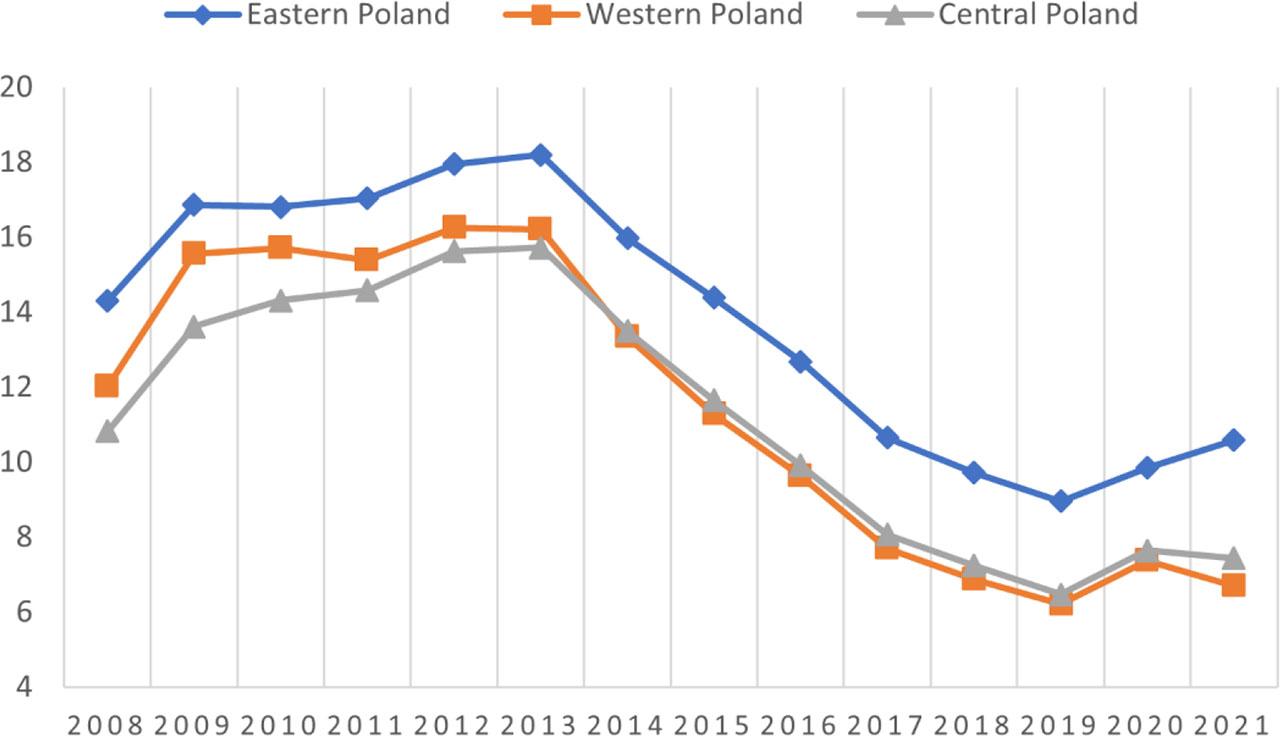
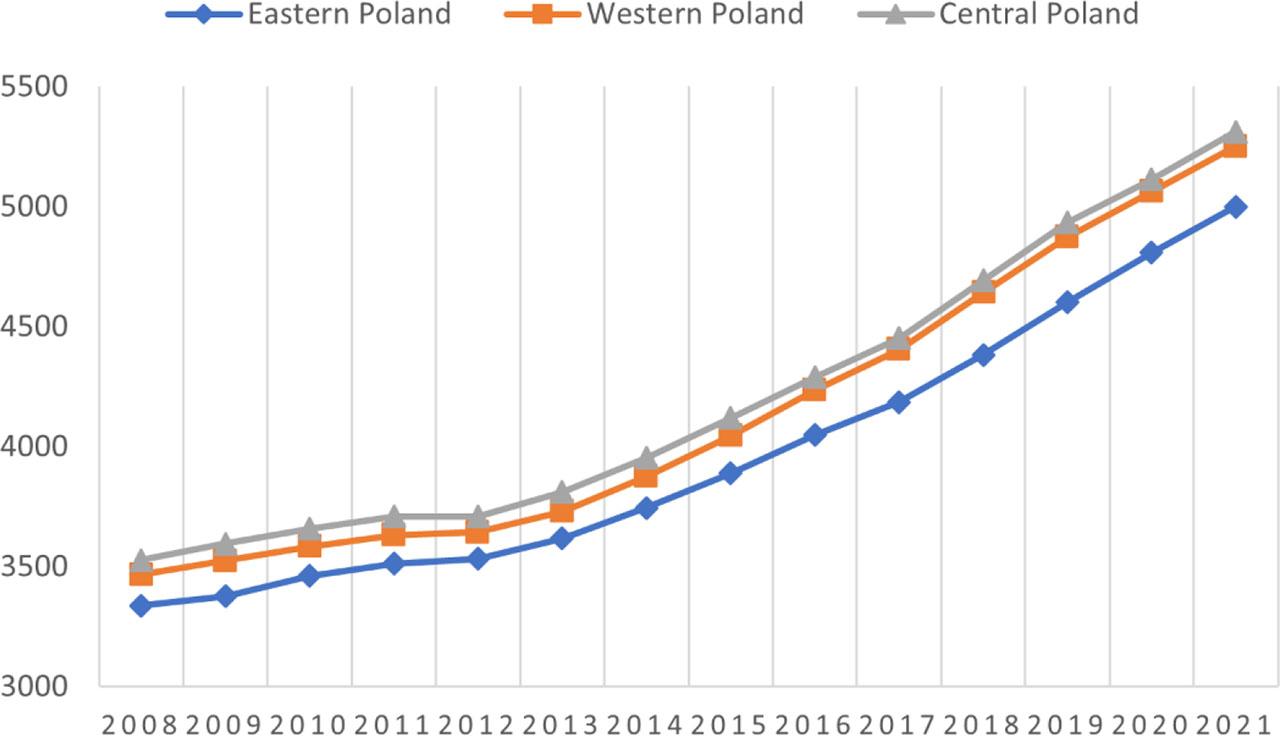
Chart 1.
Map 2.
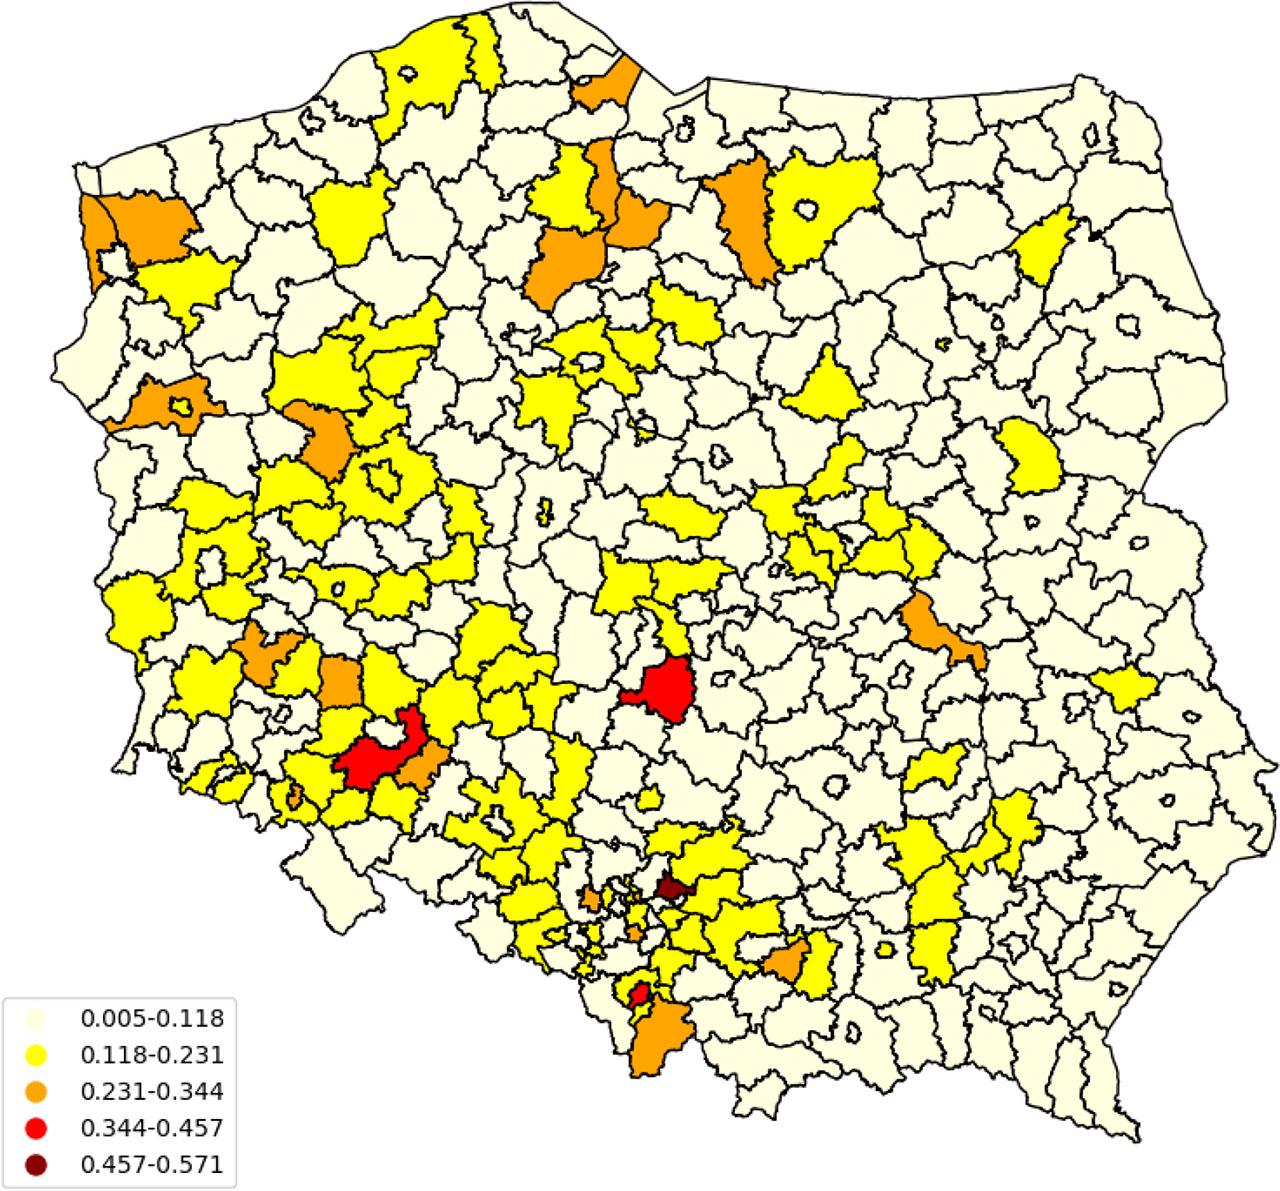
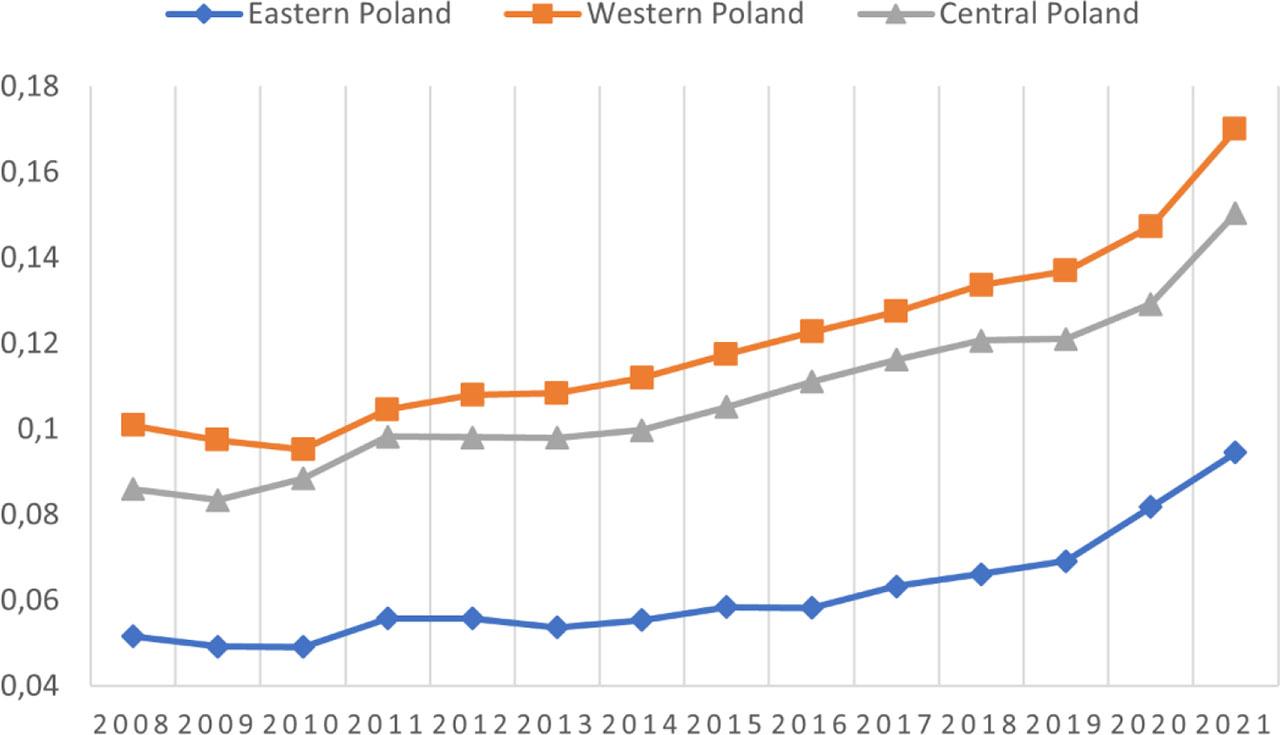
Chart 2.
Map 3.
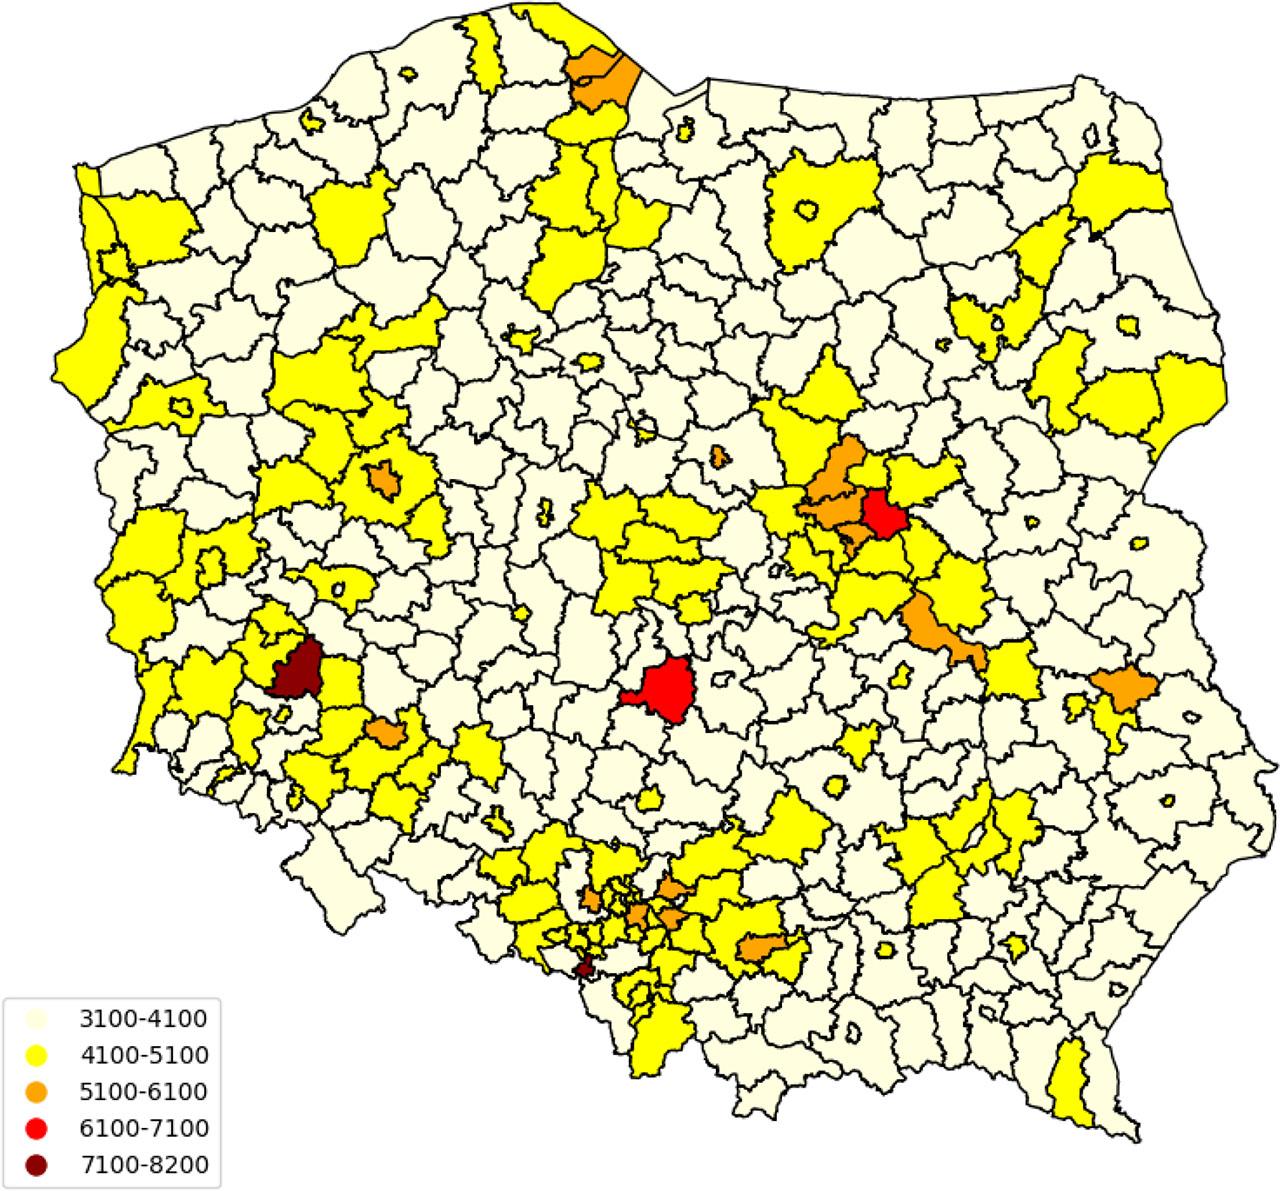
Chart 3.
Estimates of the parameters in the equation describing relative wages, done using the SDM with time fixed effects
| SDM - spatial Durbin model | ||
|---|---|---|
| regressor | time fixed effects | |
| Main | uit | −0.7011*** (0.1253) |
|
| 0.0705*** (0.0119) | |
| constant | - | |
| θk | uit | 0.5399*** (0.1699) |
|
| 0.0037 (0.0128) | |
| ρ | 0.1923*** (0.0396) | |
| R2 | within | 0.6314 |
| between | 0.8254 | |
| overall | 0.7999 | |
| ll (model) | 5777.171 | |
| AIC | −11542.34 | |
| BIC | −11501.70 | |
| chi-square(5)=48.74 prob>=chi-square=0.0000 | ||