

The political transformation in Poland after 1989 entailed dramatic changes in various sectors of its economy, thus greatly influencing the labour market structure. Privatisation, the formation of profit-making businesses, and mass layoffs led to the unemployment rate increasing to more than 10% between 1991 and 2007. The privatisation processes also contributed to an inflow of foreign capital to Poland, posing a major challenge to Polish businesses and forcing them to adopt more efficient operation methods. This resulted in an increase in labour productivity with time (Adamowicz, 2022).
Labour productivity rose faster than wages between 1995 and 2008. Competition and changes in the sectoral structure of wages had a marginal effect on the remuneration level, and total employment fell from about 4.3 million workers in 1995 to 3.4 million in 2002 in a group of enterprises surveyed by Growiec (2009).
After the economic slowdown in 2001–2002 caused by a fall in economic growth in Western Europe and a slump in exports to eastern markets, conditions in the labour market improved in 2006 with both supply and demand. A moderate but perceptible annual reduction in the unemployment rate was also observed: from 13.9% in 2006 to 3.3% in 2019 among those aged 15–74 (Kowalik, Magda, 2021). Poland’s accession to the European Union expanded the emigration of Poles to other EU member states, leading to an increase in demand for workforce in selected sectors of the Polish economy.
The aim of this study is to provide an empirical analysis of wage determinants by county between 2008 and 2021. It also presents an analysis of spatial and temporal variations in unemployment rates, labour productivity and wages. The main study uses the spatial Durbin model to estimate the parameters in the equation that describes relative wages. The two parameters are the unemployment rate and labour productivity, computed as the ratio of sold production of industry to the number of workers by county and year. The data for empirical analysis are obtained from the Local Data Bank of Statistics Poland. The analysed time interval represents the longest period for which information is available about wages, the unemployment rate, sold production of industry and the number of workers. Importantly, sold production of industry is an optimum substitute for Gross Domestic Product, whose values are unavailable at the county level. The values of the variables analysed are expressed at constant prices from 2021, converted using annual inflation rates published by Statistics Poland. The study demonstrates which of the determinants computed by county over the period under study influence wages, the nature of their influence, and their significance levels. The results obtained can undoubtedly assist local authorities in defining directions for labour market development, and particularly lead to an increase in wage indices at the regional level.
This article is structured as follows. The initial section contains a review of the literature on the subject of research. The second section presents an analysis of spatial and temporal differences in selected independent variables and in the dependent variable. The authors then present the theory underlying the Solow model of efficiency wages. The last section focuses on presenting the model’s results and conclusions drawn from the analysis.
The literature on the subject proposes numerous analyses of spatial wage differentials at the county level (Adamczyk et al., 2009; Dykas & Misiak, 2014; Przekota, 2016), voivodeships (Kapela & Kwiatkowski, 2023) and the Ukrainian oblast (region) level (Bolińska & Gomółka, 2018; Dykas et al., 2020). As regards the theoretical approach, the Solow (1979) and Summers (1988) models of efficiency wages is frequently used, in combination with neoclassical long-run economic growth models as proposed by Solow (1956), Mankiw, Romer and Weil (1992) or Nonneman and Vanhoudt (1996).
As to the empirical content, statistical analysis includes such basic indicators as wages, labour productivity or unemployment rates; theoretical models are then used to estimate the parameters in the regression equation wherein wages are explained by labour productivity and the unemployment rate. Wages are also explained by such variables as the working age population, capital expenditures, sold production of industry, the number of businesses per 1,000 residents or the number of training programmes. Kapela and Kwiatkowski (2023) in their latest study used a more detailed set of explanatory variables for average gross wages in the voivodeships. In addition to productivity and the average unemployment rate in the voivodeship, they used such variables as the share of people with higher education in total employment in the voivodeship, the share of the value of sales of products of entities classified as high and medium-high technology in the net income from sales of products of entities classified as industry, the share of the number of innovative enterprises in the total number of enterprises in the voivodeship, and the number of patents granted by the Patent Office of the Republic of Poland per 100,000 residents in the voivodeship. The authors also included the effect of the 2020 pandemic in their analysis. Combes, Duranton and Gobillon (2008) presented an interesting approach to explaining the occurrence of large spatial wage differences among French workers. They distinguished three aspects of the incidence of wage differences: the skills of the workforce, equipment (specifically local non-human resources, i.e. favourable location, climate better suited to doing business, local institutions or technologies) and intra- and inter-industry interactions.
Considering methods used to estimate the parameters in the regression equation, the method of least squares prevails, but the generalized method of moments is also used. Additionally, there are analyses that use simple rank-order methods, coefficients of variation, other clustering methods and, of course, econometric models with fixed and random effects. A fixed effects model is also used in analyses at a local level. This approach generally results in an improved goodness-of-fit index.
One of the main conclusions concerning research on the relationship between the unemployment rate and real wages posits a negative wage elasticity relative to the unemployment rate (Bolińska & Gomółka, 2018). Research conducted at the county level also demonstrates that higher wages are characteristic of counties located near big cities and of urban counties, while the lowest wages are characteristic of agricultural counties. Further, an increase in a county’s labour productivity entails an increase in relative wages (Adamczyk et al., 2009). Past analyses also confirm a positive effect of desirable changes in the working age population on the rate of wage growth and a negative effect of the rate of increase in the number of businesses on the rate of wage growth. Studies of the relationship between the rate of changes in capital expenditures, the rate of changes in sold production of industry and average wages at the county level produced ambiguous results (Przekota, 2016). Additionally, research on wages in the Iranian economy shows that an increase in the number of training programmes leads to a rise in workforce wage rates (Karrari & Ersungur, 2019). Interestingly, research on counties using a fixed effects model demonstrates a positive relationship between wages and the unemployment rate (Dykas & Misiak, 2014). The latest results of analysis at the voivodeships level covering the period 2010–2020 show that the wage gap between voivodeships narrowed slightly during this period. The econometric analysis confirmed that the share of people with higher education, the number of patents and the share of innovative enterprises also had a positive impact on the level of wages, in addition to the previously mentioned variables. The pandemic in 2020 also had a significant positive impact on the level of wages in the voivodeships (Kapela & Kwiatkowski, 2023). Finally, the study also revealed that differences in the composition of labour force skills account for 40–50% of aggregate spatial wage differences. In addition, the role of interaction explanations (in particular, the variable related to population density, i.e. urbanisation) is moderate, while the role of equipment is weak in explaining spatial wage differences (Combes et al., 2008).
Alban W. Phillips indicated unclear relations between wages and the unemployment rate as early as 1958. In his study of data on the British labour market, for example, he demonstrated a negative correlation between the unemployment rate and the rate of money wage growth. He considered the rate of increase in unemployment to be a major factor, indicating that the direction of changes in unemployment may affect the direction of changes in wages (Phillips, 1958). However, the most important conclusion drawn from his study was a curve showing changes in wages as a decreasing and convex function of unemployment. Stephan F. Kaliski drew from the studies by Phillips and Lipsey when studying an inverse relationship between wages and unemployment, increase in unemployment or increase in average price level in his case study of Canada, arriving at similar conclusions. Empirical analysis also showed a decreasing negative effect of unemployment on wages in the late 20th century, and an increasing correlation with the price level (Kaliski, 1964). More recently, some authors’ analyses of the wage curve have indicated a specific unemployment level above which the elasticity of wages relative to unemployment was no longer negative. Moreover, the effect of unemployment on wages above that level was no longer statistically significant or became positive (Blanchflower & Oswald, 1990). Opposite results were produced by studies conducted in South Africa where unemployment rates reached high values, but there was a negative elasticity of wages relative to the unemployment rate (Kingdon & Knight, 2006). References to the Phillips curve can also be found in current studies. Bartosik and Mycielski, using the wage curve model proposed by Phillips, examined the relationship between money wages and long-term unemployment in the Polish economy. Machuca and Cota used the same model to study the Mexican economy and assess the relationship between real wages, labour productivity and unemployment. Their study demonstrated an inverse relationship between wages and labour productivity and unemployment (Bartosik & Mycielski, 2015; Machuca & Cota, 2017). Another important topic discussed in the literature is that of real wages, considering the distinct influence of the price level on money (or nominal) wages. An example is a comparison of wages in the North and South of the United States in years 1973–1978. The historical trend in money wages was slightly reversed, and the real wage differential showed a strong trend toward reversal (Sahling & Smith, 1983).
The problem of differences in determinants and their impact on relative wages by county in recent years has not been fully explored. The last similar research, using the same variables, was conducted by Dykas and Misiak in 2014 and covered the period 2002–2011. In contrast, the most recent research focusing on the analysis of spatial wage differences, which arose in parallel with the present one, focuses primarily on the voivodeships level and takes into account a wider range of variables. Therefore, the need arises to address this problem and have results updated at the county level.
A similar study of relative wages in Poland at the county level was conducted by Adamczyk, Tokarski and Włodarczyk in 2009 and covered the period 2002–2006. While many general conclusions prevail, some aspects of the labour market have changed since then. Most importantly, the present study examines the impact of the COVID-19 pandemic on the Polish labour market. The present paper also includes additional findings of change patterns over time for three groups of counties. These groups were chosen based on their economic history and current funding programmes. Additionally, spatial effects are discussed.
Considering the outlined research problem, the following hypotheses are proposed:
H1: The unemployment rate had the strongest influence on relative wages in Poland at the county level in 2008–2021. H2: Changes in unemployment in a county between 2008 and 2021 affected changes in relative wages in adjacent counties. H3: Changes in relative wages in a county between 2008 and 2021 affected changes in relative wages in adjacent counties. H4: The unemployment rate and relative labour productivity statistically significantly explained relative wage rates by county between 2008 and 2021.
In examining differences in unemployment rates, labour productivity and gross wages by county in the years 2008–2021, both the spatial and the temporal approach was adopted. Based on the data, the value of an indicator was computed for each county as a mean of values recorded year by year. These results were used to make an analysis of spatial differentials. In addition, counties were divided into three groups, namely Eastern Poland counties, Western Poland counties and Central Poland counties. Given this division, we computed the arithmetic mean, for each indicator in each year, of the values recorded in the counties falling into a category. These results were used to make a supplementary spatial analysis with an additional temporal analysis. A separate analysis was also made, concerning urban counties against the background of other counties.
Vast differences were revealed in the average unemployment rate in 2008–2021. The average unemployment rate from all counties amounted to about 11.97% with standard deviation around 5.02%, which means that the coefficient of variation was about 41.93%. The lowest values were characteristic of urban counties and their adjacent counties. This type of counties comprises almost half of counties falling into the first quintile. In the city of Poznań, the average unemployment rate was about 2.52%, and in Poznań County, 2.67%. In the capital city of Warsaw, the average unemployment rate was 2.81%. The highest unemployment rates were recorded in selected counties of Eastern and Central Poland. In Pisz, Łobez, Białogard, Radom and Kętrzyn Counties, it exceeded 24%. In Bartoszyce and Braniewo Counties (Warmian–Masurian Voivodeship), the average unemployment rates were 25.35% and 26.46%, respectively. The highest unemployment rate was recorded in Szydłowiec County (Masovian Voivodeship), amounting to 30.91%. In the group of eight counties where the average unemployment rate exceeded 24%, half were counties located in Eastern Poland. However, the distribution of county groups in the last quintile was quite uniform, although counties located in Eastern Poland still represented the largest percentage, precisely 38.16%. Spatial differences in unemployment are shown on Map 1.
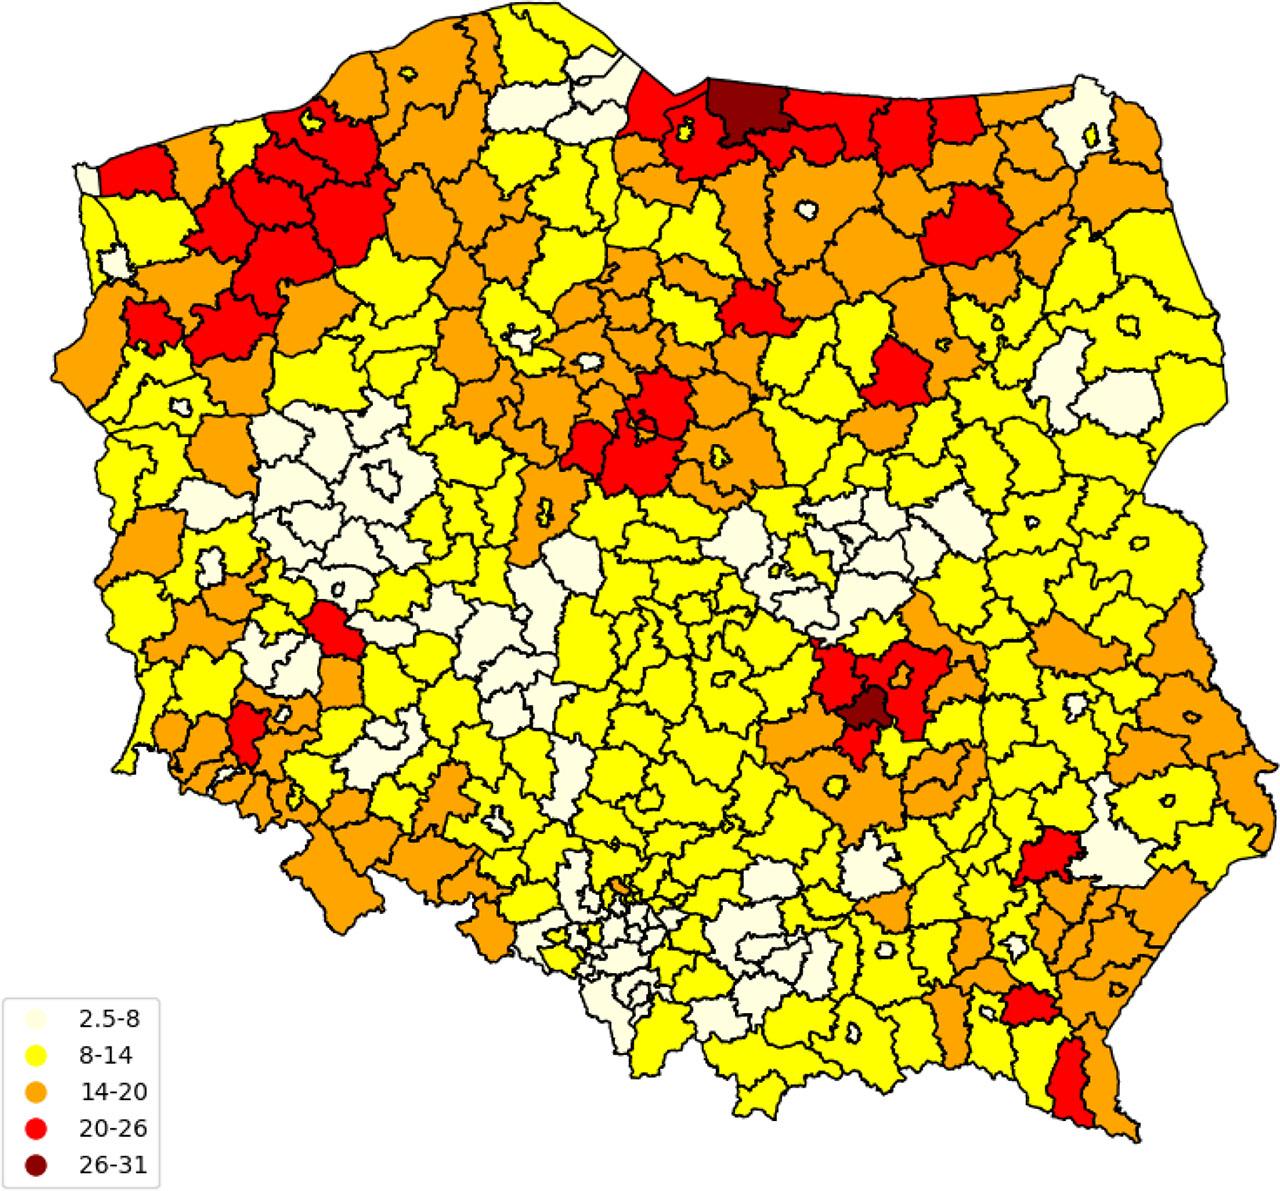
Spatial differences in the unemployment rate by county in 2008–2021 [%]
Source: Own elaboration
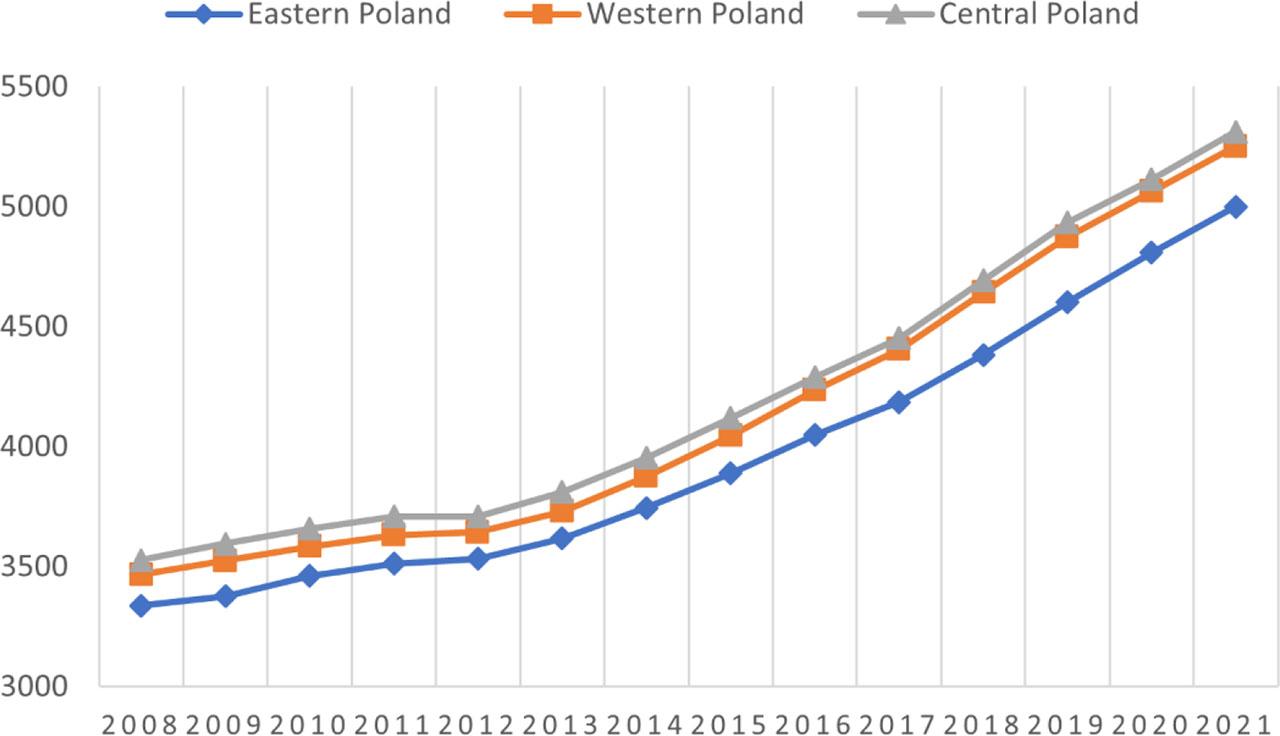
There is a characteristic that cannot be ignored here: each macroregional group includes counties with an unemployment rate exceeding 20%, and this makes the results (with the exception of the distinctly lower values among urban counties) relatively comparable, although worse rates are observed in Eastern Poland. Indeed, the average unemployment rate over the entire period in Western and Central Poland amounted to 11.45% and 11.19%, respectively. In Eastern Poland, it reached 13.85%. This is also confirmed by a study of temporal changes in unemployment rates characteristic of the indicated county groups as shown on Chart 1. It demonstrates that even if the change pattern of the unemployment rate in Eastern Poland counties was similar to that observed in the other two groups, the rate was higher over the entire period by about 2.5 percentage points.
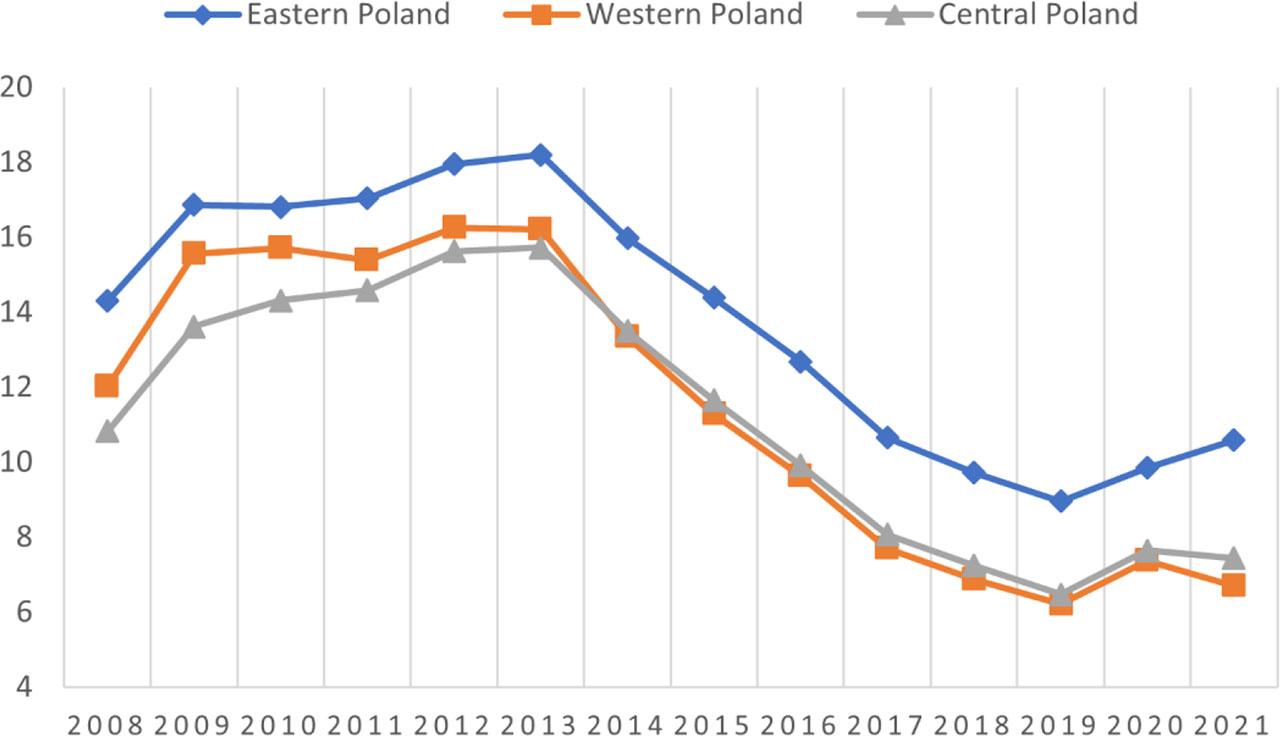
Change pattern of the unemployment rate by macroregions in 2008–2021 [%]
Source: Own elaboration
The change pattern between 2009 and 2013 indicated a general rise in unemployment. The highest unemployment levels were also recorded in those years. A minor deviation from the general trend was observed in Western Poland counties where the unemployment rate slightly fell in 2009–2011. In 2009–2013, the average unemployment level in Eastern Poland counties exceeded 16%. At its peak moment in 2013, it reached 18.18%. However, a clear downward trend was observed in 2013–2019. In 2019, the average unemployment rate in urban counties was 4.5%. This statistic also had comparable values in Central and Western Poland, where the average was 6.21%. As of 2013, an absolute difference between unemployment rates in these county groups was less than 0.5 p.p. The year 2020 marked a deviation from the trend, possibly caused by the COVID-19 pandemic, but the indicator began to fall in Western and Central Poland again in 2021. In Western Poland, it reached a level comparable to that from 2018. However, an increase in unemployment in Eastern Poland was observed as of 2020.
Labour productivity, computed as the ratio of sold production (expressed in PLN million, base year 2021) to the number of workers, did not exceed PLN 0.4 million per worker on average. The average from all counties during the studied period amounted to about PLN 0.099 million per worker. The standard deviation was about PLN 0.072 million per worker, which translates to a 72.87% coefficient of variation. A notable exception is the city Dąbrowa Górnicza, where average labour productivity in 2008–2021 was about PLN 0.57 million per worker. The group with high labour productivity is dominated by counties from Silesian Voivodeship and selected counties from Lower Silesian Voivodeship, plus Bełchatów County in Łódź Voivodeship. In Silesian Voivodeship, in addition to Dąbrowa Górnicza, the highest labour productivity was recorded in Bielsko-Biała town, where it reached about PLN 0.394 million per worker. Generally, labour productivity reached a relatively high level in multiple towns of the Silesian urban area. It amounted to about PLN 0.26 million per worker in Gliwice, to PLN 0.24 million per worker in Siemanowice Śląskie, and to PLN 0.22 million per worker in Jastrzębie-Zdrój. A clearer trend could be observed in counties with low labour productivity. Eastern Poland counties dominated this group. From among 38 counties where labour productivity was contained in the interval between PLN 0.005 million and 0.03 million per worker, 26 were located in Eastern Poland. The relationships described are presented on Map 2. Average results for the county groups over the entire period are also interesting. The highest labour productivity was observed in Western Poland, amounting to PLN 0.12 million per worker on average. In Central Poland, average labour productivity equalled about PLN 0.108 million per worker. In Eastern Poland, it was PLN 0.06 million per worker. A vast difference also occurred between urban and rural counties. Average labour productivity in urban counties was PLN 0.122 million per worker, while rural counties reached PLN 0.0987 million per worker.
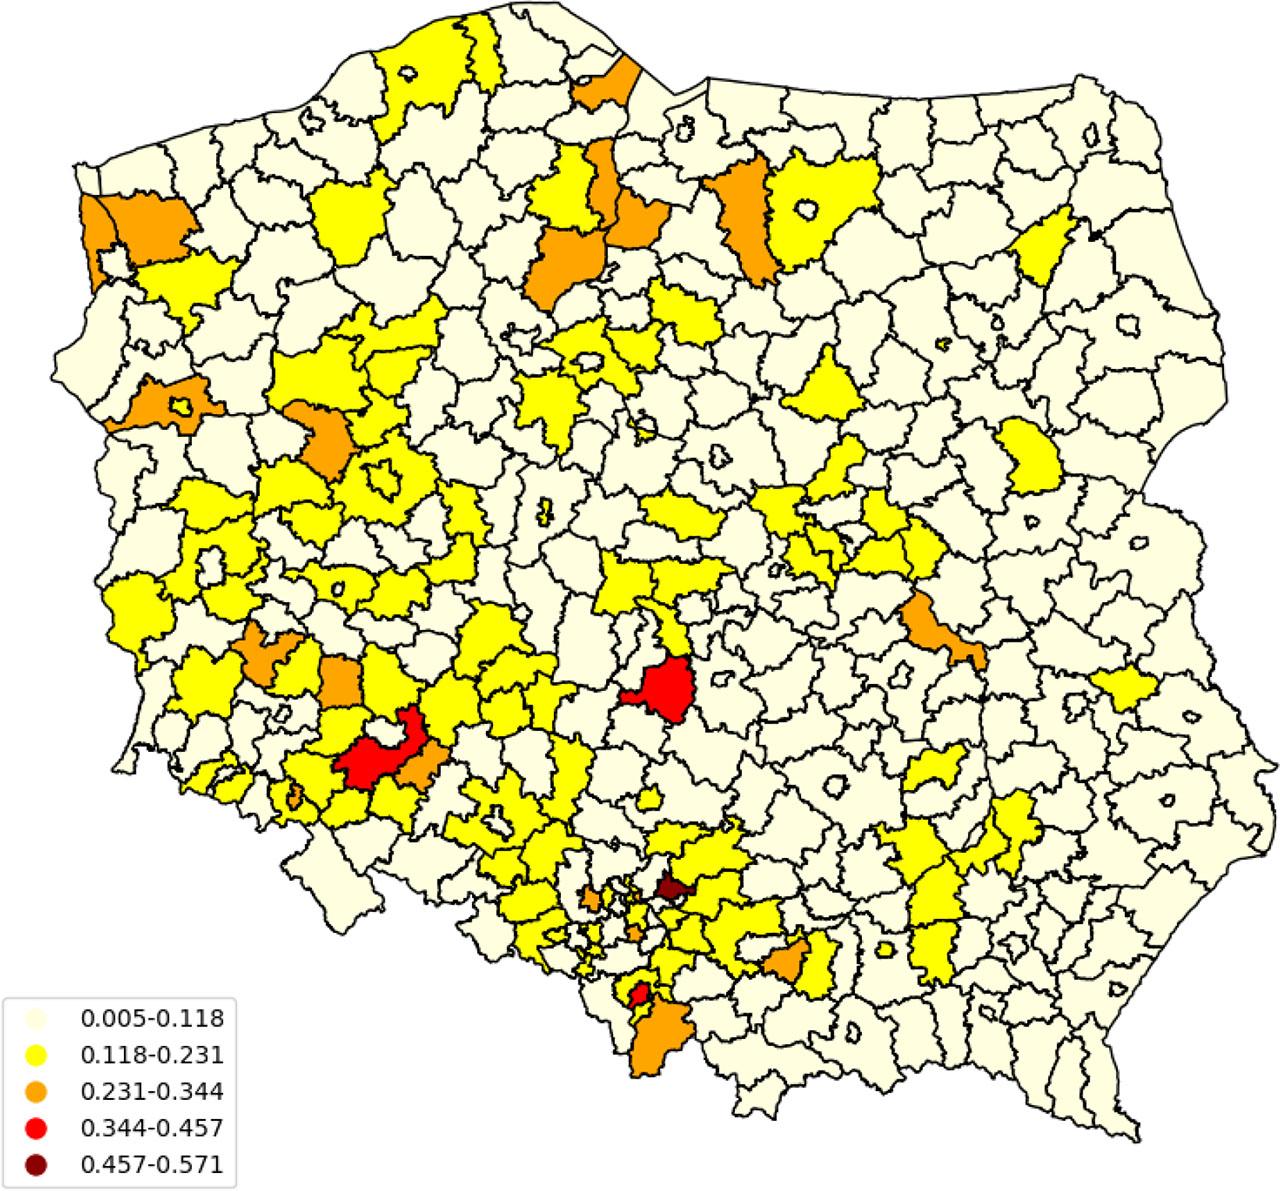
Spatial differences in labour productivity by county in 2008–2021 [PLN million/worker, constant prices from 2021]
Source: Own elaboration
Temporal differences in labour productivity per county group presented on Chart 2 clearly indicate that, except for a slight decline in Western Poland in 2008–2010, labour productivity in each county group showed a rising trend (or remained at a fairly constant level). However, a difference in labour productivity in absolute terms existed between the county groups over the entire period under study. The lowest level of labour productivity was characteristic of Eastern Poland. In 2010, it dropped to the lowest value of PLN 0.049 million per worker. However, like the other groups, it showed a general upward trend over the period under study, although its rise was rather slow prior to 2019, with the value of labour productivity in 2011–2016 remaining at a near constant level. Moreover, the difference between labour productivity in Eastern Poland and its average level in Western and Central Poland gradually rose from about PLN 0.04 million per worker to almost PLN 0.06 million per worker in 2019. Additionally, Western and Central Poland counties achieved a strong rise in 2020 and 2021. In Western Poland, labour productivity reached the highest levels over the entire period, and its value in 2021 was almost PLN 0.17 million per worker. Also, the difference between Western Poland and Central Poland did not exceed PLN 0.02 million per worker over the entire period under study. It is noteworthy that 2020 labour productivity in urban counties amounted to PLN 0.138 million per worker, showing a decline compared to 2019, probably caused by the COVID-19 pandemic. In 2021, the indicator reached a level exceeding that from 2019, rising to PLN 0.151 million per worker.
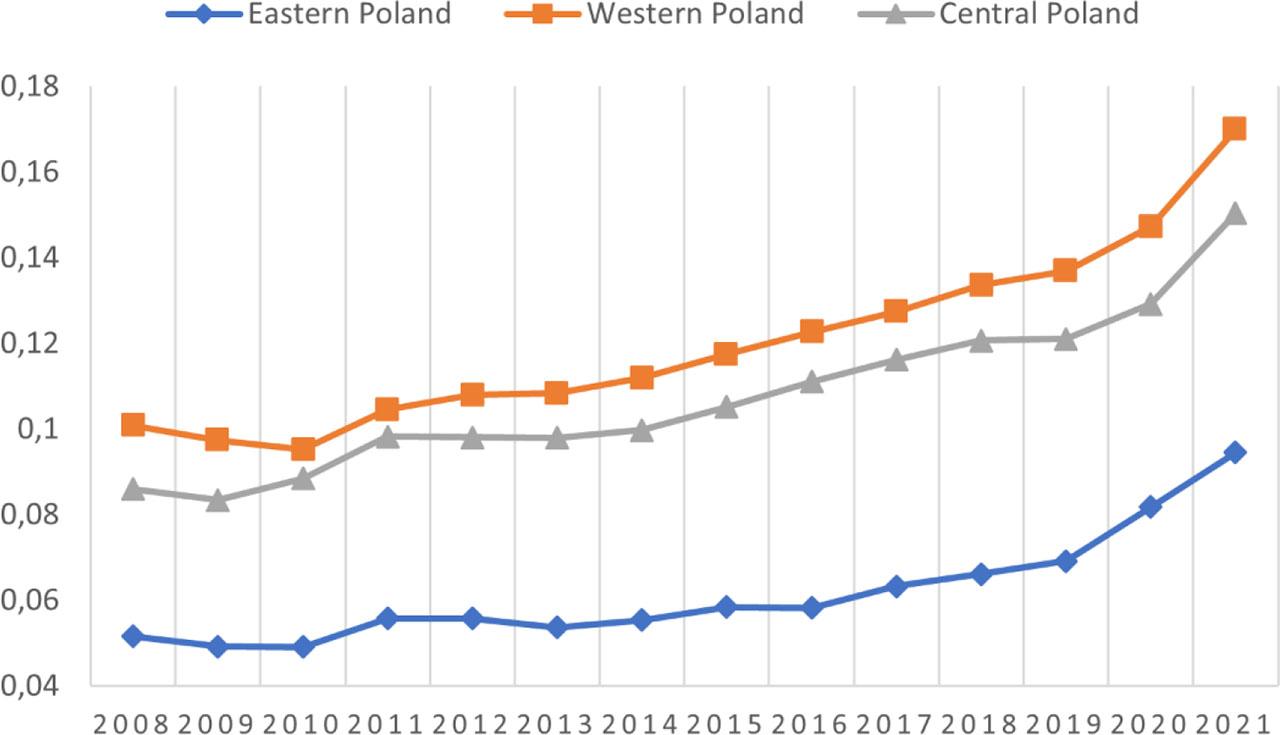
Change pattern of labour productivity by macroregions in 2008–2021 [PLN million/worker, constant prices from 2021]
Source: Own elaboration
Gross wages, for which 2021 was adopted as a base year, had a wide value range that resulted principally from the inclusion of some counties where extreme values of average wages were recorded in 2008–2021. In the vast majority of counties, wages were between PLN 3000 and 5000, but in Lubin County wages averaged to PLN 8,123.77. Distinctly high wages were also earned in Jastrzębie-Zdrój, averaging PLN 7,530.87. Additionally, wages exceeding PLN 6000 were recorded in the capital city of Warsaw (an average of PLN 6,484.13), in Bełchatów County (PLN 6,348.88), and in the city of Katowice (PLN 6,080.56). The average gross wages from all counties in the studied period was PLN 4,122.6, with a standard deviation of PLN 551.27, which translates to a 13.37% coefficient of variation of magnitude. Excluding the highest earning counties, the average wages drop to PLN 4,080.1, with standard deviation falling to PLN 426.3 and a 10.45% coefficient of variation. Urban counties clearly prevail in the group of counties with the highest wages. This type of county comprises almost half of the counties included in the first quintile. No clear trend can be observed in the group of counties with lower average gross wages. The indicated relationships are shown on Map 3. It must also be noted that the distribution of gross wages in Western and Central Poland was rather uniform. Almost 51% of Western Poland counties belonged to the second and third quintile, while Central Poland counties belonged to the first and the last quintile in considerable numbers. More than 46% of counties from this group belonged to these extreme quintiles. Lower gross wages were characteristic of Eastern Poland counties. The last two quintiles included more than 56% of counties from Eastern Poland.
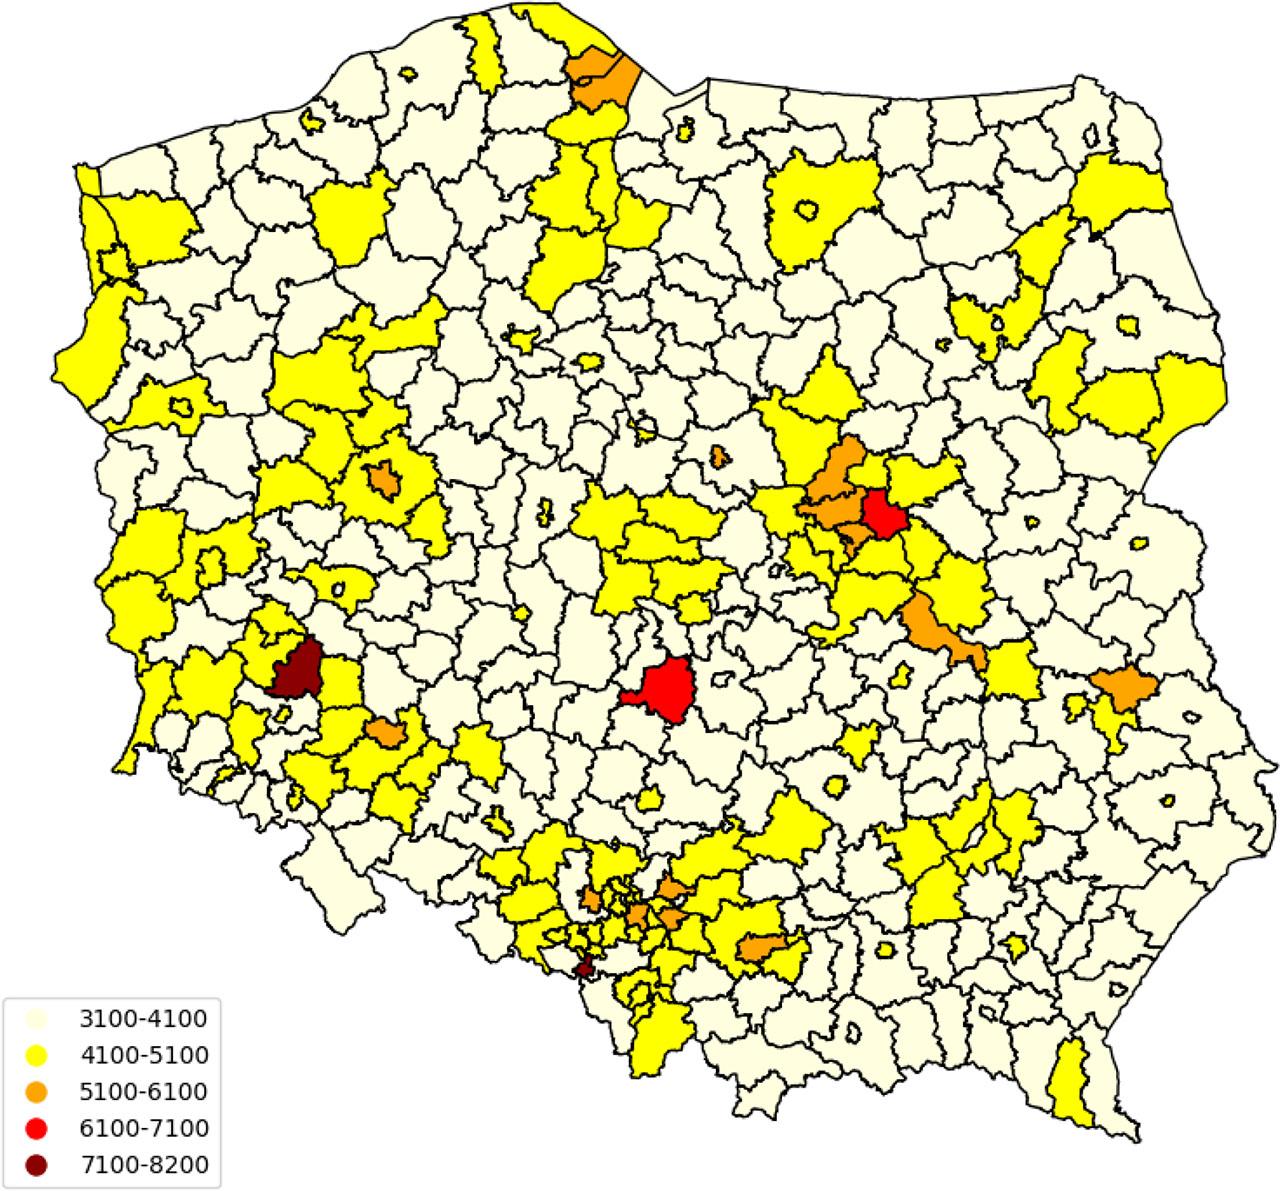
Spatial wage differentials by county in 2008–2021 [PLN, constant prices from 2021]
Source: Own elaboration
A clear difference between the wage characteristics of Western and Central Poland on the one hand and Eastern Poland on the other hand is also shown on Chart 3. Wages showed a similar change pattern in each county group over the entire period under study, with their distinct constant rise that accelerated especially after 2013. However, a lower level of wages was characteristic of Eastern Poland. Over the time period under study, the difference between wages in Central Poland and in Eastern Poland amounted to PLN 241.41 on average. Moreover, it rose from about PLN 190.45 in 2008 to PLN 312.07 in 2021. Also, over the entire period under study, wages in urban counties were higher by an average of PLN 600 than in rural counties. In 2021 average wages in rural counties were PLN 5,088.83, approximating wages in urban counties from 2018 (PLN 5,117.55), suggesting a lag of about 3 years between rural counties and urban counties regarding wages earned. In 2021, urban counties showed average wages reaching PLN 5,780.60.
Change pattern of gross wages by macroregions in 2008–2021 [PLN, constant prices from 2021]
Source: Own elaboration
For defining the main economic determinants of wages, useful tools are provided by the Solow economic growth model (1956) together with its generalisations and by the Solow model of efficiency wages (1979) (see Tokarski, 2005; Dykas & Misiak, 2013).
The model of efficiency wages is based on the assumption that individual enterprises aim to maximize the profit function given by:
The first order conditions for maximizing the profit function (1) can be reduced to the following formula:
The function of a typical worker’s efficiency can be described by the equation (see Dykas, 2017):
Then, assuming that the threshold wage xit is an increasing function of the average wage in an economy and a decreasing function of the unemployment rate, it may be written as:
The growth models proposed by Solow (1956), Mankiw-Romer-Weil (1992) and Nonneman-Vanchoudt (1996) show that wages are proportional in the long run to the marginal product of labour. Additionally, with a production function of the Cobb-Douglas type, wages and labour productivity converge, so that relative wages are proportional to relative labour productivity.
The theoretical discussion presented above leads to identifying the main determinants of relative wages, and to the following equation showing relative wages as a function of unemployment rates and relative labour productivity:
Estimation of the parameters in equation (6) was done using spatial econometrics, with a matrix of spatial weights based on contiguity, meaning a common county border. The spatial Durbin model (SDM) was adopted to include spatial interaction of the dependent variable (parameter ρ) and spatial lags of independent variables (parameter θk). By performing the Hausman test (Hausman, 1978) at a significance level below 1%, the Durbin model was then extended to include spatial fixed effects.
Table 1 contains a statement of parameter estimates of the wage equation in all counties in 2008–2021. These estimates and the preceding theoretical discussion lead to the following conclusions. The estimates indicate that the unemployment rate had the strongest influence on relative wages. A rise in the unemployment rate by one percentage point entailed a fall in relative wages by about 0.7 percentage points. We can also assume that if relative labour productivity in Poland rose by one percentage point, relative wages would rise by about 0.07 percentage points.
Estimates of the parameters in the equation describing relative wages, done using the SDM with time fixed effects
| SDM - spatial Durbin model | ||
|---|---|---|
| regressor | time fixed effects | |
| Main | uit | −0.7011*** (0.1253) |
|
| 0.0705*** (0.0119) | |
| constant | - | |
| θk | uit | 0.5399*** (0.1699) |
|
| 0.0037 (0.0128) | |
| ρ | 0.1923*** (0.0396) | |
| R2 | within | 0.6314 |
| between | 0.8254 | |
| overall | 0.7999 | |
| ll (model) | 5777.171 | |
| AIC | −11542.34 | |
| BIC | −11501.70 | |
| chi-square(5)=48.74 prob>=chi-square=0.0000 | ||
Notes: Significance levels:
p < 0.01,
p < 0.05,
p < 0.1, standard errors in brackets.
LL – log-likelihood, AIC – Akaike information criterion, BIC – Bayesian information criterion
Source: Own elaboration
The average unemployment rate amounted to about 11.97% with a standard deviation of 5.02% and variation coefficient of 41.93%. Pearson’s correlation coefficient with gross wages amounted to about −0.39. Average labour productivity, on the other hand, amounted to about PLN 0.099 million per capita with a standard deviation of PLN 0.07 million per capita and a variation coefficient of 72.87%. Pearson’s coefficient with gross wages amounted to about 0.49.
The estimated parameter θk proved to be statistically significant for the unemployment rate parameter estimate, showing that changes in unemployment rates in a county influenced changes in relative wages in adjacent counties.
The estimated parameter ρ also proved to be statistically significant. Therefore, it can be stated that changes in relative wages in a county influenced changes in relative wages in an adjacent county. In addition, the significance level of estimates of parameter ρ confirms that spatial econometrics methods can be successfully used in analysing relative wage rates by county.
The estimates for equation (6) show that the unemployment rate and relative labour productivity statistically significantly explain relative wage rates by county. The coefficient of determination in the spatial econometrics method applied ranged from 63% to 80%.
The authors will be happy to provide the Reader, on request, with complete results of estimation of the parameters in the equation describing relative wages, obtained using the SDM, and including all directions of spatial interaction according to the queen criterion.
Studies of spatial differences in unemployment rates, labour productivity and gross wages clearly identified more developed, urban counties where each of the indicators discussed reached better average levels. Additionally, by dividing counties into Eastern, Western and Central Poland counties, it was observed that results obtained for Eastern Poland, considering each of the indicators used, were worse than results achieved in the other regions. Results for Western and Central Poland were comparable to one another. On the other hand, the analysis of change patterns of the indicators in these groups shows similar trends. This indicates that even if Eastern Poland is affected by a certain stagnation compared to the other regions, there is no reason to conclude that the West and Centre develop at the cost of the East. It is noteworthy that Lubin County recorded an impressively high level of wages, similar to the largest urban centres. Importantly, the county is home to the copper-extraction joint-stock company KGHM Polska Miedź, and together with Polkowice, Głogów, Legnica counties and Legnica city, it forms the Legnica-Głogów Copper District. In particular, numerous copper mines are located in Polkowice County, and this is reflected by high labour productivity in that county, reaching PLN 0.33 million per worker. Similarly high levels of labour productivity were recorded by multiple towns in the Silesian urban area.
Both the unemployment rate and labour productivity show deviations from general trends when economic crises arise. In all county groups, the unemployment rate grew in 2008 and 2009 and did not fall significantly until 2013. A slight deviation from the downward trend occurred in 2020. Prior to 2020, urban counties recorded the highest level of labour productivity that was constantly rising, but a substantial fall occurred in 2020. The marked change of trends indicates principally the lasting consequences of the financial crisis that took place in the beginning of the period under study, and possibly effects of the COVID-19 pandemic that especially seem to have affected urban counties. This may also be related to the characteristics of the labour market in these counties. However, a clear stabilisation since 2021 gives reason for optimism. Moreover, even if an increase in gross wages in 2008–2012 was distinctly slower than in the following years, no marked change in wages was observed in 2020. Additionally, except the deviations indicated, a constant rise in labour productivity and gross wages is evident in each of the delineated regions of Poland.
The empirical analysis and the results obtained confirm the proposed research hypotheses. The factor with the strongest influence on wages by county in 2008–2021 was the unemployment rate. Both independent variables, namely the unemployment rate and labour productivity, significantly explained the dependent variable. In this connection, an increase in the unemployment rate had a negative effect (a regression coefficient equal to −0.7011) while an increase in labour productivity had a positive effect (a regression coefficient equal to 0.0705) on relative wages. Moreover, the study demonstrated that a change in the unemployment rate or in relative wages in a county influenced a change in relative wages in adjacent counties.
A comparison of the results obtained from empirical analysis with a spatial analysis of each of the indicators examined leads to interesting conclusions. Considering the negative effect of the unemployment rate and the positive effect of labour productivity on wages, the absolute advantage of urban counties is evident. Additionally, low labour productivity and higher unemployment rates were shown to be characteristic of Eastern Poland counties. However, the results obtained may suggest a possible reduction in the current differences between Poland’s regions. Local authorities of rural counties are advised to adopt a policy aimed at improving labour productivity or increasing employment in their areas. Another topic to be considered is the high level of labour productivity within counties located in the Silesian urban area, undoubtedly related to the operation of coal mines. Considering current trends of phasing out non-renewable energy sources, a reasonable policy for those counties to follow would consist in a gradual remodelling of their labour markets and sources of high labour productivity.
Our analysis is limited regarding the number of wage determinants examined. Research must be continued on other factors influencing wages at a regional level. Interesting results can be produced by studying such factors as the number of existing businesses or the size of completed capital projects. Important factors also include both domestic migration and immigration.