

Figure 1.
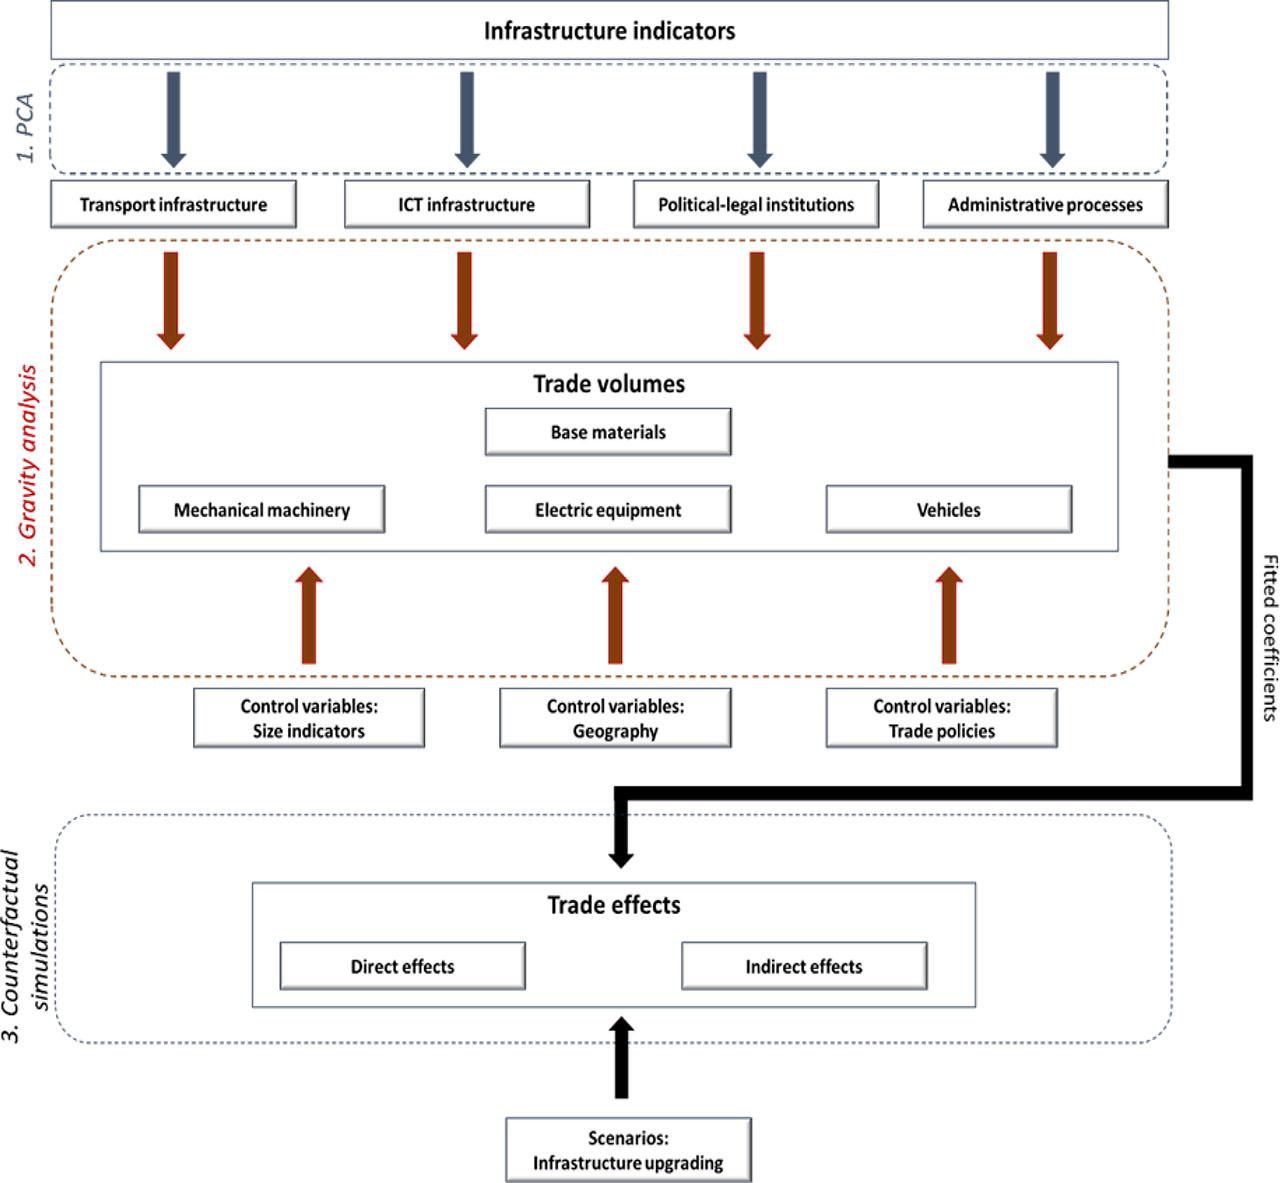
Figure 2.
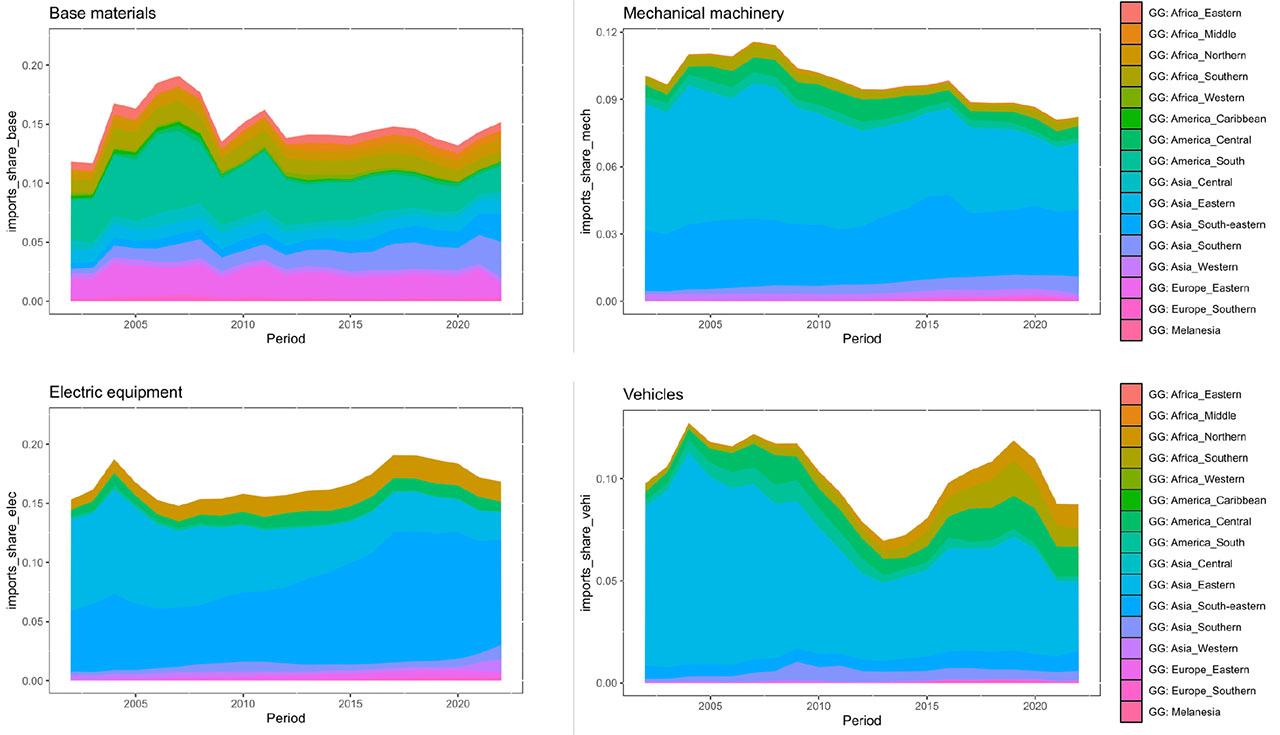
Figure 3.
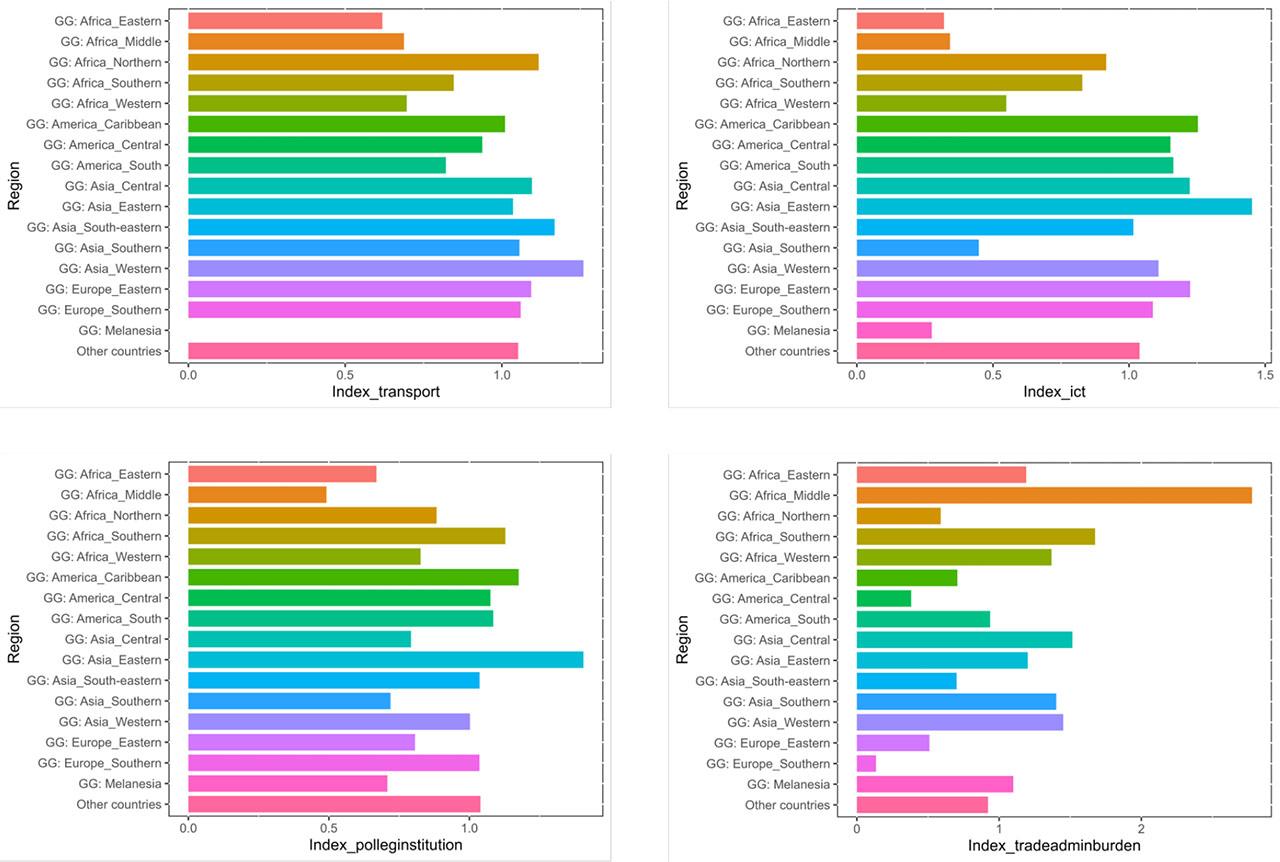
Figure 4.
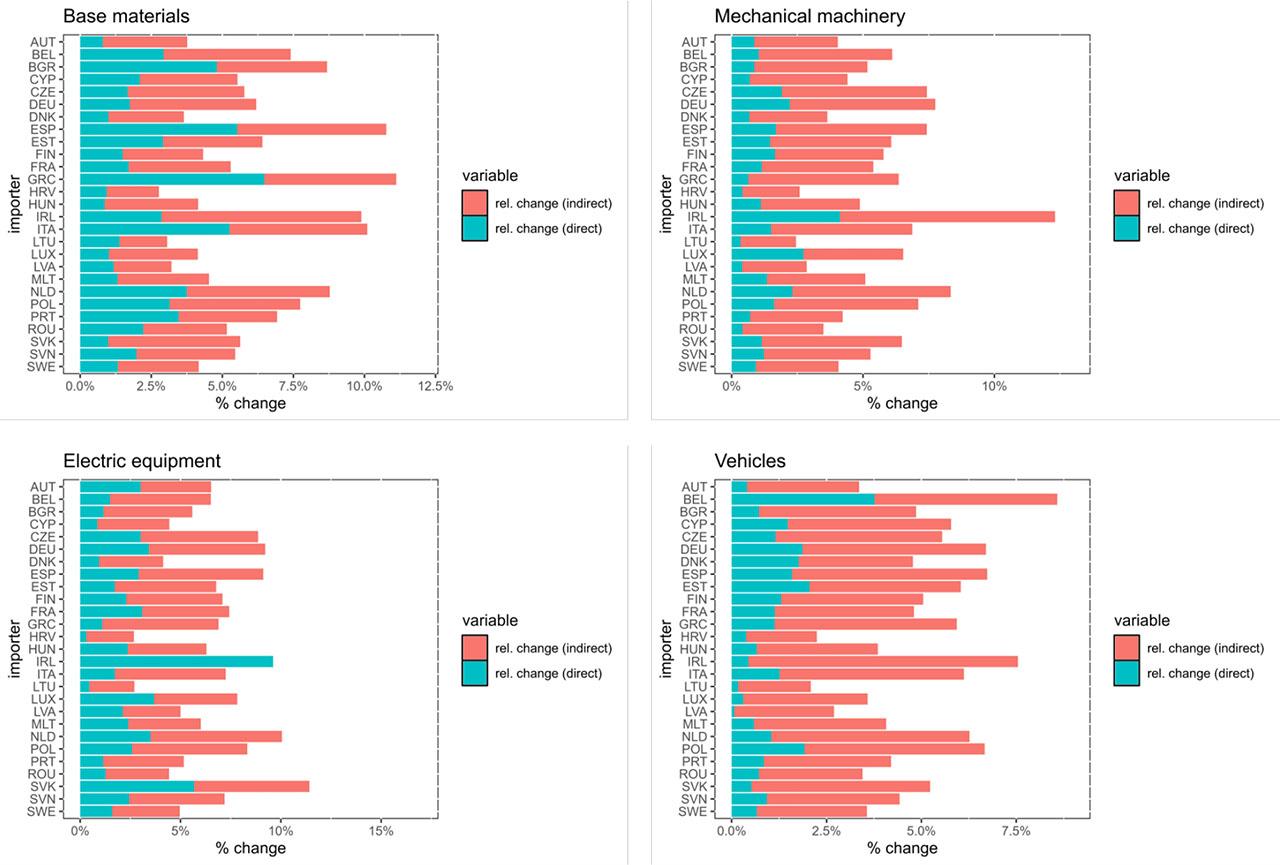
Figure 5.
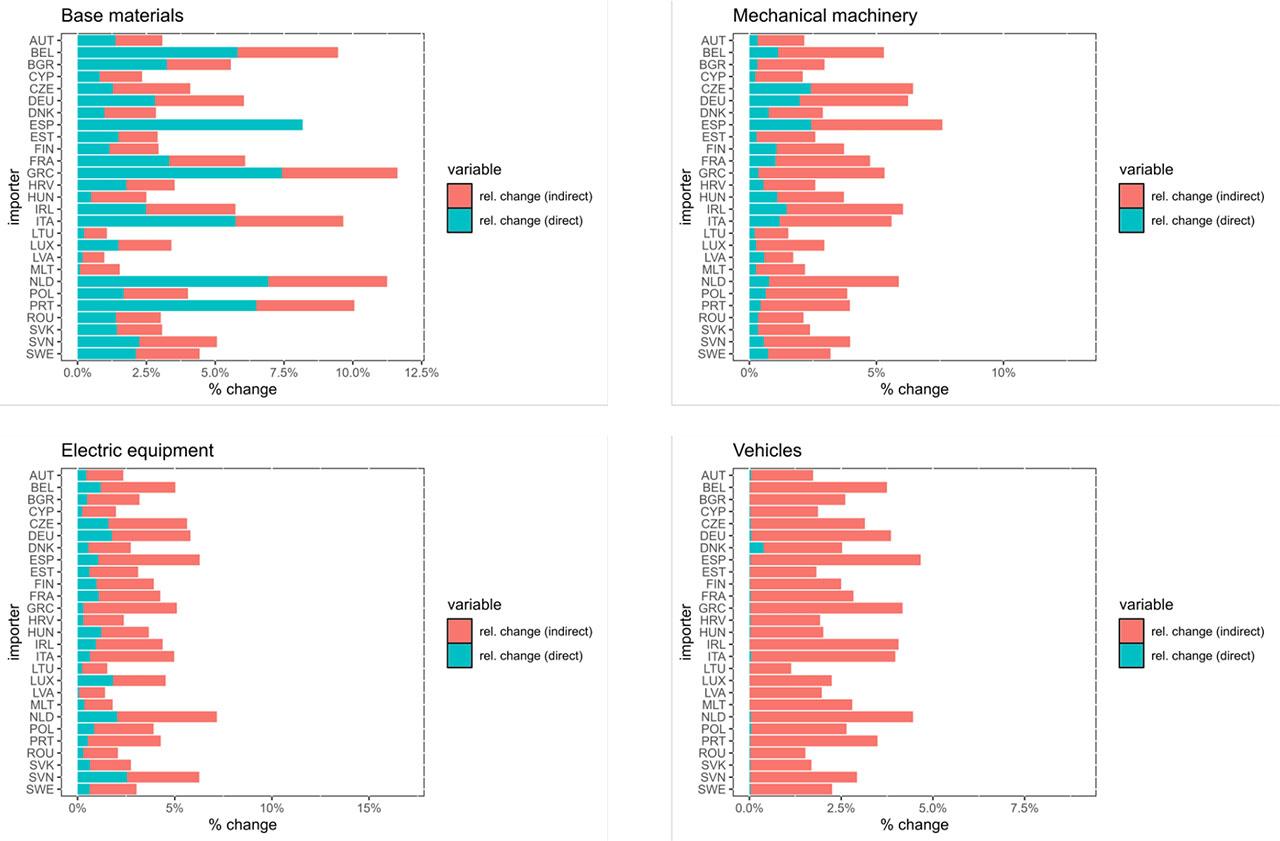
Figure 6.
List of variables and data sources
| Variable name | Description | Data source |
|---|---|---|
| Trade flow measures | ||
| tradep=base materials | Bilateral trade volumes in HS chapters inorganic chemicals (HS-Code: 28), iron and steel (72), articles of iron or steel (73), copper articles (74), nickel articles (75), aluminium articles (76), lead articles (78), zinc articles (79), tin articles (80), other base metals (81) | UN Comtrade (2024) |
| tradep=mechanical machinery | Bilateral trade volumes in HS chapter 84 | UN Comtrade (2024) |
| tradep=electric equipment | Bilateral trade volumes in HS chapter 85 | UN Comtrade (2024) |
| tradep=vehicles | Bilateral trade volumes in HS chapters 87.88. and 89 | UN Comtrade (2024) |
| Trade partner size measures | ||
| massi | Exporter supply potential: value added in medium- and high-tech manufacturing + total imports of base materials, mechanical machinery, electric equipment, vehicles | World Bank (2024a); UN Comtrade (2024) |
| massj | Importer demand potential: GDP + total imports of base materials, mechanical machinery, electric equipment, vehicles | World Bank (2024a); UN Comtrade (2024) |
| pop | Population size | World Bank (2024a) |
| area | Land area | World Bank (2024a) |
| Bilateral trade cost measures | ||
| dist | Great-circle distance (see Mayer & Zignago, 2011) | CEPII (2024) |
| bord | Existence of common border (dummy) | CEPII (2024) |
| lang | Existence of common official language (dummy) | CEPII (2024) |
| col | Existence of former colonial relation (dummy) | CEPII (2024) |
| tariff | Weighted average of (product-group) specific tariffs | UNCTAD (2024) |
| rta | Existence of joint trade agreement (dummy) | Larch (2024) |
| Infrastructure measures: transport (trans) | ||
| quality of trade-infrastructure | Perceived quality of transport- and trade related infrastructure (Pillar from Logistics Performance Index) | World Bank (2024a) |
| road quality | Perceived quality of roads (survey) | WEF (2020) |
| road network density | Relation of road length to land area | IRF (2024) |
| share of paved roads | Relation of length of paved roads to total road length | IRF (2024) |
| access to electricity | Share of population with access to electricity | World Bank (2024a) |
| Infrastructure measures: ict (ict) | ||
| broadband subscriptions | Share of population with broadband subscriptions | World Bank (2024a) |
| telephone subscriptions | Share of population with telephone subscriptions | World Bank (2024a) |
| internet users | Share of population using the internet | World Bank (2024a) |
| mobile subscriptions | Share of population with mobile subscriptions | World Bank (2024a) |
| secure internet servers | Number of secure internet servers per 1 million people | World Bank (2024a) |
| Infrastructure measures: political-legal institutions (pol) | ||
| political stability | Perceived protection against political instability and/or politically-motivated violence, including terrorism | World Bank (2024b) |
| government effectiveness | Perceptions of the quality of public services, the quality of the civil service and the degree of its independence from political pressures, the quality of policy formulation and implementation, and the credibility of the government’s commitment to such policies | World Bank (2024b) |
| regulatory quality | Perceptions of the ability of the government to formulate and implement sound policies and regulations that permit and promote private sector development | World Bank (2024b) |
| control of corruption | Perceived protection against the risk that public power is exercised for private gain, including both petty and grand forms of corruption, as well as “capture” of the state by elites and private interests | World Bank (2024b) |
| rule of law | Perceptions of the extent to which agents have confidence in and abide by the rules of society, and in particular the quality of contract enforcement, property rights, the police, and the courts, as well as the likelihood of crime and violence | World Bank (2024b) |
| Infrastructure measures: administrative burden – trade (tradeburd) | ||
| time to export: border compliance | Time associated with compliance with the economy’s customs regulations and with regulations relating to other inspections related to the export process | World Bank (2019) |
| time to export: documentary compliance | Time associated with compliance with the documentary requirements related to the export process | World Bank (2019) |
| time to import: border compliance | Time associated with compliance with the economy’s customs regulations and with regulations relating to other inspections related to the import process | World Bank (2019) |
| time to import: documentary compliance | Time associated with compliance with the documentary requirements related to the import process | World Bank (2019) |
| Infrastructure measures: administrative burden - business formation (entry) | ||
| business formation: costs | Cost of business start-up procedures | World Bank (2019) |
| business formation: procedures | Start-up procedures to register a business | World Bank (2019) |
| business formation: time | Time required to start a business | World Bank (2019) |
Estimation results gravity model – alternative specifications (outcome equations)
| Dependent variables | ||||||||
|---|---|---|---|---|---|---|---|---|
| ln(tradebase materials) | ln(trademechanical machinery) | |||||||
| Specification 1 | Specification 2 | Specification 1 | Specification 2 | |||||
| Estimate | t-value | Estimate | t-value | Estimate | t-value | Estimate | t-value | |
| ln(transit-1) | 1.970 | 14.096*** | 1.498 | 14.885*** | ||||
| ln(ictit-1) | 1.446 | 14.690*** | 0.801 | 11.310*** | ||||
| ln(polit-1) | 1.125 | 7.706*** | 2.448 | 23.398*** | ||||
| ln(tradeburdit-1) | −0.156 | −14.363*** | −0.180 | −23.585*** | ||||
| ln(transit-2) | 2.022 | 12.463*** | 1.535 | 12.922*** | ||||
| ln(ictit-2) | 1.367 | 12.193*** | 0.761 | 9.391*** | ||||
| ln(polit-2) | 0.817 | 4.909*** | 2.331 | 19.480*** | ||||
| ln(tradeburdit-2) | −0.137 | −10.767*** | −0.173 | −19.561*** | ||||
| adj. R2 | 0.589 | 0.591 | 0.736 | 0.734 | ||||
| no. observations | 19,699 | 14,381 | 19,699 | 14,381 | ||||
Simulated impact of a 50 % drop in Chinese exports on EU imports
| Scenario | ||||||
|---|---|---|---|---|---|---|
| Situation 2022 | General strengthening | Development focus | ||||
| Product group | Direct effects | Indirect effects | Direct effects | Indirect effects | Direct effects | Indirect effects |
| Base materials | −2.82 % | −3.59 % | −2.83 % | −4.15 % | −2.80 % | −4.09 % |
| Electric equipment | −15.46 % | −5.92 % | −15.56 % | −6.59 % | −15.38 % | −6.29 % |
| Mechanical machinery | −9.36 % | −4.63 % | −9.41 % | −5.17 % | −9.31 % | −5.01 % |
| Vehicles | −3.04 % | −3.22 % | −3.06 % | −3.64 % | −3.04 % | −3.46 % |
List of Global Gateway countries
| Country code | World region | Country code | World region |
|---|---|---|---|
| AGO | Middle Africa | MAR | Northern Africa |
| ALB | Southern Europe | MAR | Northern Africa |
| ARG | South America | MDA | Eastern Europe |
| ARM | Western Asia | MDG | Eastern Africa |
| BDI | Eastern Africa | MEX | Central America |
| BEN | Western Africa | MKD | Southern Europe |
| BGD | Southern Asia | MNG | Eastern Asia |
| BRA | South America | MOZ | Eastern Africa |
| BRB | Caribbean | MRT | Western Africa |
| CHL | South America | MWI | Eastern Africa |
| CIV | Western Africa | MYS | Southeastern Asia |
| CMR | Middle Africa | NAM | Southern Africa |
| COD | Middle Africa | NER | Western Africa |
| COG | Middle Africa | NGA | Western Africa |
| COL | South America | PAK | Southern Asia |
| CPV | Western Africa | PAN | Central America |
| CRI | Central America | PER | South America |
| DJI | Eastern Africa | PHL | Southeastern Asia |
| DOM | Caribbean | PNG | Melanesia |
| ECU | South America | RWA | Eastern Africa |
| EGY | Northern Africa | SEN | Western Africa |
| ETH | Eastern Africa | SOM | Eastern Africa |
| GEO | Western Asia | TCD | Middle Africa |
| GHA | Western Africa | THA | Southeastern Asia |
| GMB | Western Africa | TJK | Central Asia |
| GNB | Western Africa | TUN | Northern Africa |
| IDN | Southeastern Asia | TZA | Eastern Africa |
| IND | Southern Asia | UGA | Eastern Africa |
| IRQ | Western Asia | UKR | Eastern Europe |
| ISR | Western Asia | URY | South America |
| JAM | Caribbean | VNM | Southeastern Asia |
| JOR | Western Asia | ZAF | Southern Africa |
| JPN | Eastern Asia | ZMB | Eastern Africa |
| KAZ | Central Asia | ZWE | Eastern Africa |
| KEN | Eastern Africa |
Estimation results gravity model
| Dependent variables | ||||||||
|---|---|---|---|---|---|---|---|---|
| ln(tradebase materials) | ln(trademechanical machinery) | |||||||
| Selection | Outcome | Selection | Outcome | |||||
| Estimate | t-value | Estimate | t-value | Estimate | t-value | Estimate | t-value | |
| Regressors | ||||||||
| intercept | −17.845 | −39.283*** | −36.027 | −47.214*** | −17.494 | −29.609*** | −42.256 | −82.056*** |
| ln(massi) | 0.199 | 9.456*** | 0.474 | 13.386*** | 0.320 | 11.702*** | 1.009 | 39.767*** |
| ln(massj) | 0.503 | 40.708*** | 1.287 | 66.437*** | 0.400 | 26.038*** | 1.062 | 87.586*** |
| ln(popi) | 0.380 | 14.536*** | 0.779 | 18.166*** | 0.185 | 5.746*** | 0.503 | 16.590*** |
| ln(popj) | −0.052 | −3.670*** | −0.020 | −0.926 | 0.026 | 1.431 | 0.098 | 6.337*** |
| ln(areai) | 0.047 | 4.119*** | 0.190 | 11.012*** | 0.023 | 1.568 | 0.027 | 2.226* |
| ln(areaj) | −0.051 | −5.963*** | −0.038 | −3.039** | −0.024 | −2.228* | −0.016 | −1.709 |
| ln(distij) | −0.512 | −23.583*** | −1.431 | −50.460*** | −0.309 | −11.371*** | −0.909 | −45.667*** |
| bordij | 3.014 | 0.091 | 1.096 | 5.756*** | 3.026 | 0.057 | 1.543 | 10.545*** |
| langij | 0.187 | 3.229** | 0.492 | 5.532*** | 0.421 | 5.116*** | 0.537 | 8.412*** |
| colij | 0.407 | 2.735** | 1.428 | 11.366*** | 0.866 | 2.557* | 0.917 | 9.677*** |
| ln(1+tariffijpt) | −1.257 | −4.171*** | −3.932 | −8.148*** | −1.189 | −3.327*** | −0.134 | −0.382 |
| rtaijt | 0.129 | 5.096*** | 0.612 | 15.613*** | 0.106 | 3.249** | 0.281 | 9.797*** |
| ln(transit) | 0.592 | 8.004*** | 1.864 | 14.892*** | 0.750 | 8.301*** | 1.448 | 16.022*** |
| ln(ictit) | 0.378 | 7.089*** | 1.395 | 15.623*** | 0.261 | 3.989*** | 0.788 | 12.325*** |
| ln(polit) | 0.985 | 11.786*** | 1.302 | 9.928*** | 0.869 | 8.697*** | 2.640 | 28.121*** |
| ln(tradeburdit) | −0.100 | −14.328*** | −0.171 | −17.487*** | −0.032 | −3.313*** | −0.187 | −27.177*** |
| ln(entryit) | −0.089 | −2.879** | - | - | −0.073 | −1.862 | - | - |
| year 2016 | 0.005 | 0.144 | −0.101 | −1.824 | −0.015 | −0.337 | −0.065 | −1.622 |
| year 2017 | −0.075 | −2.055* | −0.221 | −3.945*** | −0.076 | −1.654 | −0.117 | −2.884** |
| year 2018 | −0.061 | −1.656 | −0.108 | −1.920 | −0.060 | −1.287 | −0.142 | −3.469*** |
| year 2019 | 0.005 | 0.126 | −0.213 | −3.804*** | 0.004 | 0.077 | −0.164 | −4.006*** |
| mrijpt | - | - | 0.753 | 7.064*** | - | - | 0.937 | 8.586*** |
| adj. R2 | 0.586 | 0.737 | ||||||
| no. observations | 25,626 | 25,626 | ||||||
Number of Global Gateway flagship projects launched by thematic area
| Thematic area | Projects launched | |
|---|---|---|
| Year 2023 | Year 2024 | |
| Energy & Climate | 49 | 61 |
| Transport | 17 | 32 |
| Digital sector | 11 | 18 |
| Health | 7 | 14 |
| Education & Research | 3 | 14 |
| Total | 87 | 138 |
Results of Principal Component Analyses
| Index: Transport (trans) | |||||
|---|---|---|---|---|---|
| Eigenvectors | |||||
| Variables | Vector 1 | Vector 2 | Vector 3 | Vector 4 | Vector 5 |
| quality of trade infrastructure | 0.470 | −0.174 | 0.279 | −0.215 | −0.791 |
| access to electricity | 0.466 | −0.211 | 0.127 | 0.838 | 0.141 |
| road quality | 0.467 | −0.189 | 0.416 | −0.470 | 0.593 |
| road network density | 0.361 | 0.932 | 0.031 | 0.027 | 0.013 |
| share of paved roads | 0.462 | −0.146 | −0.856 | −0.173 | 0.052 |
| Contributions | |||||
| eigenvalue | 2.100 | 0.701 | 0.255 | 0.158 | 0.099 |
| proportion of variance | 0.882 | 0.098 | 0.013 | 0.005 | 0.002 |
| cumulative proportion | 0.882 | 0.980 | 0.993 | 0.998 | 1.000 |
| Index: ICT (ict) | |||||
| Eigenvectors | |||||
| Variables | Vector 1 | Vector 2 | Vector 3 | Vector 4 | Vector 5 |
| broadband subscriptions | 0.484 | −0.060 | 0.315 | 0.650 | −0.490 |
| telephone subscriptions | 0.465 | −0.214 | 0.623 | −0.580 | 0.117 |
| internet users | 0.486 | −0.139 | −0.254 | 0.321 | 0.760 |
| mobile subscriptions | 0.465 | −0.210 | −0.669 | −0.351 | −0.411 |
| secure internet servers | 0.312 | 0.942 | −0.026 | −0.121 | 0.016 |
| Contributions | |||||
| eigenvalue | 2.016 | 0.825 | 0.430 | 0.225 | 0.132 |
| proportion of variance | 0.813 | 0.136 | 0.037 | 0.010 | 0.003 |
| cumulative proportion | 0.813 | 0.949 | 0.986 | 0.997 | 1.000 |
| Index: Political-legal institutions (pol) | |||||
| Eigenvectors | |||||
| Variables | Vector 1 | Vector 2 | Vector 3 | Vector 4 | Vector 5 |
| control of corruption | 0.453 | −0.202 | −0.732 | 0.313 | −0.346 |
| government effectiveness | 0.460 | −0.189 | 0.151 | −0.791 | −0.322 |
| political stability | 0.404 | 0.912 | 0.035 | 0.041 | −0.041 |
| regulatory quality | 0.453 | −0.257 | 0.655 | 0.520 | −0.172 |
| rule of law | 0.463 | −0.159 | −0.105 | −0.064 | 0.864 |
| Contributions | |||||
| eigenvalue | 2.133 | 0.554 | 0.292 | 0.182 | 0.153 |
| proportion of variance | 0.910 | 0.061 | 0.017 | 0.007 | 0.005 |
| cumulative proportion | 0.910 | 0.972 | 0.989 | 0.995 | 1.000 |
| Index: Administrative burden – trade (tradeburd) | |||||
| Eigenvectors | |||||
| Variables | Vector 1 | Vector 2 | Vector 3 | Vector 4 | |
| time to export: border compliance | 0.503 | −0.462 | 0.484 | 0.547 | |
| time to export: documentary compliance | 0.505 | 0.424 | 0.506 | −0.555 | |
| time to import: border compliance | 0.497 | −0.531 | −0.530 | −0.436 | |
| time to import: documentary compliance | 0.494 | 0.570 | −0.478 | 0.449 | |
| Contributions | |||||
| eigenvalue | 1.809 | 0.620 | 0.461 | 0.364 | |
| proportion of variance | 0.818 | 0.096 | 0.053 | 0.033 | |
| cumulative proportion | 0.818 | 0.914 | 0.967 | 1.000 | |
| Index: Administrative burden – business formation (entry) | |||||
| Eigenvectors | |||||
| Variables | Vector 1 | Vector 2 | Vector 3 | ||
| business formation: costs | 0.537 | 0.823 | −0.186 | ||
| business formation: procedures | 0.584 | −0.522 | −0.622 | ||
| business formation: time | 0.609 | −0.225 | 0.761 | ||
| Contributions | |||||
| eigenvalue | 1.509 | 0.704 | 0.476 | ||
| proportion of variance | 0.759 | 0.165 | 0.075 | ||
| cumulative proportion | 0.759 | 0.925 | 1 | ||