

The EU’s ambitious goal to decarbonise its industrial base in the midst of fundamental geo-economic shifts sets new expectations for trade policy. With the paradigm of “open strategic autonomy” set out in its Trade Policy Review 2021 (European Commission, 2021a), the EU aims to reconcile the idea of a rules-based world trade with the needs of its own green transformation. A central aim is to diversify supply channels, in particular for strategically important raw materials and industrial goods for net-zero technologies. This would reduce the EU’s strong external dependencies and thus increase its economic and political room to manoeuvre. Negotiating new free trade agreements is an important tool, but not the only one. In the case of many low- and middle-income third countries, a fundamental priority is to create local export capacity by supporting infrastructure development.
The Global Gateway initiative announced in December 2021 is therefore of strategic importance for the future of EU external trade (European Commission, 2021b). Global Gateway is an almost global EU investment strategy to finance infrastructure development in third countries. It puts the EU in direct competition with similar initiatives by other economic powers, notably China’s Belt and Road Initiative. Global Gateway is therefore both part of an economic diversification strategy and a pawn in the geopolitical chess game. Previous analyses have focused on the latter aspect. However, such a perspective is insufficient given the surge in external supply risks perceived by policymakers and businesses (WEF, 2024). Without a successful diversification of external supply channels, the EU will have to choose between accepting its vulnerability (and thus susceptibility to economic blackmail) or isolation.
This study aims to fill this gap with a trade-centred perspective on Global Gateway. It focuses on the potential impact of external infrastructure investment on EU trade in product groups with high relevance for net-zero technologies. Using a panel dataset of global EU trade with non-EU countries (“third countries”), it estimates the impact of infrastructure quality on trade volumes and uses the results to simulate counterfactual scenarios of infrastructure improvements, distinguishing between product groups and infrastructure categories. The scenarios are compared in terms of their impact on general trade diversification and their response to a specific “China shock”. In doing so, the paper contributes both to a deeper understanding of the potential trade effects of Global Gateway and to the general literature on the links between infrastructure and international trade.
The Global Gateway initiative, unveiled in December 2021, aims to boost Europe’s green agenda, support infrastructure development worldwide and improve connectivity in various sectors, including digital technology, climate and energy, transport, health, education and research. Its first milestone was an Africa–Europe Investment Package, which earmarked €150 billion for cooperation with African partners (European Commission, 2024a). In 2023, the EU launched 87 major flagship projects worldwide. For 2024, 138 new projects are in the pipeline (European Commission, 2023a). Table 1 shows the distribution of flagship projects by thematic area.
Number of Global Gateway flagship projects launched by thematic area
| Thematic area | Projects launched | |
|---|---|---|
| Year 2023 | Year 2024 | |
| Energy & Climate | 49 | 61 |
| Transport | 17 | 32 |
| Digital sector | 11 | 18 |
| Health | 7 | 14 |
| Education & Research | 3 | 14 |
| Total | 87 | 138 |
Source: European Commission (2023a)
The financial structure of Global Gateway is based on a complex system of blended financing. Between 2021 and 2027, a total of up to €300 billion of public and private funding will be mobilised. The geographical coverage is broad, in line with the EU’s geopolitical ambitions, covering Asia, Africa, Latin America and Eastern European neighbours. Between 2023 and 2024, around 9 out of 10 projects will be launched in Africa, Asia and Latin America. As announced at the EU-AU (African Union) Summit on 17–18 February 2022, Africa is at the heart of the initiative. Team Europe intends to invest around €150 billion in the region, mainly through the Africa–Europe Investment Package (European Commission, 2023b).
Recent years have seen a surge in empirical studies examining the relationship between public infrastructure and international trade. This research is driven by the theoretical framework of trade economics. The gravity model of trade theory states that the extent of bilateral trade between two countries is a function of their respective economic mass and their distance. This is analogous to the physical law of gravity. The concept of distance is not merely about physical distance. It is a holistic concept that encompasses the set of factors influencing the total cost of trade between two countries. These factors include not only tariffs and other trade policy measures (such as cost-inducing product standards and approval procedures) but also the public infrastructure of the countries involved.
The definition of infrastructure varies depending on the object of investigation. Martin and Rogers (1995) define public infrastructure as “any facility, good, or institution provided by the state which facilitates the junction between production and consumption”. This definition is not limited to just the physical infrastructure created under the influence of the state, such as roads, bridges and communication networks. It also accounts for the role of institutions as intangible infrastructure, namely the influence of the state on the rules and procedures shaping economic life. These are also relevant for cross-border trade, influencing the transaction costs of trading partners.
A large share of econometric studies analysing the influence of infrastructure on international trade flows are based on the application of gravity models. However, there are significant differences in the details. The differing views on what constitutes trade-relevant infrastructure are also evident in the design of the practical measurements. The country indicators considered as infrastructure variables are diverse. Some of these are aggregated in index form. The weighting of the indicators in aggregation can have a significant impact on the results. Further differences concern the choice of whether the influence of the exporting country’s infrastructure, the importing country’s infrastructure or both are included as regressors in the analysis.
In a comprehensive meta-analysis of previous research findings, Celbis et al. (2014) report that approximately 82% of the papers examined identified a significant positive effect of infrastructure on trade flows. The average effect of infrastructure on trade flows is significantly stronger when the infrastructure in question is located in the exporting country than in the importing country. Thus, an enhancement of a country’s infrastructure exerts a more pronounced positive influence on exports than on the country’s imports. It can be concluded that investments in domestic infrastructure are an effective means of improving a country’s trade balance. Furthermore, Celbis et al. (2014) demonstrate that this outcome remains consistent when methodological discrepancies between the studies and potential publication bias are taken into account. As a potential explanation, they posit that isolated infrastructure improvements in one country reduce the trade costs for all exported goods from the perspective of exporting companies in that country. Conversely, from the perspective of importing companies in the partner country, the cost reductions only affect a portion of their global import portfolio. The resulting shift in behaviour should, therefore, be more pronounced for exporters than for importers.
Furthermore, the results indicate notable discrepancies in the impact of infrastructure categories. They reveal that, on average, the volume of trade is significantly more affected by land transport infrastructure than by maritime or air transport infrastructure. This indicates that a differentiated measurement of individual infrastructure components may yield stronger effects than composite infrastructure indices. This reinforces the significance of differentiated measurement and the overarching decision regarding the definition of infrastructure in a given context. Furthermore, the results indicate that the effects are contingent upon the level of development of the countries under consideration. The infrastructure in the exporting country exerts a more pronounced effect on trade if the exporting country is a developing country. This suggests the potential for a non-linear relationship between infrastructure and trade flows. It may therefore be posited that improvements to infrastructure in countries with previously underdeveloped infrastructure could have a systematically stronger trade-creating effect. From a dynamic perspective, this effect could be reinforced by the interaction between infrastructure and economic growth. In general, this lends support to the focus and objective of Global Gateway.
Following the meta-analysis conducted by Celbis et al. (2014), a number of additional papers on this topic were published. Bensassi et al. (2015) investigate the impact of infrastructure on a region’s international exports, considering the availability and accessibility of logistics services. The authors’ assessment of infrastructure is confined to the land transport infrastructure within the exporting region. The average lengths of regional road and rail networks are used as indicators.. The findings indicate a statistically significant positive relationship between this indicator and export performance. Donaubauer et al. (2015) construct a multi-categorical index that combines data on public infrastructure stocks with private consumption accounts, including electricity consumption and the number of registered passenger cars. With regard to the four infrastructure categories (transport, ICT, energy and finance), a significant positive effect on bilateral trade volumes for aggregates of consumption goods, capital goods and intermediates was ascertained (Donaubauer et al., 2016).
Yushi and Borojo (2019) estimate the effect of infrastructure and quality of institutions on trade between African countries and with the rest of the world for the period 2000 to 2014. An aggregate indicator is employed to combine transport and communication infrastructure. Furthermore, the quality of economic institutions and the border and transport efficiency of trading partners are taken into account, with these factors also being measured as aggregated indices. The central result is that all three indicators exert a significant positive influence on trade flows. This is the case with respect to both the question of whether trade occurs and the volume of trade.
Rehman et al. (2020) examine the influence of diverse categories of infrastructure on the trade balance of South Asian countries. The authors consider indices pertaining to transportation, communication and energy infrastructure. The results demonstrate that an enhanced quality of infrastructure exerts a favourable influence on both exports and the trade balance of the countries under examination, thereby corroborating the findings of Celbis et al. (2014).
Han and Li (2022) examine the effects of transport infrastructure differentiated by international and country-internal trade based on a global sample in the period from 2000 to 2016. The results demonstrate a markedly more pronounced infrastructure impact on international trade than on domestic trade. Furthermore, the authors demonstrate that enhancements to infrastructure have a favourable impact on real income, with this effect being markedly more pronounced in the country undergoing the improvement than in its trading partners. This reinforces the interconnectivity between trade, infrastructure, and macroeconomic growth.
Overall, the empirical literature provides compelling evidence that infrastructure improvements have a significant positive impact on international trade flows. Concurrently, the preceding analyses indicate that it is crucial to differentiate with precision according to the initial conditions and impact channels. The quantitative effects of infrastructure improvements can differ significantly, depending on the type of infrastructure, the general level of development of the countries under consideration, and their trade portfolio.
This highlights the necessity for further research. Firstly, there is a need for more detailed analyses of the determinants of trade in individual product groups. In light of the discrepancies in the relative importance of transport costs among different product groups, it is not possible to assume that infrastructure improvements exert a uniform effect on trade in all goods. Secondly, further investigation is required into the interrelationships between trade flows, infrastructure development and general economic growth, with particular attention paid to the case of developing countries. Both aspects are of significant importance, particularly in the context of evaluating the Global Gateway Initiative. The strategic prioritisation undertaken by the EU in its Green Deal indicates a particular interest in the strengthening of supply chains in strategically important net-zero technologies.
The motivation for our own empirical analysis of the trade effects of Global Gateway is the limited transferability of literature results. Firstly, this concerns the almost exclusively macroeconomic focus of existing studies. They provide no indications of how the structure of EU’s trade with Global Gateway partner countries could develop, especially in the product segments of net-zero technologies which are critical for the EU’s future industrial base. Secondly, in view of the long-term nature of the investment projects, an analysis should not be limited to their direct impact on trade (decreasing trade costs) but should also highlight potential indirect trade effects through increased input demand.
When restricting the trade analysis to certain product groups, a decision on the level of detail must first be made. A common international classification of traded products is the Harmonized System (HS). It forms the basis for the work of customs authorities worldwide and is therefore highly detailed. It exhibits a hierarchical structure and distinguishes between four levels. Given the variety and the strong technological dynamics of the relevant supply chains, identifying products at the highest level of detail would involve a very high selection effort and considerable uncertainty. We therefore choose a medium level, the so-called product chapters (2-digit codes), as a basis for delimitation. It includes product aggregates with general relevance for the technologies under consideration.
Based on this demarcation, we selected four categories of goods for our analysis. Category 1 comprises base materials. By this we mean products located at the first processing stages within the supply chains, i.e., material inputs for producing the relevant end products. We define them as an aggregate of several product chapters (see next Subsection). The remaining categories are located further downstream in the supply chains. Category 2 contains mechanical machinery, category 3 contains electrical equipment and category 4 contains vehicles and vehicle parts. In their entirety, the selected categories represent the industrial parts of the supply chains of net-zero technologies very well. One exception is the very first step, trade in resources extracted directly from nature (e.g. mineral ores, fossil resources). They are excluded, as resource trade is characterised by particularly strong idiosyncratic features. For its evolution, future discoveries of resource deposits will play a critical role, whose geography cannot be reasonably predicted at present.
Another important decision concerns the selection of infrastructure variables. We understand trade-relevant infrastructure as a multidimensional construct that, in addition to transport-enabling infrastructure, also considers the development of the communication infrastructure, the political-legal institutions and the burden of administrative processes as important framework conditions for the formation of trade networks. For the practical measurement of these four dimensions, we follow the approach of Yushi and Borojo (2019). For this purpose, individual indicators are first selected from recognised secondary sources for each dimension. Then, a weighted average is calculated from these as an aggregated measure for each dimension. The weights are determined by means of a Principal Component Analysis (PCA). The aggregated measures can thus be interpreted as latent variables behind the observable indicators. In this way, a total of five infrastructure measures are included as explanatory factors in the subsequent trade analysis.
The basis for investigating the relationship between product-level trade and infrastructure is the gravity model commonly used in the empirical trade literature. It is theoretically well-founded and provides clearly interpretable estimators. We consider our infrastructure variables as a component of trade costs, in addition to the standard indicators such as spatial distance, tariff levels and historical ties. We run separate regressions for each of the four product categories considered, to illustrate any product group-specific effects of the infrastructure variables and the other explanatory factors. Geographically, our gravity analysis is not limited to the dedicated Global Gateway regions but covers trade between EU member states and all third countries. In this way, we gain a larger number of observations and, above all, more variation in the infrastructure variables as a basis for improved statistical evidence.
Afterwards, we use the results of the gravity estimations for counterfactual simulations. Specifically, we investigate the impact of infrastructure quality improvements in the Global Gateway regions on expected trade flows by applying the gravity model fitted with the coefficient estimators. In this way, we gain insight into the expected magnitude of trade creation effects and, conversely, into the extent of infrastructure improvements necessary for a significant trade boost. The result is a differentiated picture of trade impacts across product groups and infrastructure components. Figure 1 illustrates the sequence of our multi-stage approach.
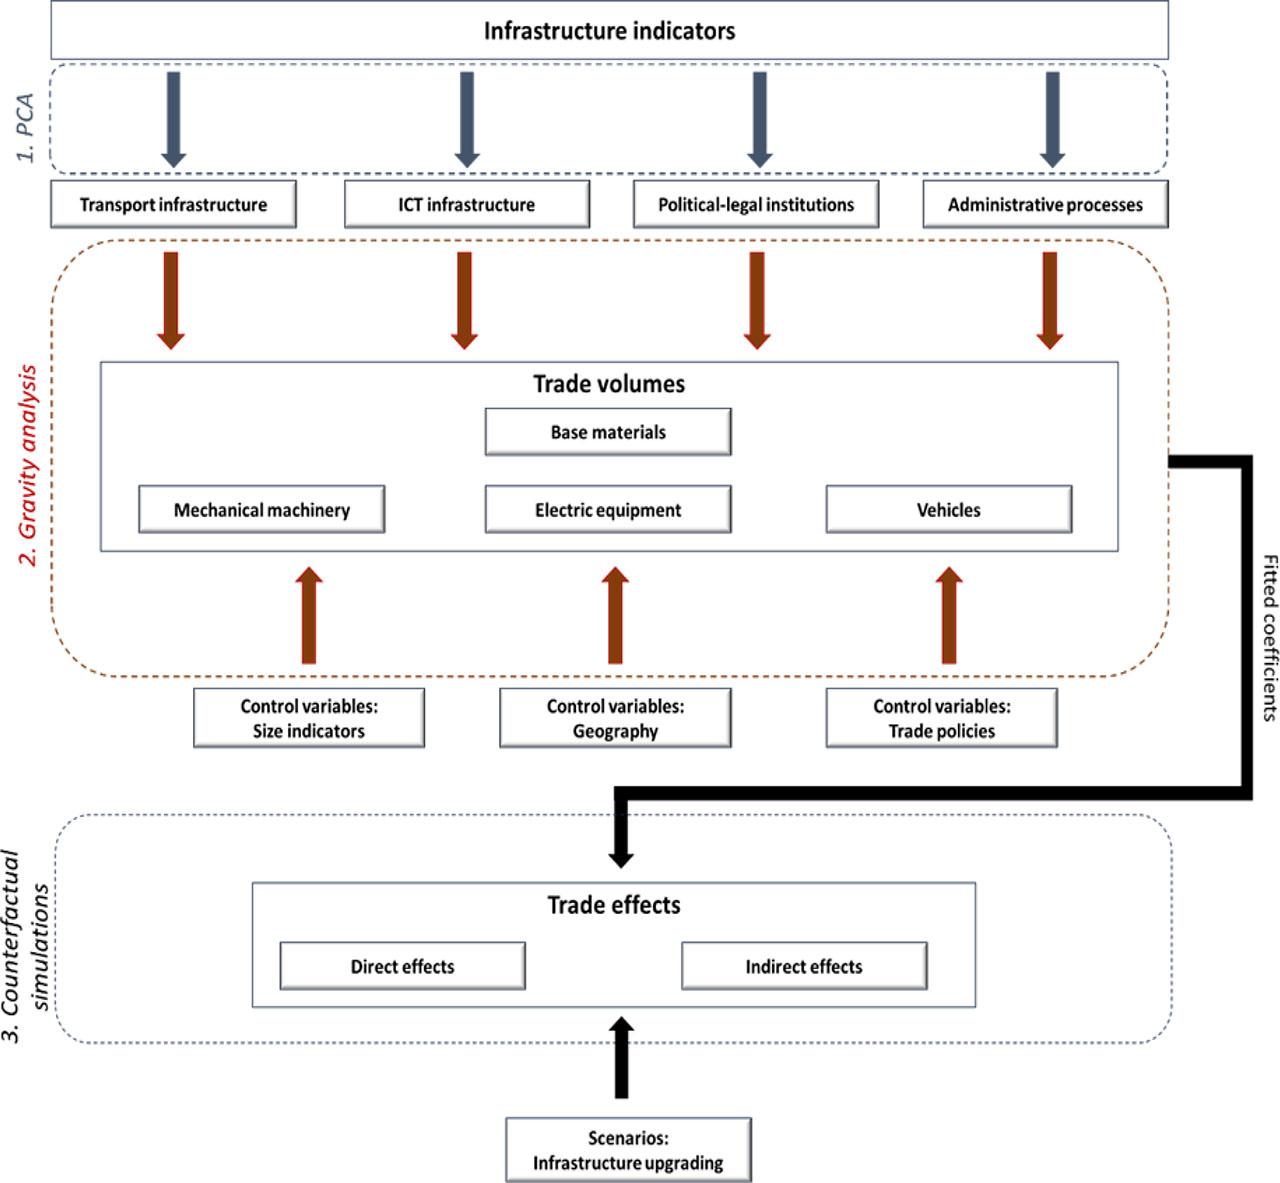
Steps of the analysis
Source: own illustration
The trade data for the analysis come from the UN Comtrade Database (UN Comtrade, 2024). It provides high-resolution information on exports and imports at product level for all global reporting countries. To construct our four product aggregates, we choose the HS codes shown in Table 2. For these product groups, all trade flows between EU members and third countries worldwide were retrieved for the last twenty observation years, based on the reporting by the member states.
List of variables and data sources
| Variable name | Description | Data source |
|---|---|---|
| Trade flow measures | ||
| tradep=base materials | Bilateral trade volumes in HS chapters inorganic chemicals (HS-Code: 28), iron and steel (72), articles of iron or steel (73), copper articles (74), nickel articles (75), aluminium articles (76), lead articles (78), zinc articles (79), tin articles (80), other base metals (81) | UN Comtrade (2024) |
| tradep=mechanical machinery | Bilateral trade volumes in HS chapter 84 | UN Comtrade (2024) |
| tradep=electric equipment | Bilateral trade volumes in HS chapter 85 | UN Comtrade (2024) |
| tradep=vehicles | Bilateral trade volumes in HS chapters 87.88. and 89 | UN Comtrade (2024) |
| Trade partner size measures | ||
| massi | Exporter supply potential: value added in medium- and high-tech manufacturing + total imports of base materials, mechanical machinery, electric equipment, vehicles | World Bank (2024a); UN Comtrade (2024) |
| massj | Importer demand potential: GDP + total imports of base materials, mechanical machinery, electric equipment, vehicles | World Bank (2024a); UN Comtrade (2024) |
| pop | Population size | World Bank (2024a) |
| area | Land area | World Bank (2024a) |
| Bilateral trade cost measures | ||
| dist | Great-circle distance (see Mayer & Zignago, 2011) | CEPII (2024) |
| bord | Existence of common border (dummy) | CEPII (2024) |
| lang | Existence of common official language (dummy) | CEPII (2024) |
| col | Existence of former colonial relation (dummy) | CEPII (2024) |
| tariff | Weighted average of (product-group) specific tariffs | UNCTAD (2024) |
| rta | Existence of joint trade agreement (dummy) | Larch (2024) |
| Infrastructure measures: transport (trans) | ||
| quality of trade-infrastructure | Perceived quality of transport- and trade related infrastructure (Pillar from Logistics Performance Index) | World Bank (2024a) |
| road quality | Perceived quality of roads (survey) | WEF (2020) |
| road network density | Relation of road length to land area | IRF (2024) |
| share of paved roads | Relation of length of paved roads to total road length | IRF (2024) |
| access to electricity | Share of population with access to electricity | World Bank (2024a) |
| Infrastructure measures: ict (ict) | ||
| broadband subscriptions | Share of population with broadband subscriptions | World Bank (2024a) |
| telephone subscriptions | Share of population with telephone subscriptions | World Bank (2024a) |
| internet users | Share of population using the internet | World Bank (2024a) |
| mobile subscriptions | Share of population with mobile subscriptions | World Bank (2024a) |
| secure internet servers | Number of secure internet servers per 1 million people | World Bank (2024a) |
| Infrastructure measures: political-legal institutions (pol) | ||
| political stability | Perceived protection against political instability and/or politically-motivated violence, including terrorism | World Bank (2024b) |
| government effectiveness | Perceptions of the quality of public services, the quality of the civil service and the degree of its independence from political pressures, the quality of policy formulation and implementation, and the credibility of the government’s commitment to such policies | World Bank (2024b) |
| regulatory quality | Perceptions of the ability of the government to formulate and implement sound policies and regulations that permit and promote private sector development | World Bank (2024b) |
| control of corruption | Perceived protection against the risk that public power is exercised for private gain, including both petty and grand forms of corruption, as well as “capture” of the state by elites and private interests | World Bank (2024b) |
| rule of law | Perceptions of the extent to which agents have confidence in and abide by the rules of society, and in particular the quality of contract enforcement, property rights, the police, and the courts, as well as the likelihood of crime and violence | World Bank (2024b) |
| Infrastructure measures: administrative burden – trade (tradeburd) | ||
| time to export: border compliance | Time associated with compliance with the economy’s customs regulations and with regulations relating to other inspections related to the export process | World Bank (2019) |
| time to export: documentary compliance | Time associated with compliance with the documentary requirements related to the export process | World Bank (2019) |
| time to import: border compliance | Time associated with compliance with the economy’s customs regulations and with regulations relating to other inspections related to the import process | World Bank (2019) |
| time to import: documentary compliance | Time associated with compliance with the documentary requirements related to the import process | World Bank (2019) |
| Infrastructure measures: administrative burden - business formation (entry) | ||
| business formation: costs | Cost of business start-up procedures | World Bank (2019) |
| business formation: procedures | Start-up procedures to register a business | World Bank (2019) |
| business formation: time | Time required to start a business | World Bank (2019) |
Source: own representation
A critical step marks the choice of infrastructure indicators. We explored a wide range of international databases in search of suitable indicators, including the World Bank Development Indicators (World Bank, 2024a), the Worldwide Governance Indicators (World Bank, 2024b), the Doing Business Index (World Bank, 2019), the Global Competitiveness Index by the World Economic Forum (WEF, 2020) and the statistics of the International Road Federation (IRF, 2023). The search revealed a clear trade-off between the level of detail and the extent of temporal and spatial availability of data. This was further complicated by the fact that a significant proportion of the Global Gateway target countries are developing countries. When selecting indicators for each of the four infrastructure dimensions included in our analysis (transportation, ICT, political-legal institutions, administrative processes), our aim was to ensure the broadest sample of countries and the most up-to-date observations possible. Consequently, indicators which cover infrastructure quality in more general terms were preferred over indicators that reflect more specifically the focus of current Global Gateway projects but are highly patchy or not available for recent years.
Our analysis should therefore not be regarded as an evaluation of specific flagship projects, but as an impact analysis of potential general improvements in infrastructure quality caused by the Global Gateway project portfolio. Specifically, only indicators were selected which were available for more than 100 countries and for at least three consecutive years since 2015. Table 2 lists the indicators selected on this basis. Results of the PCAs undertaken to determine the weights of the single indicators are reported in Table A1 in the Appendix. In all cases, the first extracted components account for a share of more than 75 % of the total variation. We apply these as index measures.
We use national accounts data available from the Word Bank to measure the economic mass of the trading partners. Traditionally, economic mass is approximated by GDP in gravity analyses. For our analysis at product group level, however, this would not constitute a suitable measure for supply-side trade potential, as it does not contain any information on economic structure and specialization. Moreover, Baldwin and Taglioni (2014) have shown that the approximation by value added measures alone is a source of bias, as the trade flows as dependent variables are not measured in value added but in product values.
Following Baldwin and Taglioni (2014), we therefore construct our economic mass measures based on multiple components. We measure the supply-side potential of the exporting country as the sum of its value added in medium- and high-tech manufacturing and its global imports in the four product categories that we consider. This serves as a proxy for the (not directly observable) production value of the relevant future technologies in the exporting country. The demand-side potential of the importing country is measured as the sum of GDP and global imports of the four product categories considered (excluding the bilateral imports from the respective trading partners, to avoid the creation of an endogeneity issue). Population size and land area are taken into account as further non-economic mass measures, e.g. to control for potential productivity effects.
Standard gravity model variables are included in our regression model as additional control variables. The spatial distance between the trading partners, measured via the CEPII’s great circle approach (Mayer & Zignago, 2011), and a dummy variable to capture common borders are included as measures of natural trade costs. To map political trade barriers, we record bilateral tariff rates at product group level, taken from the global tariff database of UNCTAD Trains accessible through the World Integrated Trade Solutions (WITS) (UNCTAD, 2024). We also account for the existence of regional trade agreements as a dummy variable, taken from Mario Larch’s Regional Trade Agreements Database (Larch, 2024). We thus ensure that the measured influence of infrastructure quality does not erroneously reflect the effects of growing trade cooperation. As potential cultural factors, the existence of a common language and of past colonial ties are included in the model as dummies, both taken from the GeoDist dataset of the CEPII (CEPII, 2024). The resulting data set contains a total of 25,626 observations and covers the period from 2015 to 2019.
Based on the theoretical framework of the gravity model, the functional relationship of all metric variables in the model is log-linear. Hence, all estimated coefficients exhibit the form of dimensionless elasticities, facilitating their interpretation and comparison.
In principle, such a model can be estimated by standard linear estimation methods. However, the zero values represent a potentially distorting feature. Not all countries traded with each other in all products in every year. Simply eliminating existing zero values would negate their non-random nature, and thus also a potential influence of infrastructure on the existence of trade relationships between countries (Portugal-Perez & Wilson, 2012). There are several ways to account for this issue in the estimation. Following previous studies, we choose the classical Heckman approach (Heckman, 1979). For the practical estimation, we need to specify a variable that is only included as an explanatory variable in the first stage, the selection equation (exclusion restriction). Following Yushi and Borojo (2019), we choose the administrative burden of business formation (entryit) as a selection variable. It serves as a proxy for entry costs and thus as a determinant of trade-creating business activities.
Moreover, for an unbiased estimate, it must be considered that the extent of trade between two countries potentially not only depends on bilateral trade costs, but also on the alternative costs of trading with other countries. Anderson and van Wincoop (2003) have shown that this can be achieved by introducing so-called multilateral resistance terms as a correction to the measures of bilateral trade costs. In constructing the measures, we follow the model of Portugal-Perez et al. (2012). Furthermore, we add year dummies (yeart) as explanatory factors to control for the influence of time trends and year-specific fluctuations on trade. The resulting relationship is estimated separately for each of the four product groups under consideration. Equations (1) and (2) show the specified selection and outcome models, respectively, with i indicating the exporter, j the importer, t the year, p the product group (base materials, mechanical machinery, electric equipment, vehicles) and mr the inverse mills ratio.
Before turning to the regression results, it is important to gain general insights into the patterns of trade flows and relevant infrastructure variables. Given our interest in the implications of the Global Gateway Initiative, we focus on third countries targeted as destinations by Global Gateway flagship projects. To this end, we went through the current versions (from December 2023) of the official EU flagship project documents (European Commission, 2023a) and identified all those countries as “Global Gateway countries” for which project plans related to infrastructure capacities are announced. This led us to a selection of 69 countries worldwide (see list in Table A2 in the Appendix). To indicate the current economic relevance of this set of countries from EU perspective, we analyse their roles in past global trade of EU members.
Figure 2 presents the contributions of Global Gateway countries to EU imports from third countries for our four product groups of interest. First of all, it has to be noted that despite the impressive number of countries, their aggregate shares in EU imports lied well below 20 % for all product groups and time periods considered. This is an implication of the development-oriented strategy of Global Gateway. With the exception of Japan, investments are not targeted at high income economies. Important traditional EU trade partners like the US are thus not included in these figures. Of course, given the role of Global Gateway as a counterinitiative to “Belt and Road”, China is not included as an investment destination either.
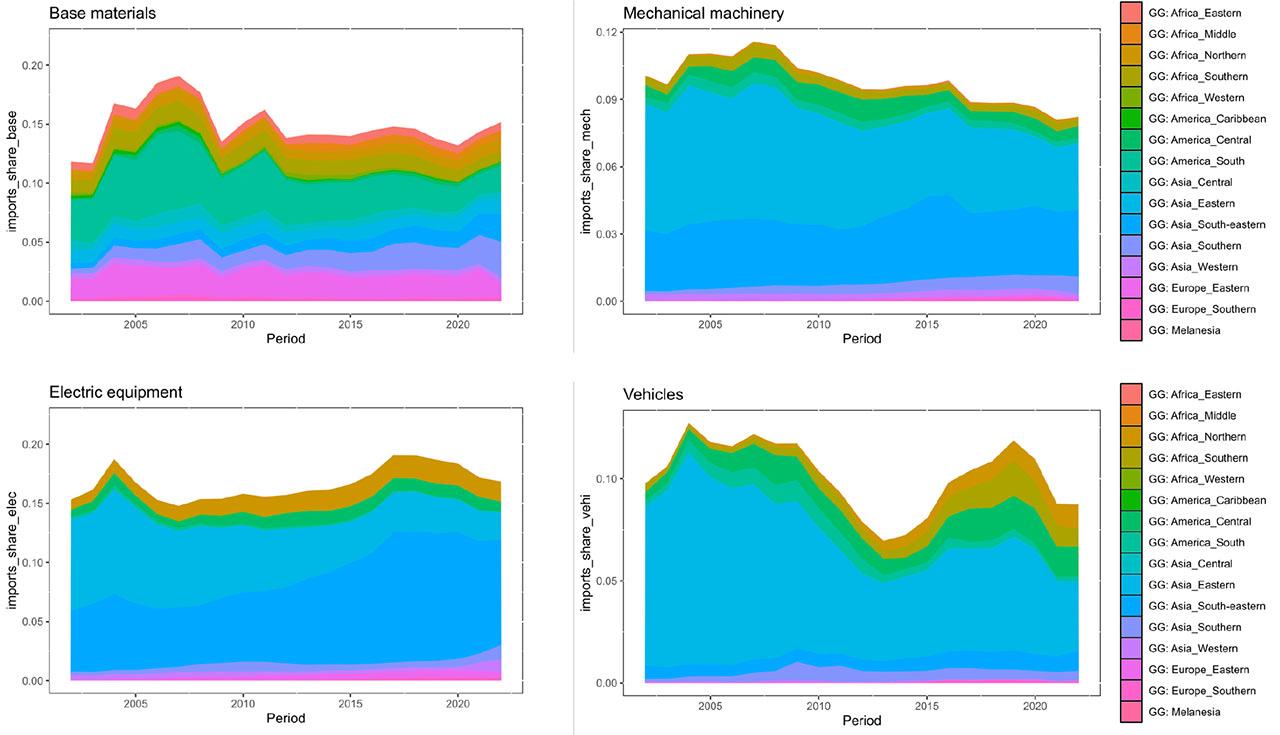
Shares of Global Gateway countries in EU imports by world region
Source: UN Comtrade (2024); own calculations.
At the same time, the images reveal interesting product discrepancies and time trends. Over the last ten years, Global Gateway countries exhibited the biggest relevance as exporters in the segments of base materials and electric equipment. However, while market shares in base materials stagnated, market shares in electric equipment showed a positive trend for some years. Hence, for this segment, some overall signs for a gradual shift towards downstream products can be noticed. The division of Global Gateway countries into world regions reveals that this trend is highly region-specific. It is almost exclusively caused by a strong increase in market shares of countries from Southeastern Asia. The remaining two downstream segments each show idiosyncratic patterns. The overall trend of market shares in EU imports of mechanical equipment has been negative in recent years, largely due to a contraction of imports from Eastern Asia. Finally, shares in vehicle imports exhibit a volatile pattern, with imports from Southern Africa, Central America (including Mexico) and Eastern Asia as main driving forces.
Overall, these patterns confirm the need for a product-differentiated analysis of EU trade with Global Gateway countries. The fact that trends in regional exports differ by product group hints at product differences in the influence of the underlying explanatory factors, potentially including the role of infrastructure.
Concerning infrastructure quality, starting conditions also strongly differ between regions. Figure 3 depicts regional averages for four of our infrastructure indices (see Subsection 4.2) for Global Gateway countries, calculated for the year 2019 and (for comparability) centred around the global average of third countries. Accordingly, for the transport, ICT and political-legal indicator, a value larger (smaller) than one indicates that the regional performance was better (worse) than the global third country average. For the burden of trade administration indicator, being an inverse quality measure, the opposite holds. In general, pronounced discrepancies are noted both across continents and infrastructure dimensions. For instance, while only a few regions surpassed the global average regarding the quality of institutions, most regions exhibited an above-average performance in the segment of ICT infrastructure. Global Gateway countries from Eastern and Southeastern Asia were among the best performers in all infrastructure dimensions except for the burden of trade administration indicator. This is also the indicator with the most significant regional discrepancies, featuring Global Gateway countries from Middle Africa as negative and countries from Southern Europe as positive outliers.
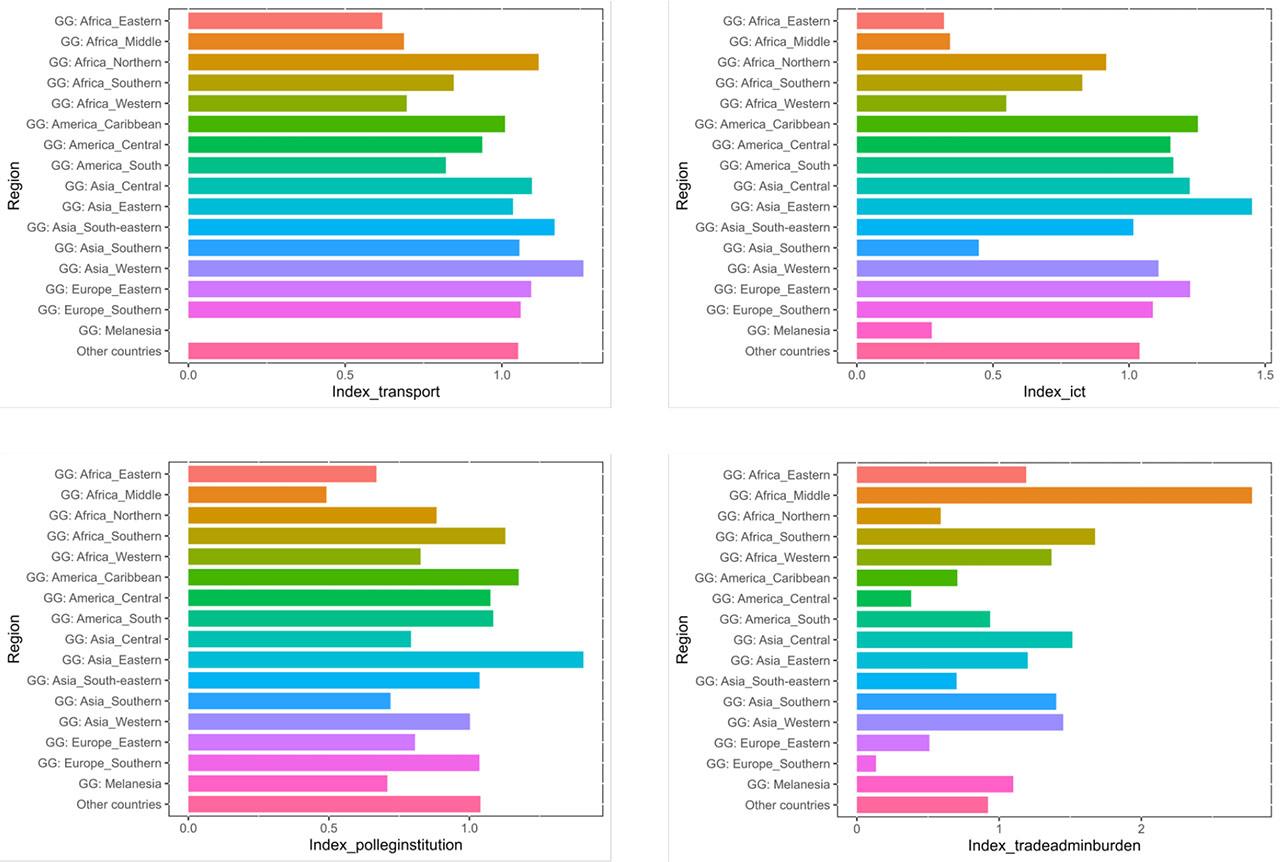
Averages of infrastructure indices for Global Gateway countries by world region
Sources: World Bank (2019;2024a,b); IRF (2023); WEF (2020); own calculations. Transport index: No values for Melanesia.
Complete results of the gravity estimations are presented in Table A3 in the Appendix. In general, signs of the estimated coefficients match theoretical expectations. Our economic mass measures show consistently positive effects in all regressions, in line with typical gravity outcomes. Increased spatial distance is diagnosed to affect bilateral trade in all considered product groups negatively, as predicted by economic theory. The existence of common trade agreements is shown to consistently strengthen bilateral trade. The measured impacts of other indicators of bilateral trade costs are more nuanced. Higher tariff rates are estimated to reduce trade volumes in all product groups except for mechanical equipment. The significance of having a common language, a common border or a common colonial past differs substantially between product groups. This nourishes the idea that the geographical shape of supply chains is affected by a complex interplay of cultural factors and technological requirements.
Concerning our main variables of interest, the infrastructure measures, the distinction between product groups is likewise insightful. While the signs of the respective coefficients are all as expected, the size of the estimated effects differs considerably. The strongest positive impact of transport infrastructure is expected for base materials. For mechanical machinery and electric equipment, the measured impact is smaller but still highly significant, while it is insignificant for vehicles. Intuitively, this discrepancy might reflect differences in the relative importance of transport costs for location decisions between product groups. As base materials tend to exhibit a lower degree of product differentiation and embodied knowledge than the other categories considered, cost competition is particularly strong. Hence, the cost-reducing effect of utilising a well-developed transport infrastructure is particularly influential on location decisions. This is further supported by the fact that coefficients for spatial distance and tariff rates are also most pronounced in the case of base materials, suggesting a generally high importance of trade costs. The insignificance of this term in the case of vehicles might be explicable by the dominance of network-related effects over spatial costs, like maintaining a trade network of trusted and highly specialized producers of vehicle parts and components.
By contrast, the state of development of the ICT infrastructure is shown to be highly significant for trade in all product groups. Again, the size of the effect is the highest in the case of base materials. In this respect, vehicles come second. This is also the only group where the ICT infrastructure effect exceeds the transport infrastructure effect. The results in general stress the fact that local ICT is an important and autonomous factor to be considered in global supply chain development. This can be viewed as confirmation of the EU approach to consider ICT investments a separate and important pillar of the Global Gateway strategy.
The quality of political-legal institutions is likewise revealed to be an unanimously important driver of trade. In this respect, the effect size is least pronounced for base materials. Again, this might hint at a stronger dominance of plain cost advantages over “softer” infrastructure factors in the case of upstream materials. Finally, the administrative burden of trade procedures is shown to consistently exert a restraining influence on the volume of trade flows.
Finally, we need to address the potential issue of reverse causality. In the literature, this is frequently discussed as a scenario where eliminating trade barriers induces countries to invest more heavily in their trade-related infrastructure, to be prepared for an expected surge of trade flows (Portugal-Perez & Wilson, 2012). Such an effect would imply that our estimated coefficients for the infrastructure variables are suffering from a simultaneity bias. While the possibility of its existence cannot be swept aside, there are at least reasons to believe that the setup chosen limits its extent. First, we account for both tariff rates and the existence of trade agreements as indicators of trade openness. Second, intra–EU trade is not part of our sample. As investment incentives following a trade increase are likely to be most pronounced for highly integrated partners, this should also exert a moderating effect on a simultaneity bias (Donaubauer et al., 2015). Third, we performed estimations of alternative model variants including time lags (first and second) of our infrastructure measures. Its results are presented in Table A4 in the Appendix. Significance and general magnitude of the coefficient estimates are unaffected. This time persistency of estimates supports our belief that any reverse influence is only a minor source of distortion.
The previous estimation results can be used to analyse the expected isolated effects of infrastructure improvements on trade flows. Specifically, we are interested in how enhanced infrastructure quality in Global Gateway countries is predicted to affect imports by EU member states. This effect will not be homogeneous across member states, due to different infrastructure investment intensities and country differences in the portfolios of trading partners. For our simulations, we focus on the intensive margin. This means we consider volume changes in existing trade relations instead of predicting the emergence of new ones.
Concerning the initial infrastructure impulse, we restrict our analysis to improvements in transport and ICT infrastructure quality, as these are the two dimensions within our concept that can be directly targeted by the Global Gateway investments. We distinguish between two scenarios for infrastructure improvement. As a benchmark for both cases, we consider average transport and ICT infrastructure quality in the BRICS countries, reflecting the state of infrastructure development in growing emerging economies. As the set of Global Gateway countries includes many developing economies, average infrastructure quality index measures for Global Gateway countries lie clearly below the BRICS benchmarks.
In our scenarios, we examine what would happen to trade if Global Gateway investments managed to raise average transport and ICT infrastructure quality in Global Gateway countries to the BRICS levels. In reality, such an endeavour would take the form of a gradual long-term transition, with potentially delayed trade effects. In our comparative-static simulations, it is simplified to a one-time shift, under the premise of unchanged framework conditions (see below). Due to the heterogeneity of trade patterns across countries, the effect of this average shift is highly sensitive to the specific distribution of quality improvements among countries. In this respect, our two scenarios reflect opposing approaches. In the scenario “general strengthening”, we consider a situation where the increase in average infrastructure quality is achieved by a homogeneous percentage increase for all Global Gateway countries (including those above the previous average). By contrast, in the scenario “development focus”, the same average increase is achieved by raising infrastructure quality only in Global Gateway countries below the previous Global Gateway median, but to a larger extent than in the other scenario. For all below-median countries, we apply the same relative upward shift in this scenario. The two scenarios thus reflect different strategic priorities (focusing on overall improvement vs. specifically supporting the least developed).
For each product group, the direct effects on the volumes of bilateral trade flows are obtained by applying the estimated infrastructure elasticities to the scenario-specific changes in infrastructure quality. Moreover, through the influence of the economic mass variables on trade, there are also indirect supply chain effects covered. As the economic mass of exporters in our model is defined as the sum of value added and imports of all product groups by the exporting country, direct effects on trade strengthen the overall export potential. Moreover, they also raise the economic mass of the importers, causing a general rise of demand potential. This, in turn, causes additional positive trade effects across all product groups, governed by the elasticities of trade to the economic mass of exporters and importers. This can be viewed as reflecting supply chain relationships: infrastructure improvements in country A enhance the supply of products to country B. This, in turn, boosts production in country B, causing additional import demand for upstream products and thus increased trade with all its partner countries. Equations (3) and (4) summarise our calculation of direct and indirect trade effects.
Figure 4 presents detailed results on percent changes in EU imports from third countries caused by the scenario “general strengthening”, based on reference trade data from 2022 and distinguished by member state and product group. It documents strong structural variety in effect sizes, both regarding direct and indirect effects. On average, the strongest effects are witnessed for electric equipment. This is largely due to the particularly intense trade relationships of the EU with Global Gateway countries from Eastern Asian (Japan) and Southeastern Asia (Malaysia, Vietnam) in this segment. Nevertheless, effects are highly country specific, with Ireland representing a clear outlier. The category with the second largest average effect is base materials. Its distribution shows a quite different geographical pattern. The largest relative import gains are expected for the Mediterranean countries Greece, Spain and Italy. This is partly a consequence of strong trade ties to Northern African Global Gateway countries in this segment. Vehicles is the category with the smallest average effect, resulting from small direct impacts. This is partly related to the overall limited role of Global Gateway countries as EU partners in vehicle trade (see Subsection 5.1), but mostly due to the absence of a significant trade effect of transport infrastructure for this segment.
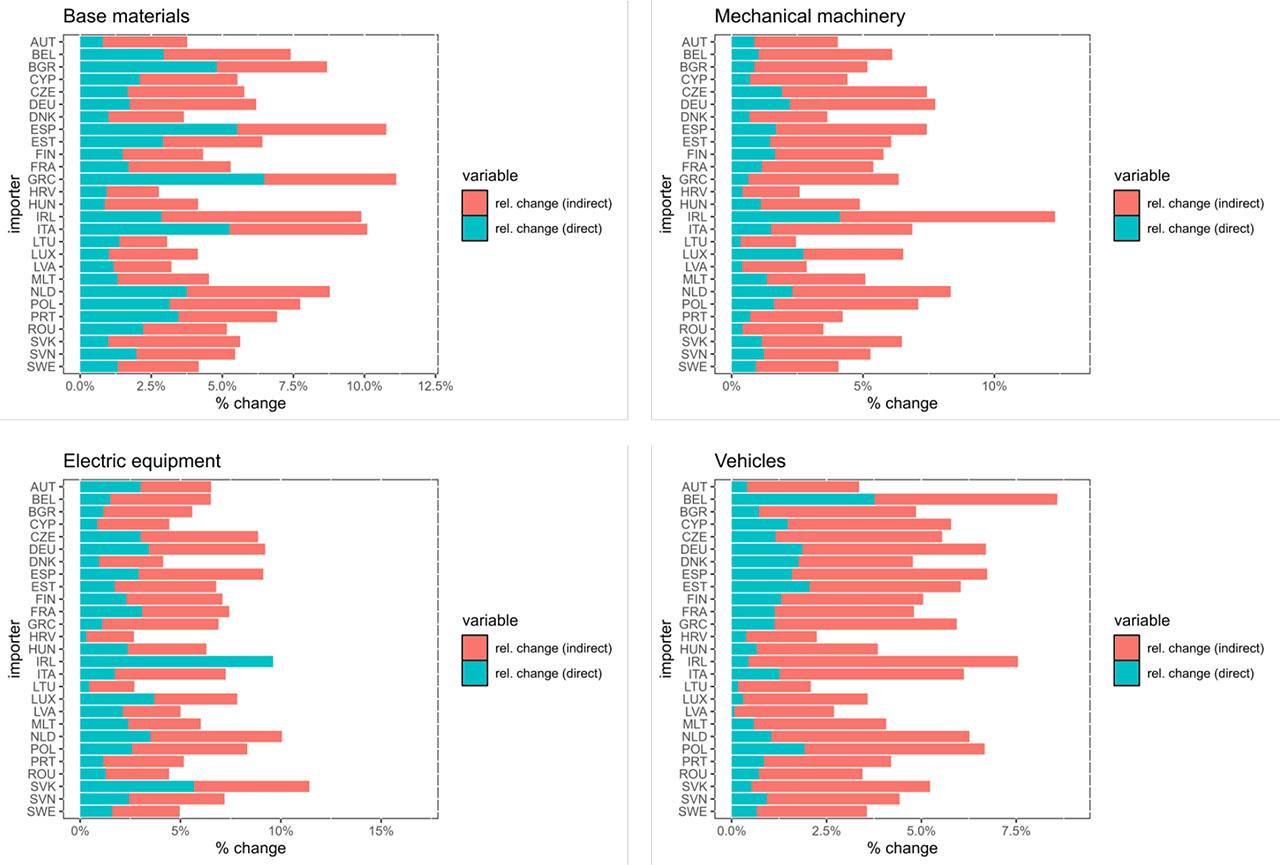
Effects of Global Gateway scenarios on EU imports – Scenario: general strengthening
Source: own calculations
The results of the alternative scenario “development focus” are depicted in Figure 5. In all categories but base materials, average effects are of a clearly more modest scale compared to the scenario “general strengthening”. This is a consequence of the quality lead of the EU’s most important suppliers over the remaining Global Gateway countries. As many of them stand out with a comparatively well-developed transport and ICT infrastructure, they do not benefit from further quality improvements in this scenario. Instead, relative trade gains are focused on economically small developing countries with (at least in the short-run) limited capacities to contribute to the EU’s supply security. These are most limited in the case of vehicles. With base materials, this is different, reflecting the typical industrial specialisation of these countries on upstream products. Increased trade in base materials, in turn, initiates indirect trade effects for the other product groups.
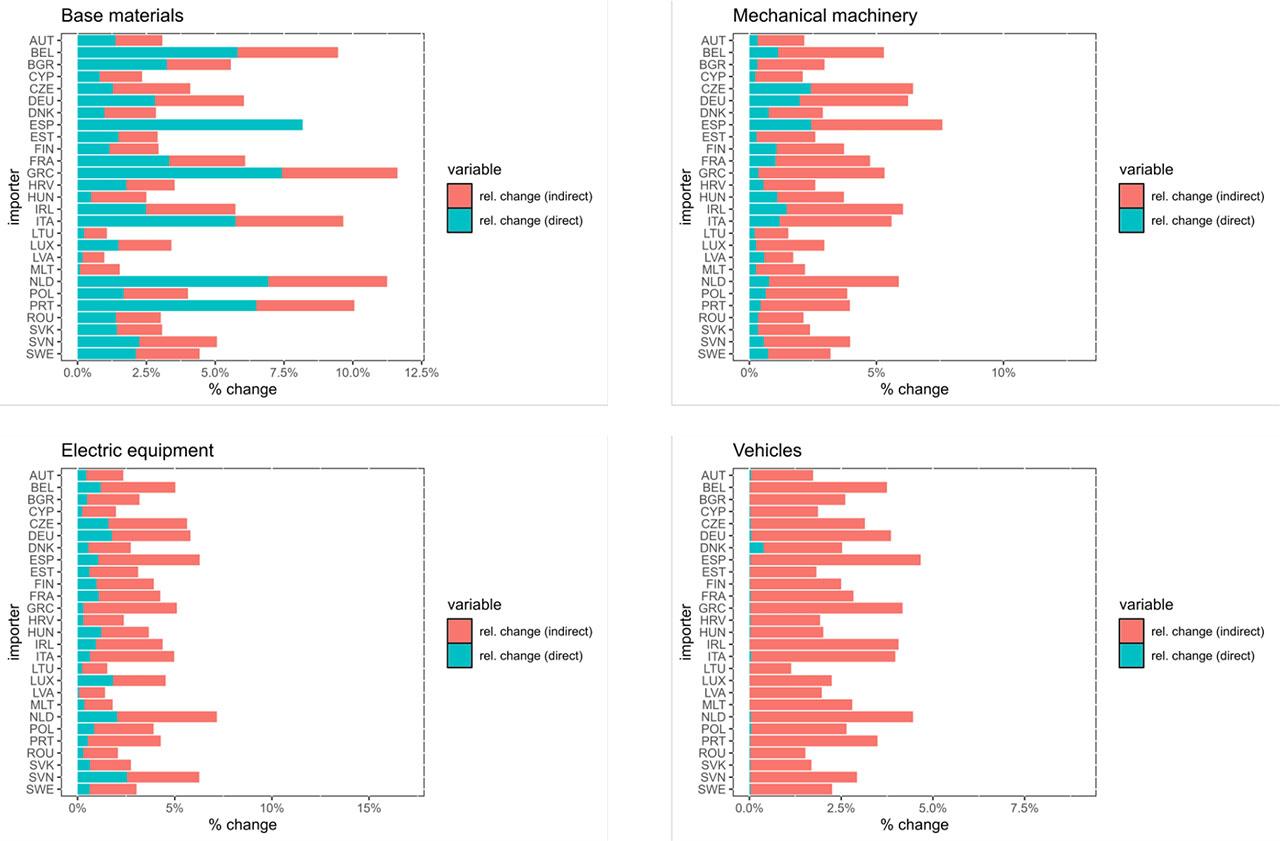
Effects of Global Gateway scenarios on EU imports – Scenario: development focus
Source: own calculations
Moreover, the geographical distribution of effects also differs strikingly between the scenarios. Interestingly, imports of member states with former colonial ties to Global Gateway countries like France, the Netherlands, Portugal, and Spain appear on average to be less sensitive to the scenario specification. This is potentially reflecting the fact that past trade relationships were less related to infrastructure quality in these cases.
From a resilience perspective, total volumes of EU trade with Global Gateway countries are not the only relevant indicator. To assess the implications of a scenario for EU supply security, its impact on the geographical diversification of trading partners also needs to be considered. Establishing a more diversified portfolio of third country suppliers can help to hedge against country risks and to reduce exposure to external supply shocks transmitted through trade networks. A standard inverse measure of diversification is the Herfindahl–Hirschman index (HHI) of concentration (Rhoades, 1993). We apply it to the distribution of exporting country shares in EU third country imports. Figure 6 depicts the results by product group and scenario. As to be expected, the highest supply concentration is determined for electric equipment, reflecting Europe’s strong dependence in semiconductors and batteries on Eastern Asia. The comparatively small supply concentration in base materials is due to the heterogeneity of products involved. Both Global Gateway scenarios are predicted to lower supply concentration throughout all product groups. In this respect, the impact of the “development focus” scenario is slightly higher. This is due to the stronger stimulation of trade with previously minor trade partners. Nevertheless, overall effects are in each case of a modest magnitude.
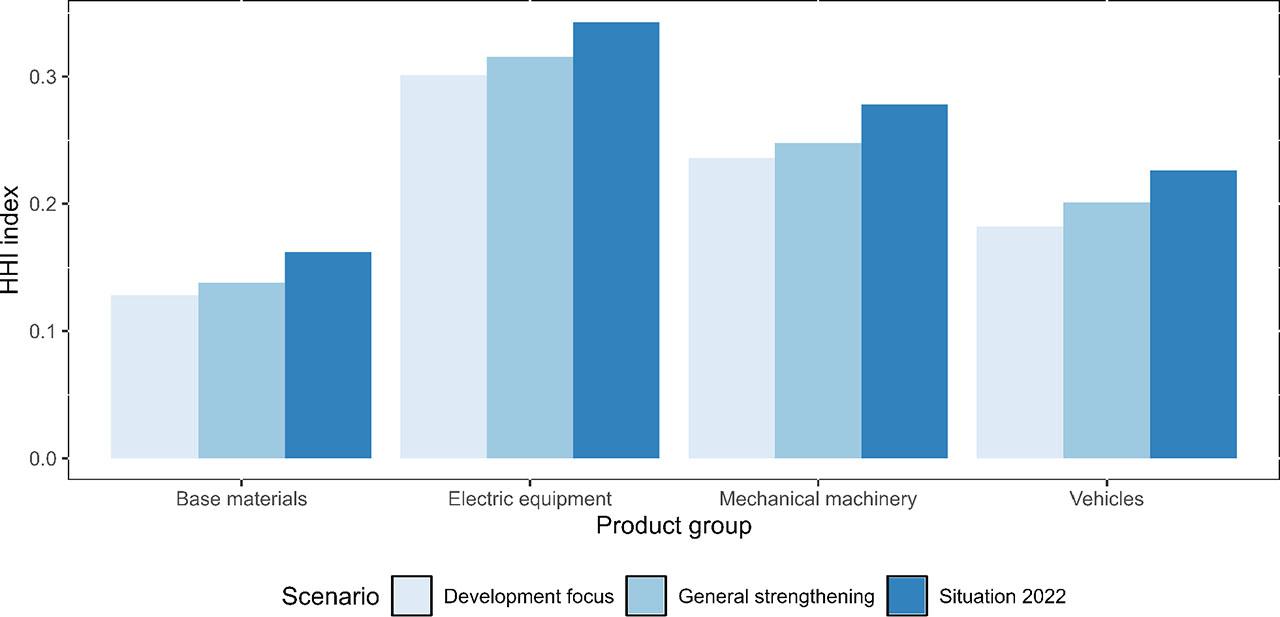
Spatial concentration of external EU suppliers
Source: own calculations.
Finally, as an illustrative example for a resilience perspective, we can use our framework for simulating the short-term trade effects of unexpected supply disruptions. Given its geopolitical relevance, we are specifically interested in a “China shock”. For all the product groups considered, the UN Comtrade data reveals that China has been the single most important supplier of the EU in 2022. In the following, we analyse the implications of an exogenous drop in worldwide Chinese exports of the products concerned, e.g., as an outcome of sudden export restrictions. In doing so, we compare overall trade effects across our previous scenarios, again distinguishing between direct and indirect effects.
Table 3 shows the consequences of a homogeneous drop in product exports by 50 %, represented in the form of percentage changes of total EU imports. The strongest overall impact is observed for electric equipment. This is reflecting Europe’s particularly large dependence on China in this product group. It also exhibits the biggest indirect effects, due to a likewise large China dependence of the EU’s other trading partners. In scenario comparison, the results of the Global Gateway scenarios differ only very slightly from the values determined for the actual situation in 2022. This confirms the assessment that the trade effects of the considered infrastructure upgrade will only slightly reduce Europe’s direct dependence on its most important trading partners. Interestingly, concerning the direct effects, the “development focus” scenario consistently shows slightly lower losses than the benchmark, while they are the highest for the “general strengthening” scenario. This is reflecting the stronger import diversification effect of the “development focus” scenario (see above). At the same time, indirect effects are in both Global Gateway scenarios even stronger than in the benchmark scenario. This is explicable by the fact that the trade impulses of the infrastructure improvements have raised the demand in third countries for Chinese products.
Simulated impact of a 50 % drop in Chinese exports on EU imports
| Scenario | ||||||
|---|---|---|---|---|---|---|
| Situation 2022 | General strengthening | Development focus | ||||
| Product group | Direct effects | Indirect effects | Direct effects | Indirect effects | Direct effects | Indirect effects |
| Base materials | −2.82 % | −3.59 % | −2.83 % | −4.15 % | −2.80 % | −4.09 % |
| Electric equipment | −15.46 % | −5.92 % | −15.56 % | −6.59 % | −15.38 % | −6.29 % |
| Mechanical machinery | −9.36 % | −4.63 % | −9.41 % | −5.17 % | −9.31 % | −5.01 % |
| Vehicles | −3.04 % | −3.22 % | −3.06 % | −3.64 % | −3.04 % | −3.46 % |
Source: own calculations
At first glance, the results are sobering. Our analysis confirms the idea that infrastructure improvements in Global Gateway countries can raise their bilateral trade with the EU in the product groups. However, the extent of trade effects is far too limited to enhance Europe’s resilience to future supply chain disruptions, in this case, to shocks originating from China. This is not due to a lack of ambition in the infrastructure scenarios considered. Given the large number of developing economies among the Global Gateway countries, raising the average infrastructure quality to the level of emerging economies would represent a significant achievement.
Instead, the impact is dampened by two factors. The first factor is the relatively low initial level of trade between the EU and the Global Gateway countries. Overall, they accounted for less than 20 % of EU imports as countries of origin in all product groups in recent years (see subsection 5.1). The second factor is the strong trade links between the Global Gateway countries and China. In contrast to a reduction in bilateral trade costs, e.g. through tariff reductions, infrastructure improvements tend to have a cost-reducing effect on trade with all partners. This means that no systematic trade diversion effects are to be expected. EU investments in the infrastructure of Global Gateway countries therefore run the risk of supporting progress in their trade integration with other third countries, in particular with China. The fact that many Global Gateway countries already have strong trade links with China reinforces this effect. As a result, Europe’s indirect supply chain dependence on China may even increase, as our results suggest.
At the same time, it must be emphasised that our simulations are only an analysis of isolated effects. The overall effects could be larger if infrastructure investment also strengthens other important factors affecting trade. The first important channel is macroeconomic productivity effects. It is an explicit goal of the EU not only to improve infrastructure as part of the Global Gateway Initiative, but also to support countries on their way to stable and sustainable economic growth in the long run. If successful, this will also have additional positive effects on bilateral trade with the EU in the long run, as shown by the importance of the macroeconomic variables in our estimates.
For the developing countries among the Global Gateway countries, it is particularly important that infrastructure investment promotes structural change. The aim must be to improve their prospects of participating in knowledge- and value-intensive parts of global supply chains, also to avoid the risk of creating new resource traps. One way to do this is to focus on specific infrastructure bottlenecks that are essential for strategic net-zero technologies, such as pipelines for gaseous renewables and electricity transmission capacity. Another strategy is to focus on infrastructure components that are generally suitable for promoting long-term value chain upgrading, i.e., extending participation in international supply chains to more value-intensive products and production steps (Gereffi, 2019). For example, recent studies show that investment in improving ICT infrastructure, in particular the expansion of broadband internet connections, can become a driver of economic modernisation. In any case, investment programmes need to be tailored to the specific starting conditions in recipient countries and require a high degree of coordination with and involvement of local stakeholders to ensure that they are firmly embedded in local development agendas.
The second important channel is trade policy. In particular, the reduction of tariffs and non-tariff barriers strengthens trade between Global Gateway countries and the EU. In contrast to pure infrastructure development, this can also help to reduce China’s influence through trade diversion effects. In our gravity estimates, the impact of the tariff rate variable is mostly significant. However, the dummy indicating the existence of bilateral trade agreements is also consistently highly significant. This suggests that the reduction of non-tariff barriers, such as quotas and discriminatory product standards, also plays an important trade-creating role in the context of such agreements.
The EU has long pursued a policy of asymmetric trade integration with developing countries through the instrument of Economic Partnership Agreements (EPAs). EPAs allow the EU and individual ACP countries to negotiate development-oriented trade agreements. These include a reciprocal but asymmetrical reduction of trade barriers over time, as well as increased development cooperation (“aid for trade”) to facilitate market opening. One of the EU’s priorities should be to broaden, deepen and consolidate such agreements in order to support private sector cooperation through Global Gateway projects. The focus should be on the prospects for upgrading partner countries’ value chains, for example, by sharing knowledge through increased R&D cooperation and working together to develop technical standards.
The third channel is increased cooperation in the development of institutions, i.e., the intangible forms of infrastructure. Our gravity estimates yield a consistently significant influence of both political-legal institutions and the effectiveness of customs authorities on the volume of trade.
In terms of scale and scope, the Global Gateway Initiative is the EU’s most ambitious external infrastructure cooperation effort to date. To be successful, it should not only serve to strengthen diplomatic relations with partner countries, but also contribute to the spatial diversification of EU supply chains, especially those related to strategically important net-zero technologies.
In this respect, our product-specific analysis of trade determinants dampens short-term expectations. For the infrastructure components analysed (transport, ICT, political-legal institutions, administrative efficiency), a significant positive effect of infrastructure quality on the export performance of trading partners was found almost across the board. However, even assuming ambitious infrastructure upgrading, the isolated trade effects are too small to significantly increase the geographical diversification of EU imports. Moreover, a general reduction in trade costs in partner countries is also likely to increase their trade with China, which could even increase the EU’s indirect dependence in global supply chains. To reduce Europe’s vulnerability to external supply shocks in critical industrial products such as semiconductors and batteries, efforts by the initiative should therefore not be limited to reducing trade costs for existing supply routes.
Instead, Global Gateway must become an engine for sustainable economic growth in partner countries. Focusing on infrastructure that is essential for the green transformation (e.g., pipelines for renewable gases, electricity grids) or for the structural modernisation of the economy (in particular ICT networks) is a suitable strategy. This serves not only to strengthen the general export potential of the partner countries, but also their economic links with the EU through participation in common specialised supply chains. Such an infrastructure strategy should be accompanied by increased cooperation at other levels. This concerns in particular the reduction of regulatory (tariff and non-tariff) barriers to trade and cooperation in strengthening local institutions.
In general, partnerships need to be built on a level playing field, given the conflicting development models of geopolitical rivals such as China. In the evolving multipolar world, the EU can only become an attractive partner for low and middle-income countries if supply chain integration is compatible with their macroeconomic development objectives. Infrastructure projects and accompanying trade facilitation measures must be guided by the objective of medium-term value chain upgrading. On the European side, a willingness to continuously share technological and regulatory knowledge with partner countries, e.g., through joint work on technical standards and local sourcing of production inputs, is a necessary condition.