

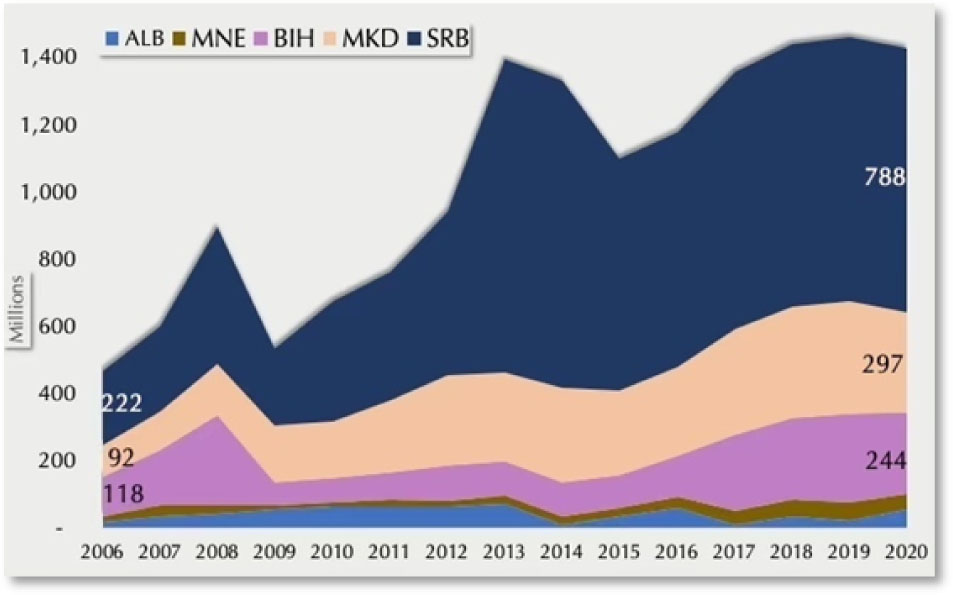
Figure 1.
Polish Exports to WB region: Evolution over the years, by destination
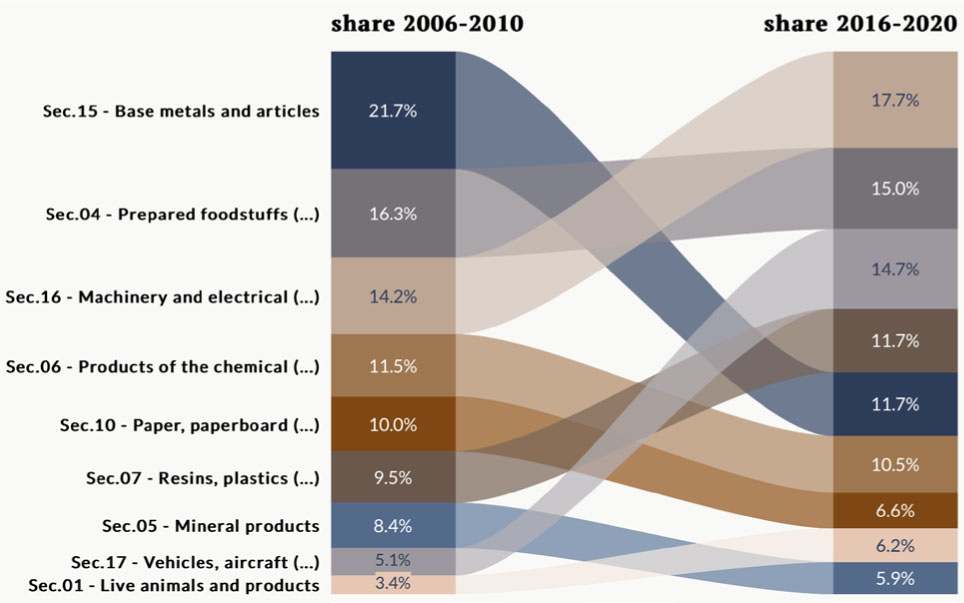
Figure 2.
Polish Exports to WB region, by Section, Changes over time (2006–2010 vs. 2016–2020)
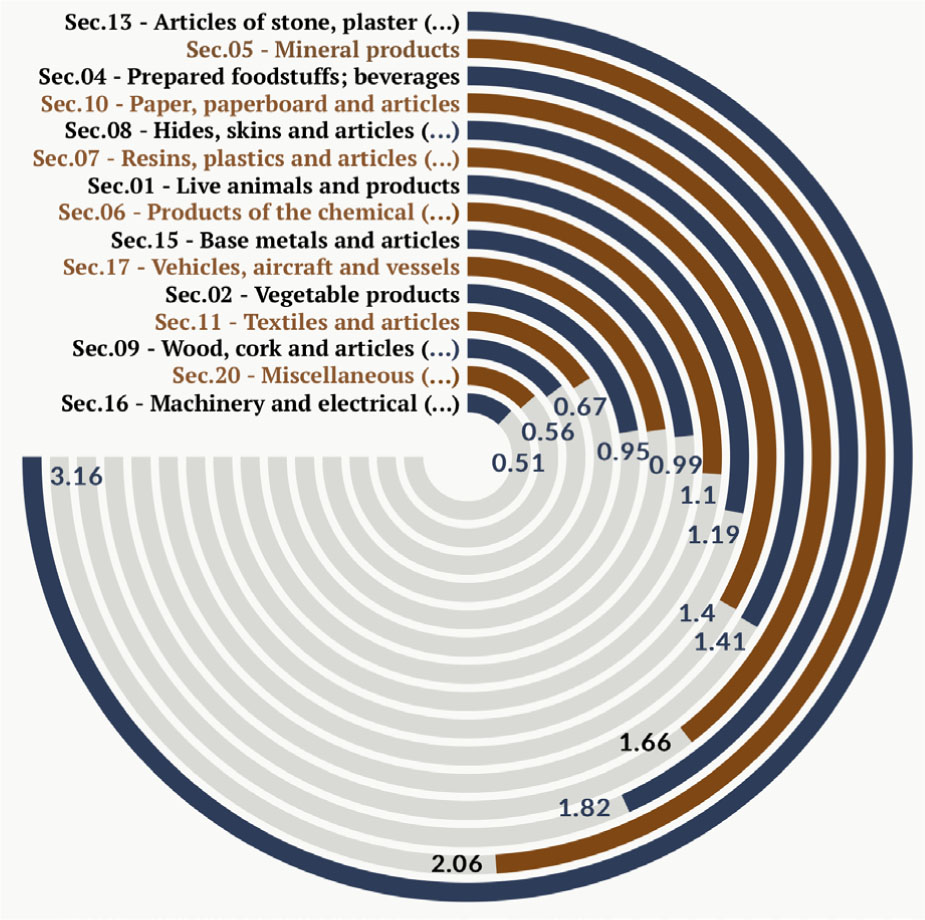
Figure 3.
Poland’s RCA 2016–2020 (Exports to WB Region)
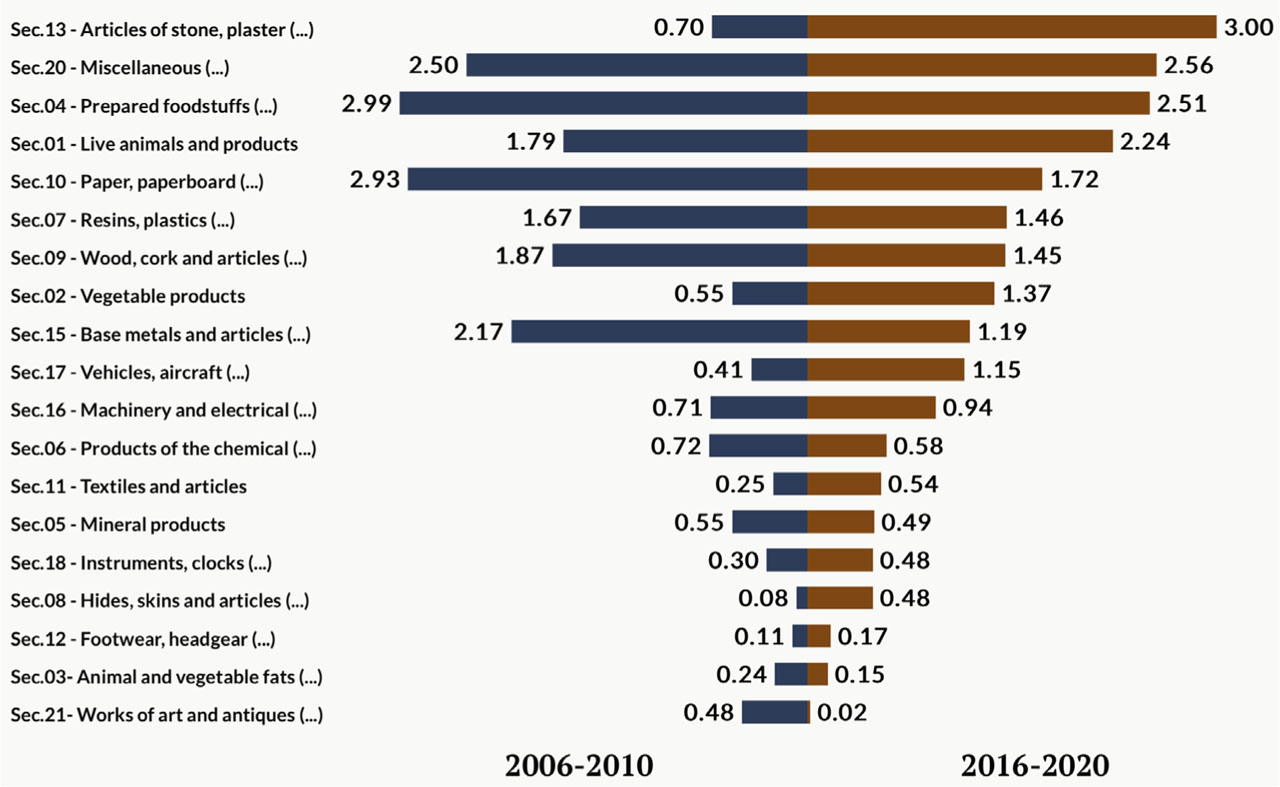
Figure 4.
Share of Exports to WB (Poland relative to EU)
Table 1.
Survival Analysis, Poland RCAs to WBs, SAAs contribution, by Section
| Sections | The Kaplan-Meier Survival Rates After 5 Years | The Kaplan-Meier Survival Rates After 10 Years | ||
|---|---|---|---|---|
| SAAs | No Trade Agreement | SAAs | No Trade Agreement | |
| Sec.01 - Live animals and products | 50.94% | 31.32% | 18.07% | 3.74% |
| Sec.02 - Vegetable products | 51.07% | 28.93% | 17.02% | 5.35% |
| Sec.03 - Animal and vegetable fats, oils and waxes | 47.67% | 26.67% | 16.43% | 1.82% |
| Sec.04 - Prepared foodstuff; beverages, | 51.73% | 36.02% | 18.40% | 6.00% |
| Sec.05 - Mineral products | 47.51% | 27.85% | 15.50% | 3.71% |
| Sec.06 - Products of the chemical and allied industries | 48.55% | 46.08% | 16.98% | 9.75% |
| Sec.07 - Resins, plastics and articles; | 50.94% | 39.13% | 18.13% | 9.97% |
| Sec.08 - Hides, skins and articles; saddlery and travel goods | 49.18% | 39.12% | 17.38% | 9.33% |
| Sec.09 - Wood, cork and articles; basketware | 49.11% | 27.61% | 16.52% | 5.12% |
| Sec.10 - Paper, paperboard and articles | 49.79% | 35.59% | 17.39% | 8.14% |
| Sec.11 - Textiles and articles | 50.73% | 36.61% | 18.56% | 8.59% |
| Sec.12 - Footwear, headgear; feathers, artif. flowers, fans | 48.76% | 36.64% | 16.14% | 11.26% |
| Sec.13 - Articles of stone, plaster; ceramic prod.; glass | 49.79% | 33.77% | 17.05% | 7.11% |
| Sec.14 - Pearls, precious stones and metals; coin | 46.71% | 54.69% | 15.30% | 20.31% |
| Sec.15 - Base metals and articles | 49.99% | 35.56% | 17.64% | 7.65% |
| Sec.16 - Machinery and electrical equipment | 49.51% | 38.87% | 17.36% | 10.26% |
| Sec.17 - Vehicles, aircraft and vessels | 50.32% | 42.26% | 17.47% | 13.52% |
| Sec.18 - Instruments, clocks, recorders | 49.28% | 49.09% | 17.69% | 14.03% |
| Sec.19 - Arms and ammunition | 44.48% | 66.67% | 3.73% | |
| Sec.20 - Miscellaneous manufactured articles | 50.80% | 37.42% | 17.67% | 9.82% |
| Sec.21 - Works of art and antiques | 46.50% | 51.85% | 11.86% | 7.41% |
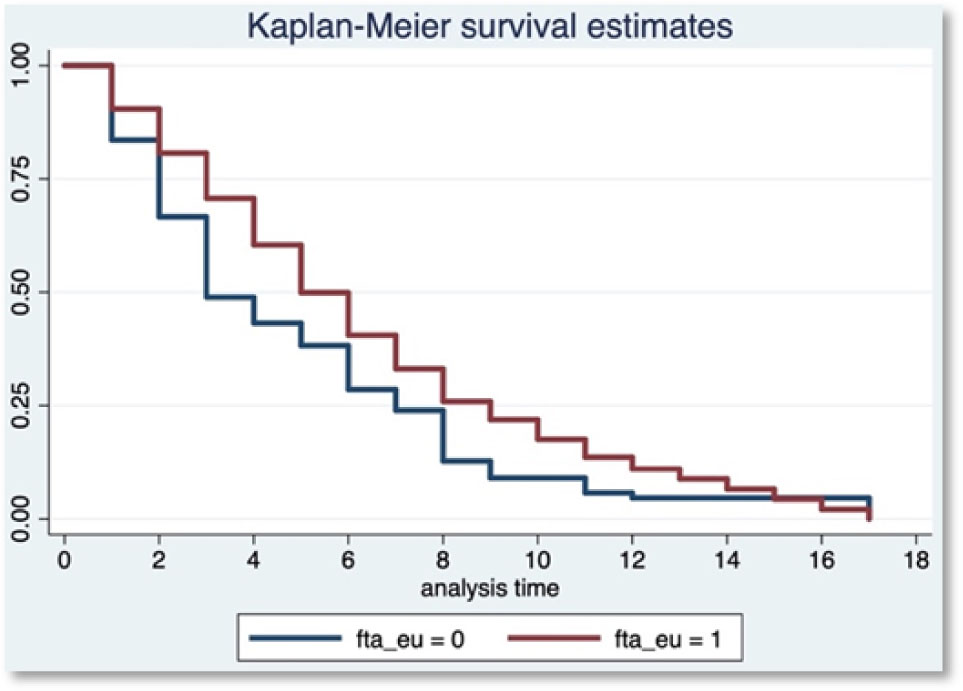
Figure 5.
Kaplan Meier Survival Export RCAs Estimations, Poland compared to the EU
Table 2.
Survival Analysis, Export RCAs to WBs, Poland vs. EU, by Section
| Sections | The Kaplan-Meier Survival Rates, After 5 Years | The Kaplan-Meier Survival Rates, After 10 Years | ||
|---|---|---|---|---|
| Poland | EU | Poland | EU | |
| Sec.01 - Live animals and products | 56.5% | 52.6% | 24.9% | 18.2% |
| Sec.02 - Vegetable products | 55.9% | 52.2% | 19.0% | 17.3% |
| Sec.03 - Animal and vegetable fats, oils and waxes | 55.1% | 49.0% | 26.6% | 16.5% |
| Sec.04 - Prepared foodstuff; beverages, | 55.9% | 53.2% | 21.4% | 18.6% |
| Sec.05 - Mineral products | 50.1% | 48.7% | 16.6% | 15.7% |
| Sec.06 - Products of the chemical and allied industries | 54.4% | 50.5% | 19.8% | 17.5% |
| Sec.07 - Resins, plastics and articles; | 53.9% | 52.7% | 19.2% | 18.7% |
| Sec.08 - Hides, skins and articles; saddlery and travel goods | 54.9% | 50.9% | 21.0% | 17.8% |
| Sec.09 - Wood, cork and articles; basketware | 51.4% | 50.6% | 16.7% | 16.9% |
| Sec.10 - Paper, paperboard and articles | 52.5% | 51.7% | 17.7% | 18.0% |
| Sec.11 - Textiles and articles | 52.7% | 52.7% | 19.3% | 19.2% |
| Sec.12 - Footwear, headgear; feathers, artif. flowers, fans | 53.1% | 50.3% | 18.2% | 16.6% |
| Sec.13 - Articles of stone, plaster; ceramic prod.; glass | 54.7% | 51.2% | 19.7% | 17.4% |
| Sec.14 - Pearls, precious stones and metals; coin | 93.4% | 88.5% | 87.8% | 79.8% |
| Sec.15 - Base metals and articles | 54.6% | 51.5% | 19.1% | 18.1% |
| Sec.16 - Machinery and electrical equipment | 54.0% | 51.4% | 19.3% | 17.9% |
| Sec.17 - Vehicles, aircraft and vessels | 53.5% | 52.1% | 19.2% | 18.0% |
| Sec.18 - Instruments, clocks, recorders | 53.6% | 51.2% | 20.9% | 18.2% |
| Sec.19 - Arms and ammunition | 88.9% | 81.7% | 81.7% | |
| Sec.20 - Miscellaneous manufactured articles | 54.2% | 52.7% | 20.2% | 18.2% |
| Sec.21 - Works of art and antiques | 66.6% | 70.0% | 13.3% | 40.0% |
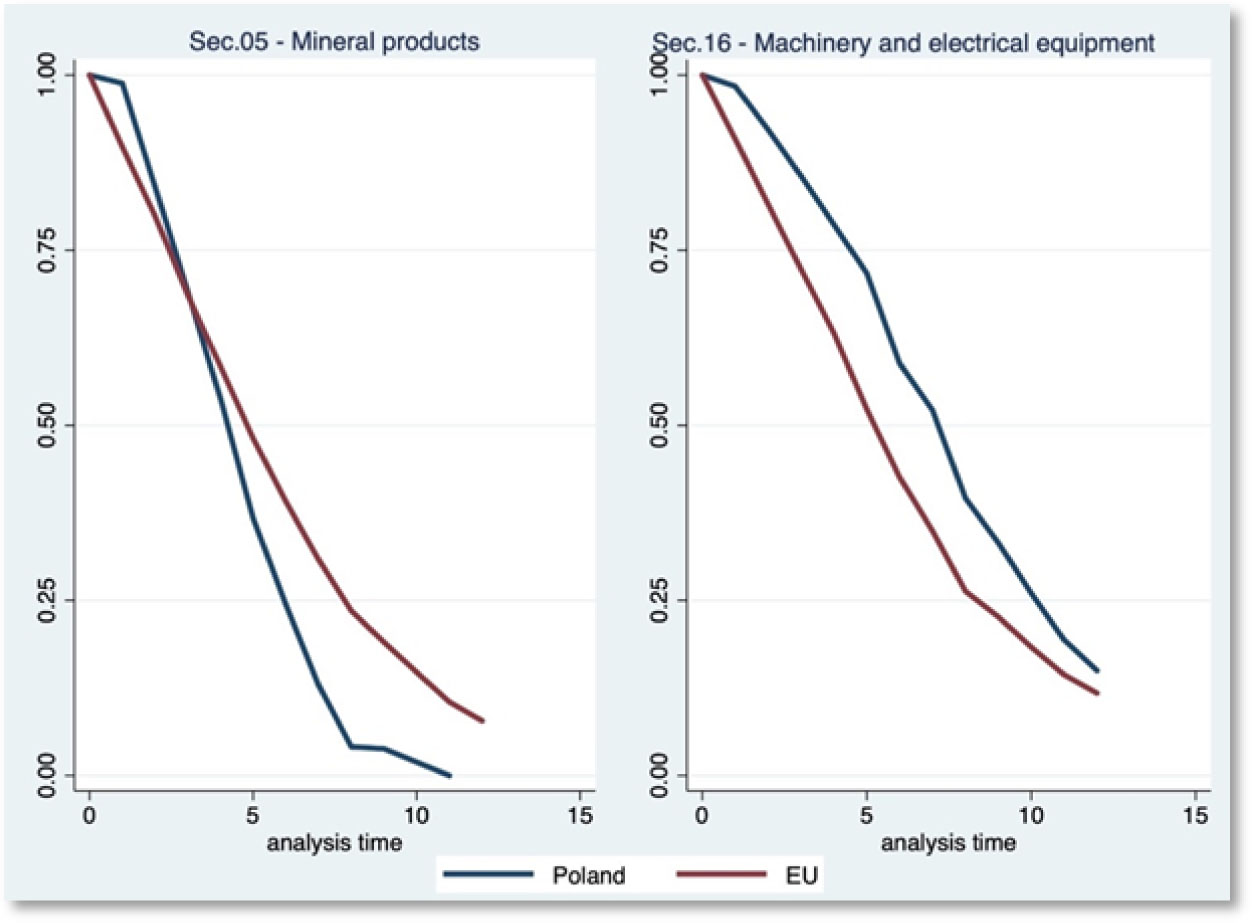
Figure 6.
Kaplan Meier Export RCAs Estimations, Sections 5 & 16, Poland vs. the EU
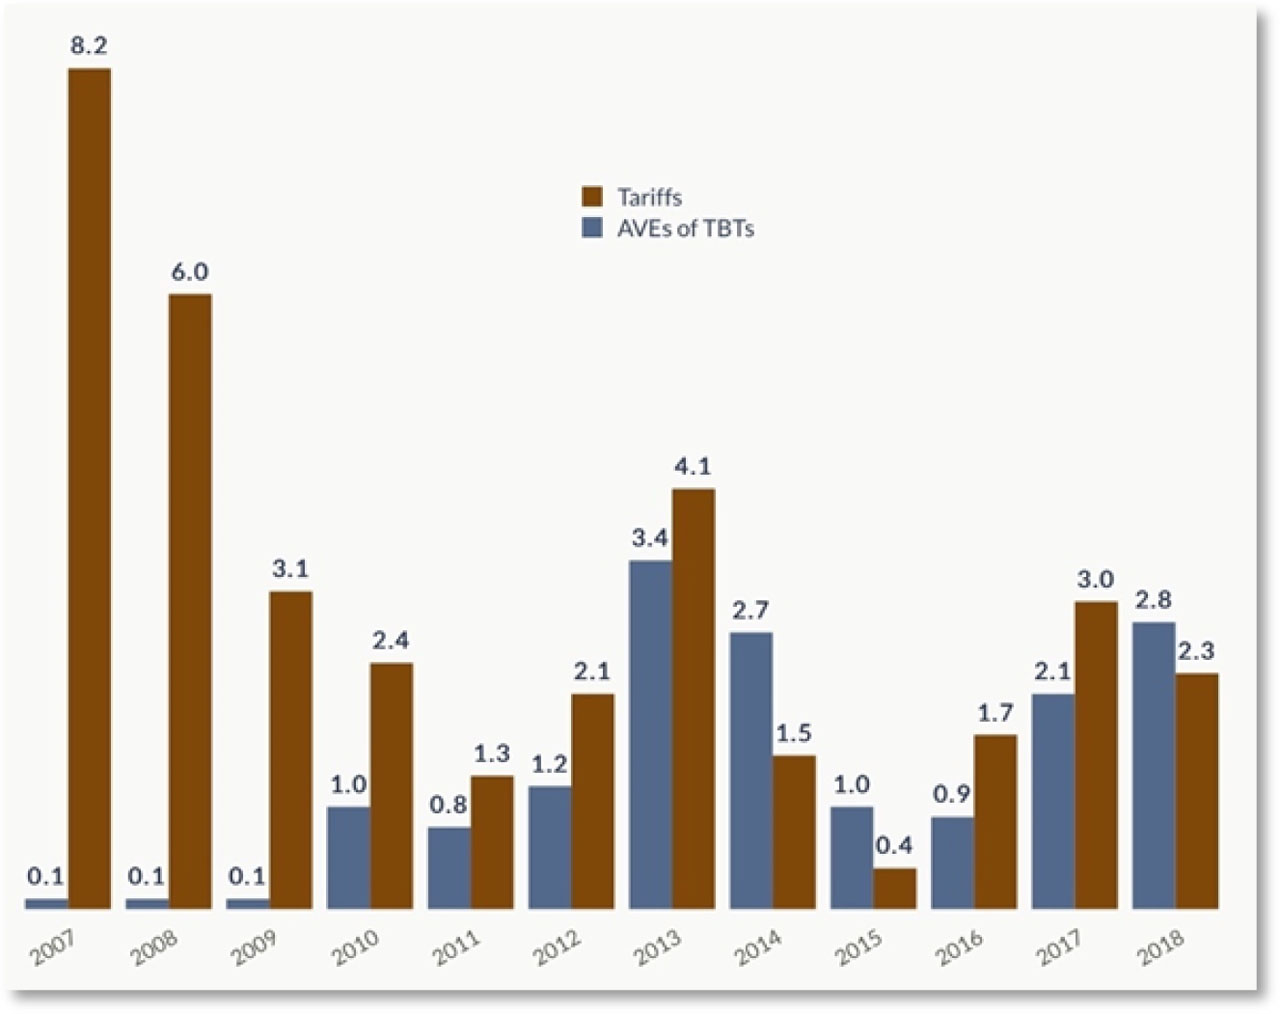
Figure 7.
Tariffs vs. TBTs in the WBs on Polish Exports
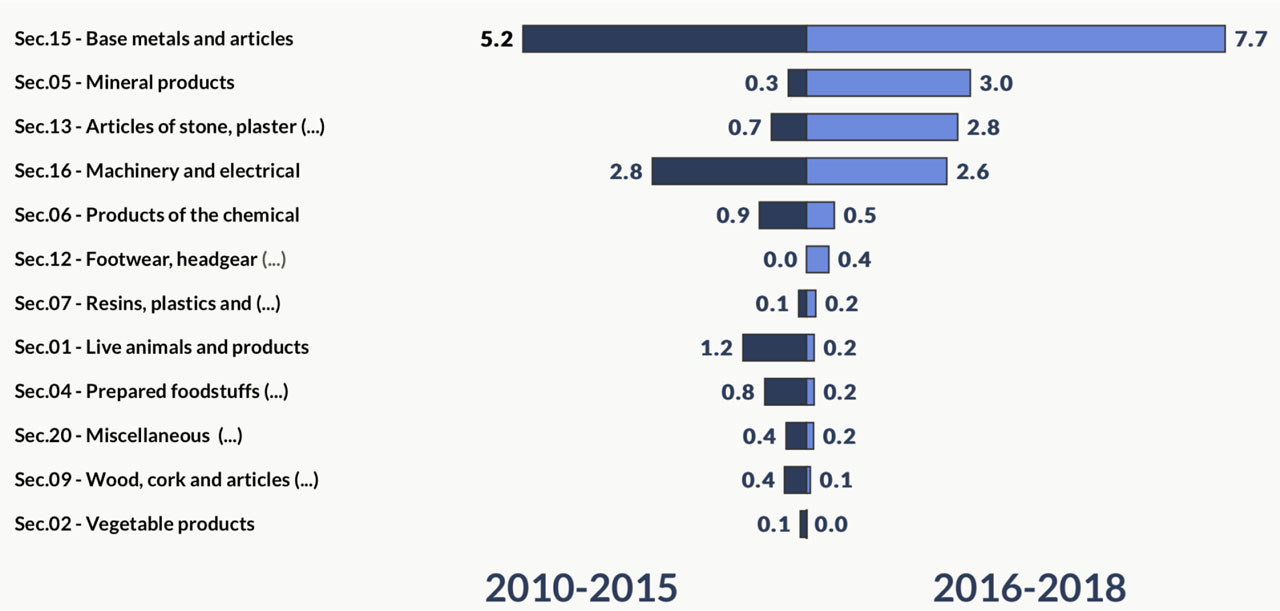
Figure 8.
TBTs on Polish Exports to the WB Region, by Sections