

Table 1
Attribute levels
| Attribute | Levels |
|---|---|
| Increase in life expectancy | 0 years; 6 months; 1 year; 2 years |
| Improvement in health on a 10-point scale | 0 point; 1 point; 2 points |
| Monthly cost in the form of higher tax | 10 PLN; 20 PLN; 50 PLN; 100 PLN |
[i] Source: Questionnaire for general and dialysis population (2008).
Table 2
Sample choice card
| Health effects and programme cost | Programme 0 | Programme A | Programme B |
|---|---|---|---|
| Increase in life expectancy | 0 years | 1 year | 1 year |
| Improvement in health on a 10-point scale | 0 point | 0 point | 1 point |
| Monthly cost in the form of higher tax | 0 PLN | 20 PLN | 50 PLN |
| Your choice |  | | |
[i] I don’t want to pay anything
[ii] Source: Questionnaire for general and dialysis population (2008).
Table 3
Estimation results of the multinomial logit model for the general population
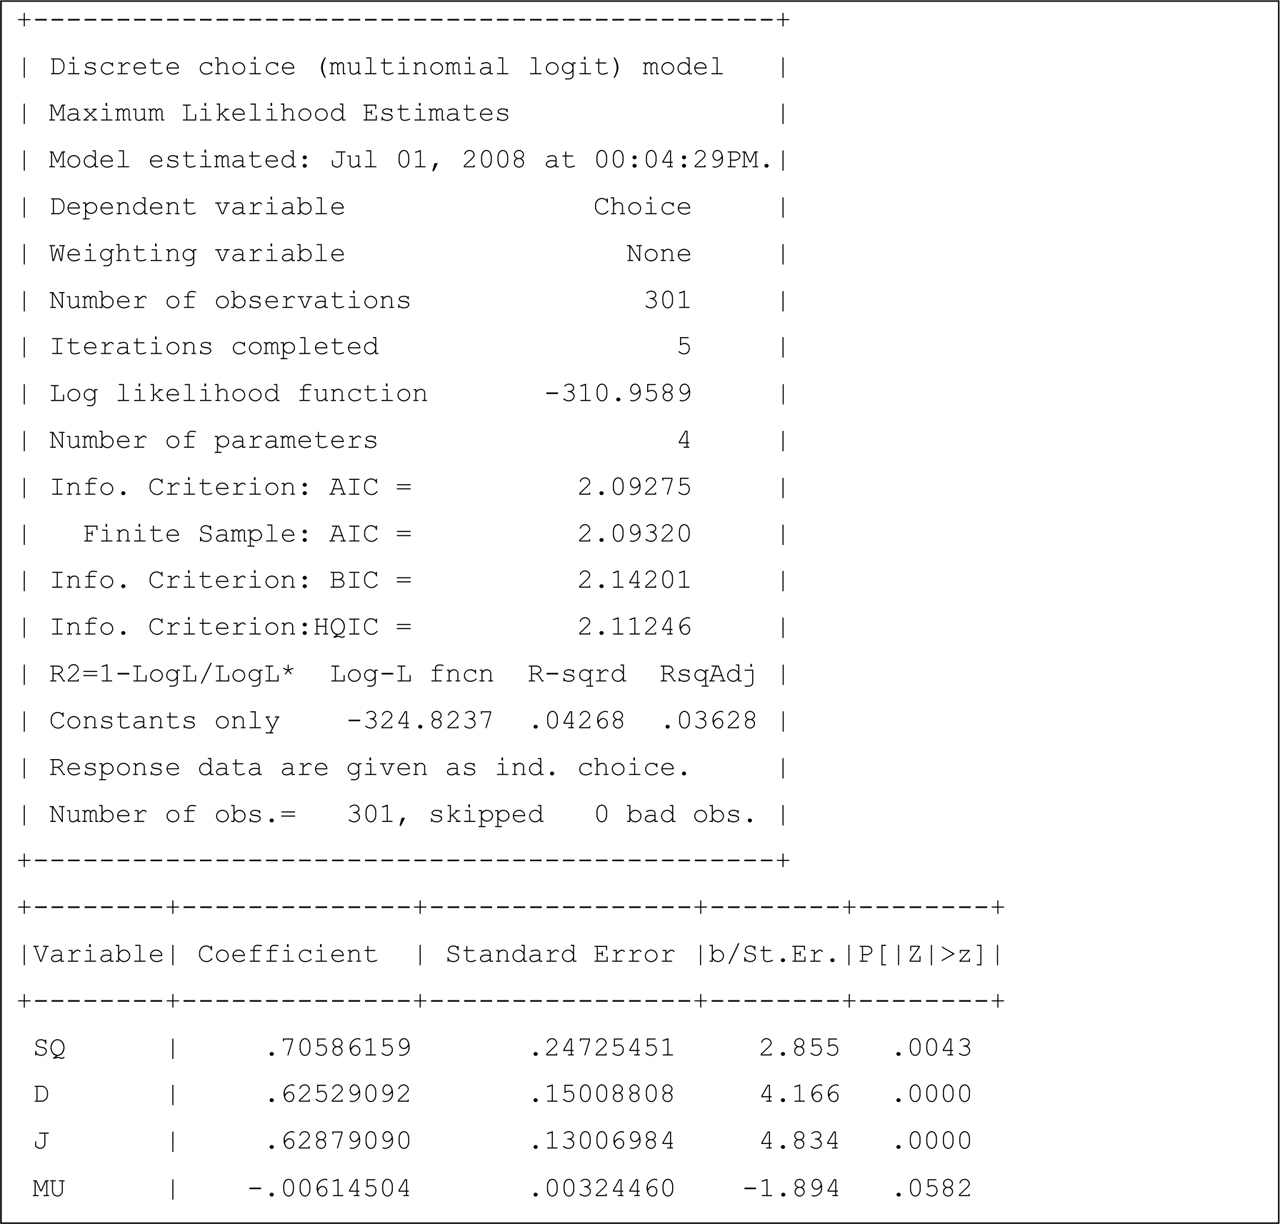
[i] Source: Calculations made with the use of the Limdep 4.0 statistical package.
Table 4
VOLY values for the general population
| VOLYD | 39,127 PLN |
|---|---|
| VOLYD+J | 78,254 PLN |
[i] Source: Calculations based on the WTP results for the general population.
Table 5
Estimation results of the multinomial logit model with an error component for the dialysis population
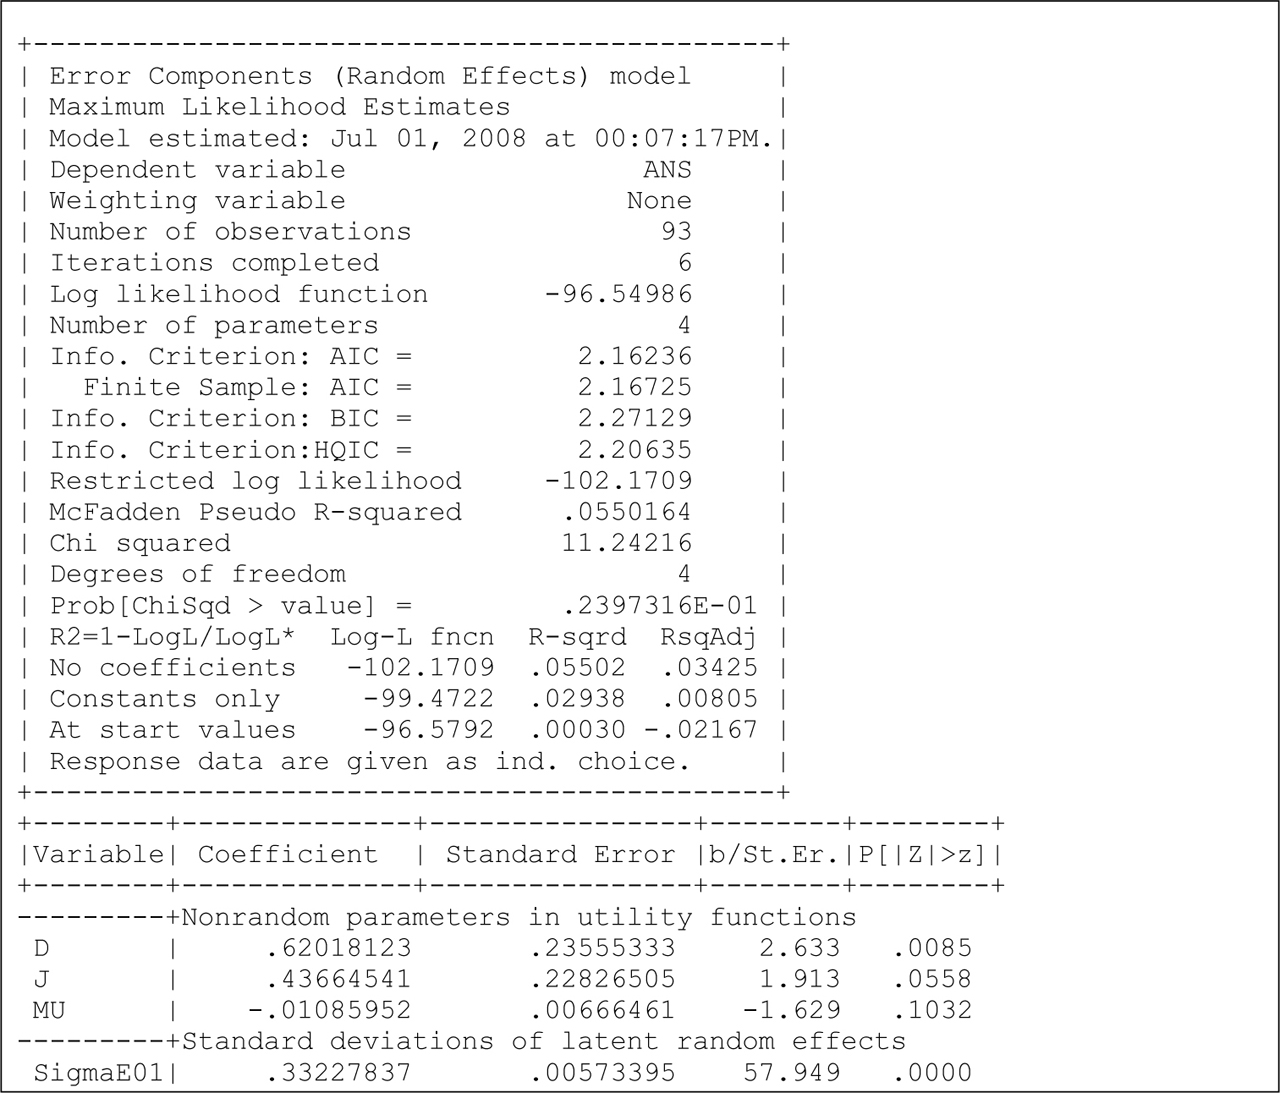
[i] Source: Calculations made with the use of the Limdep 4.0 statistical package
Table 6
VOLY values for the dialysis population
| VOLYD | 14,655 PLN |
|---|---|
| VOLYD+J | 24,939 PLN |
[i] Source: Calculations based on WTP results for the dialysis population.
Table 7
WTP and VOLY in 2008 and 2020 values (PLN)
| Sample | WTP2008 | VOLY2008 | WTP2020 | VOLY2020 |
|---|---|---|---|---|
| General population 1-year increase in life expectancy | 102 | 39,127 | 144 | 55,106 |
| General population 1-year increase in life expectancy and 1-point improvement in health quality | 204 | 78,254 | 287 | 110,212 |
| Dialysis population 1-year increase in life expectancy | 57 | 14,655 | 80 | 20,640 |
| Dialysis population 1-year increase in life expectancy and 1-point improvement in health quality | 97 | 24,939 | 137 | 35,124 |
[i] Source: Calculations based on the WTP results from the 2008 questionnaire; 2020 values were calculated on the basis of annual macroeconomic indicators from GUS (2008–2020).