

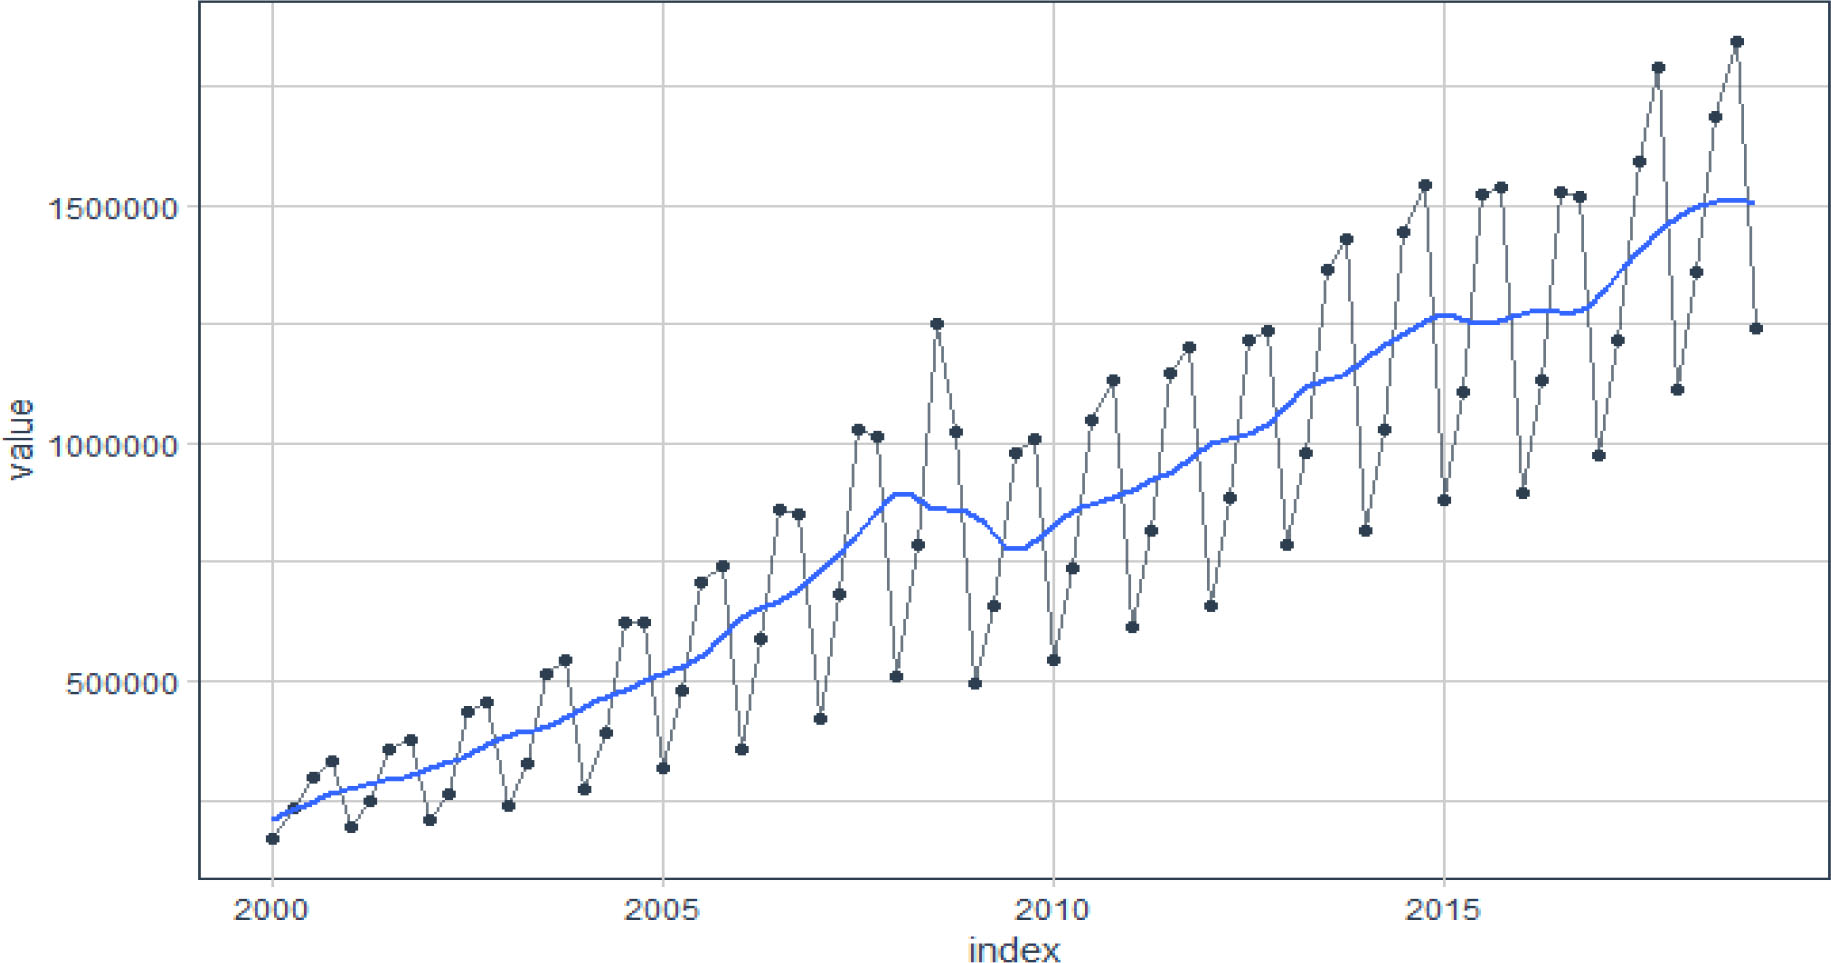
Fig. 1
Quarterly GDP of Armenia.
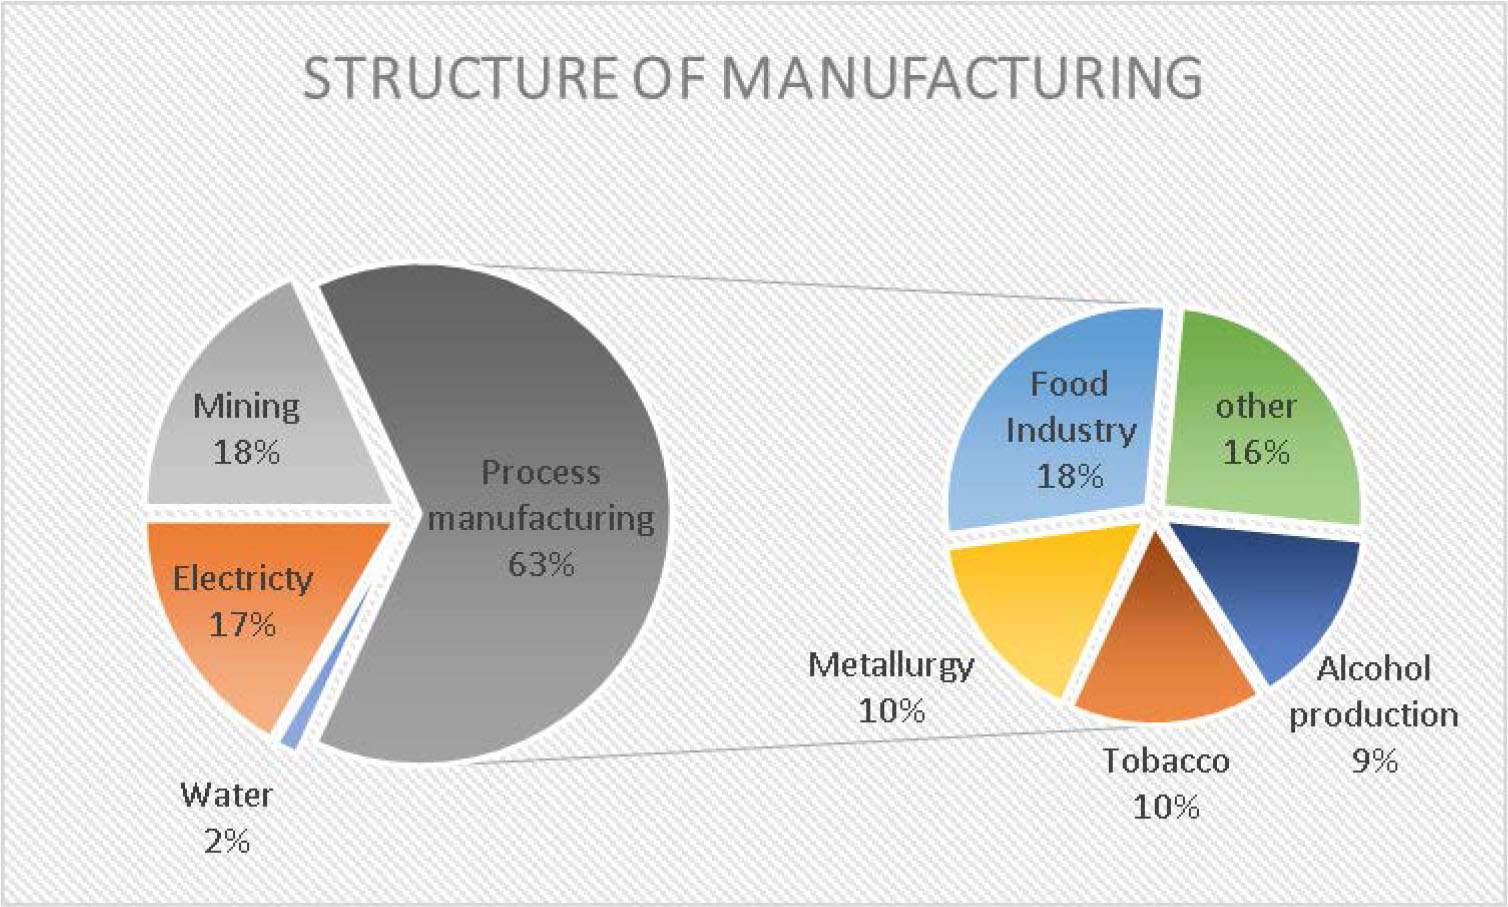
Fig. 2
Structure of manufacturing in 2017.
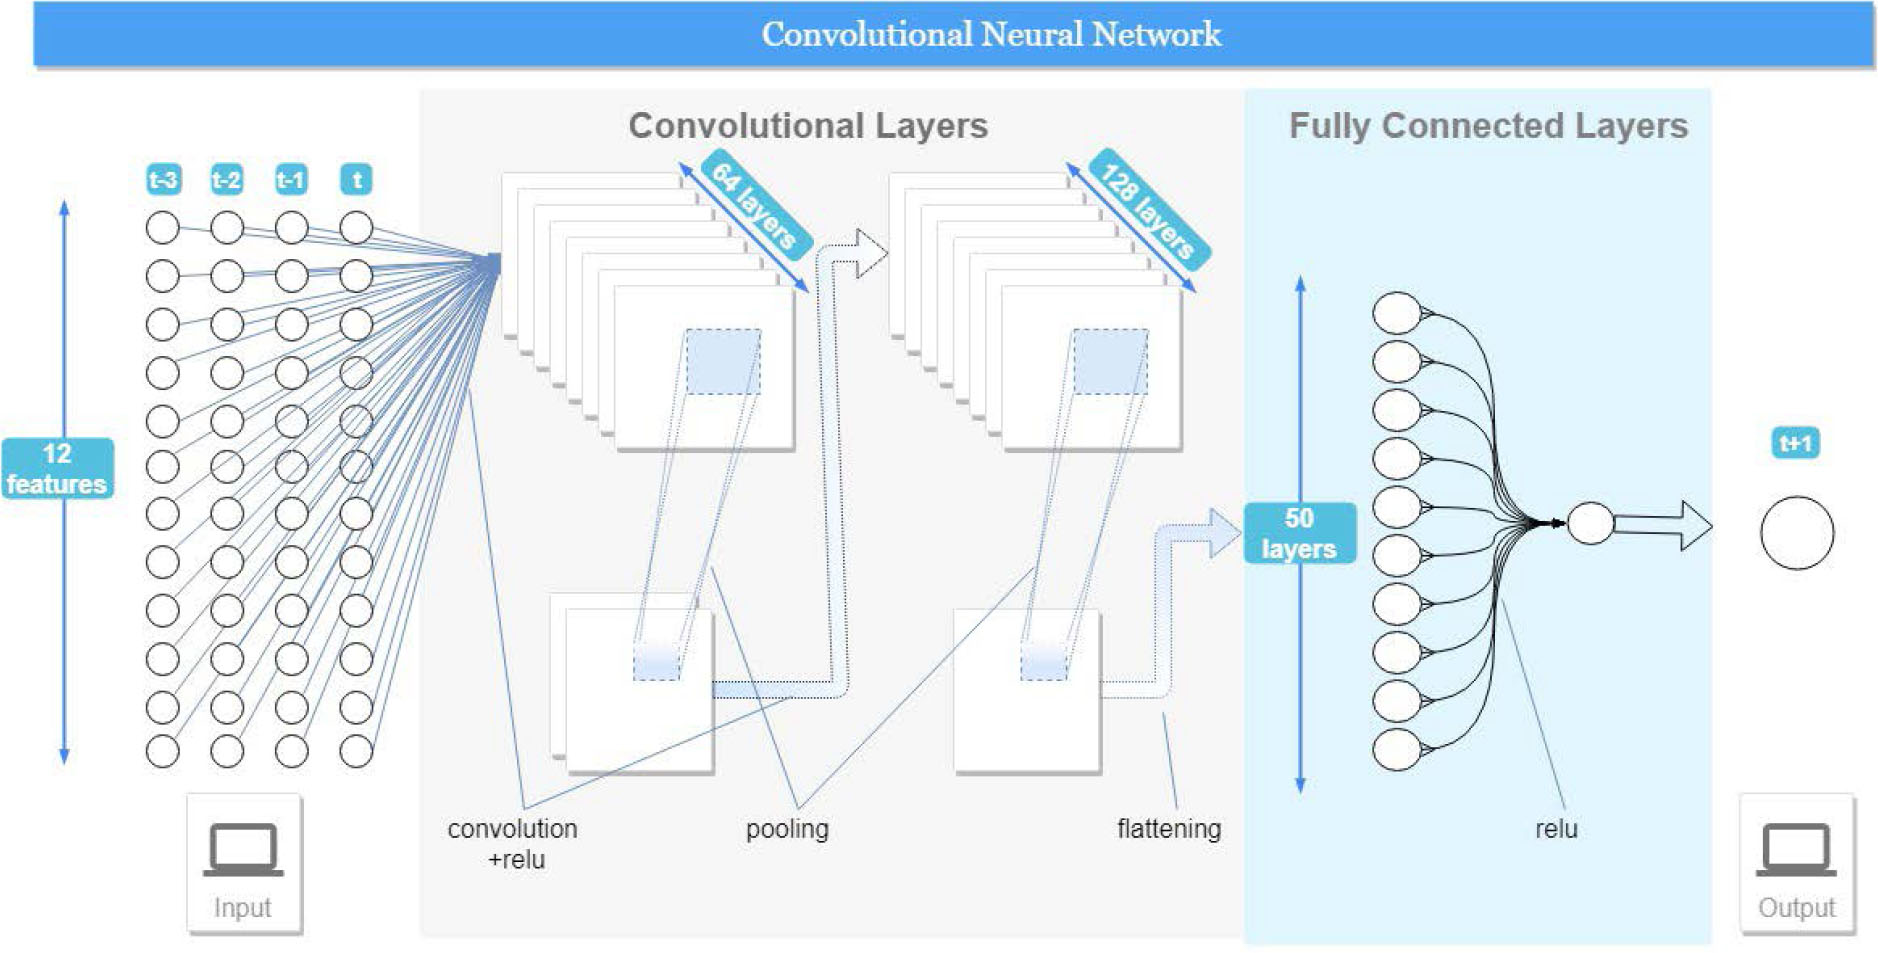
Fig. 3
Convolutional neural network architecture.
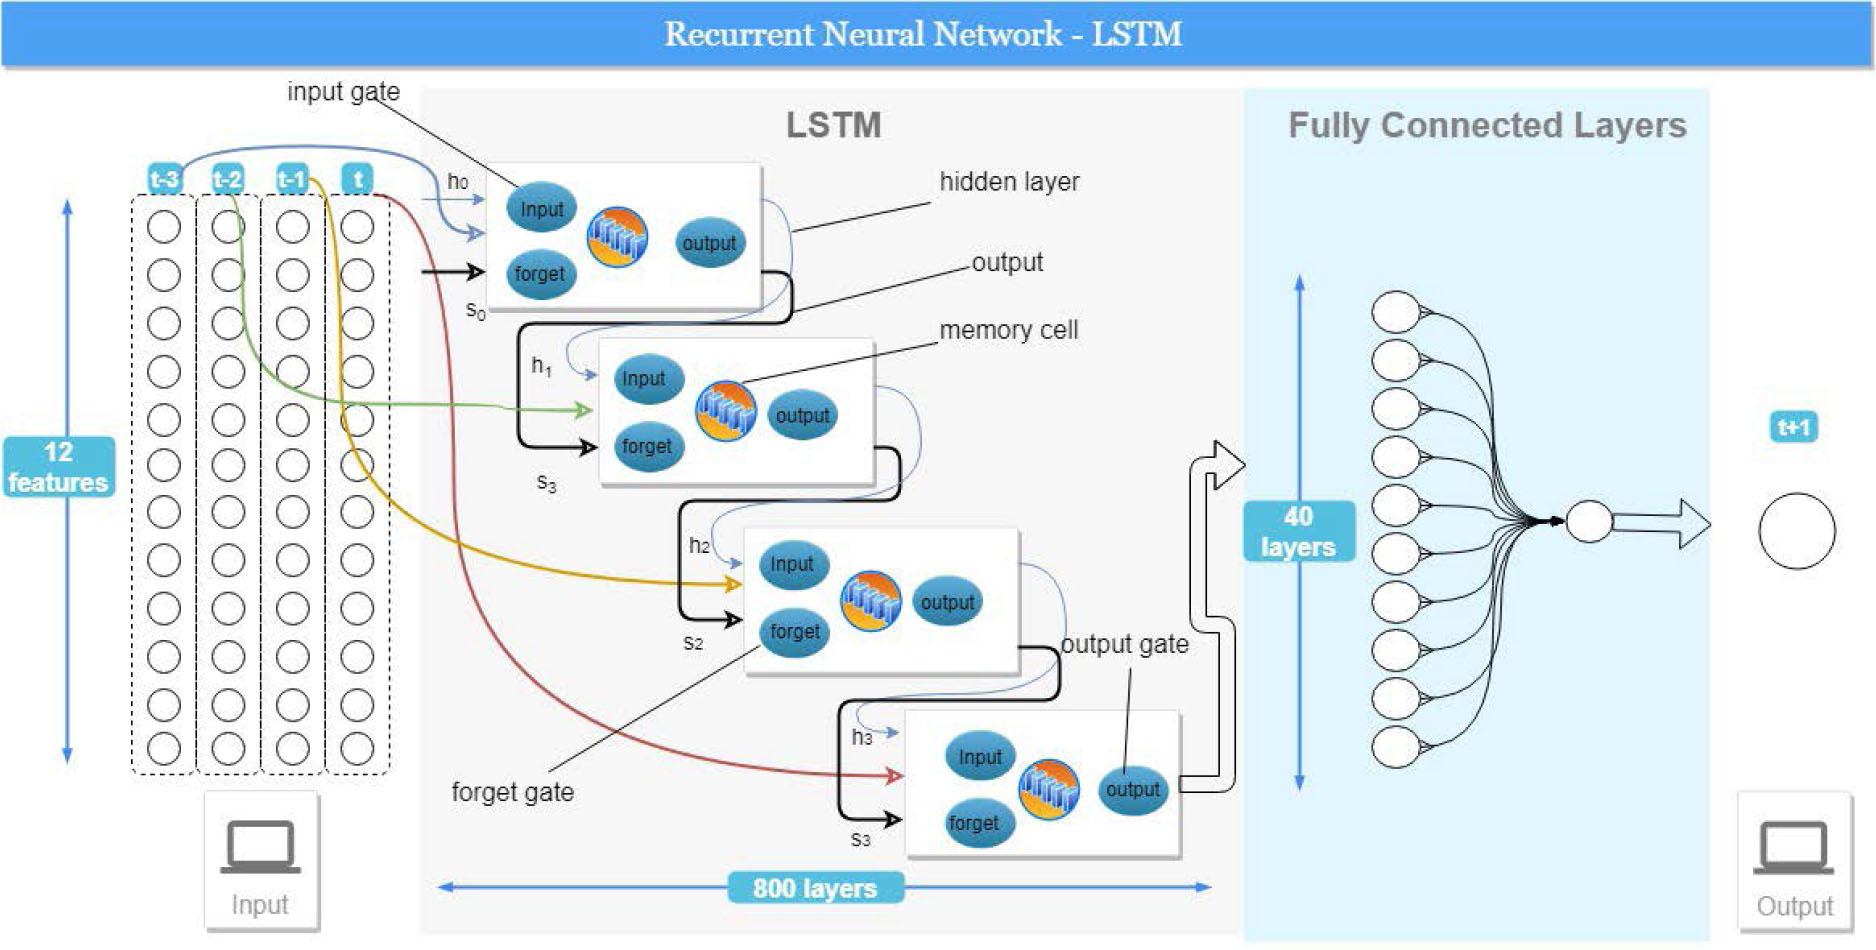
Fig. 4
LSTM recurrent neural network architecture.
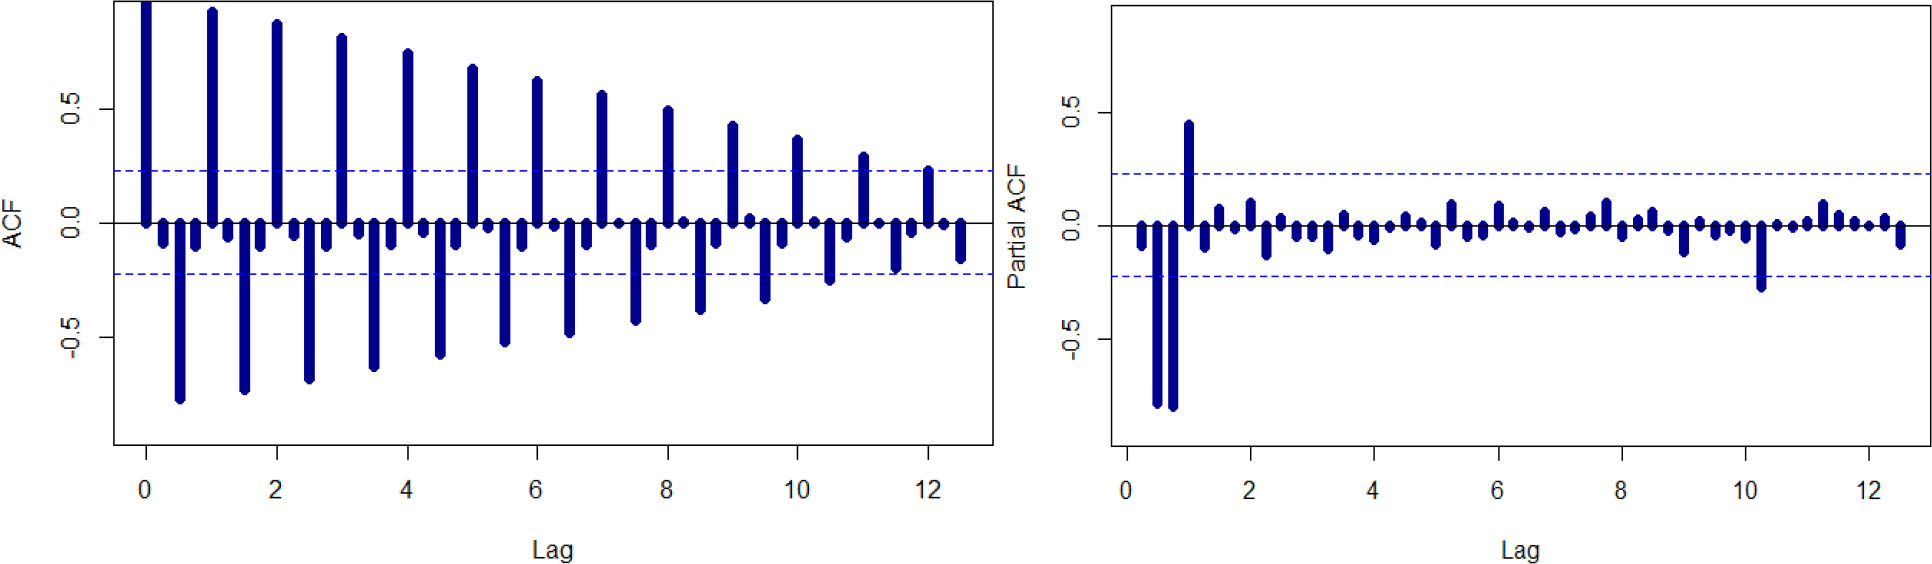
Figure 5
ACF and PACF graphs for the SARIMA model.
Table 1
Model error statistics
| RMSE | MAE | MedAE | R2 | SD | |
|---|---|---|---|---|---|
| CNN | 58266.74 | 46161.45 | 34190.78 | 0.9778 | 13733.60 |
| Stacking linear | 58119.65 | 46434.29 | 48105.92 | 0.9780 | 13698.93 |
| SARIMA | 66447.39 | 47783.78 | 36712.05 | 0.9712 | 15661.80 |
| Stacking LASSO | 59349.38 | 47907.44 | 48731.62 | 0.9770 | 13988.78 |
| Simple average | 70968.70 | 57434.54 | 48855.18 | 0.9671 | 16727.48 |
| LSTM | 102526.21 | 77680.84 | 56860.31 | 0.9314 | 24165.66 |
| ECM | 128851.99 | 109558.86 | 101529.37 | 0.8917 | 30370.71 |
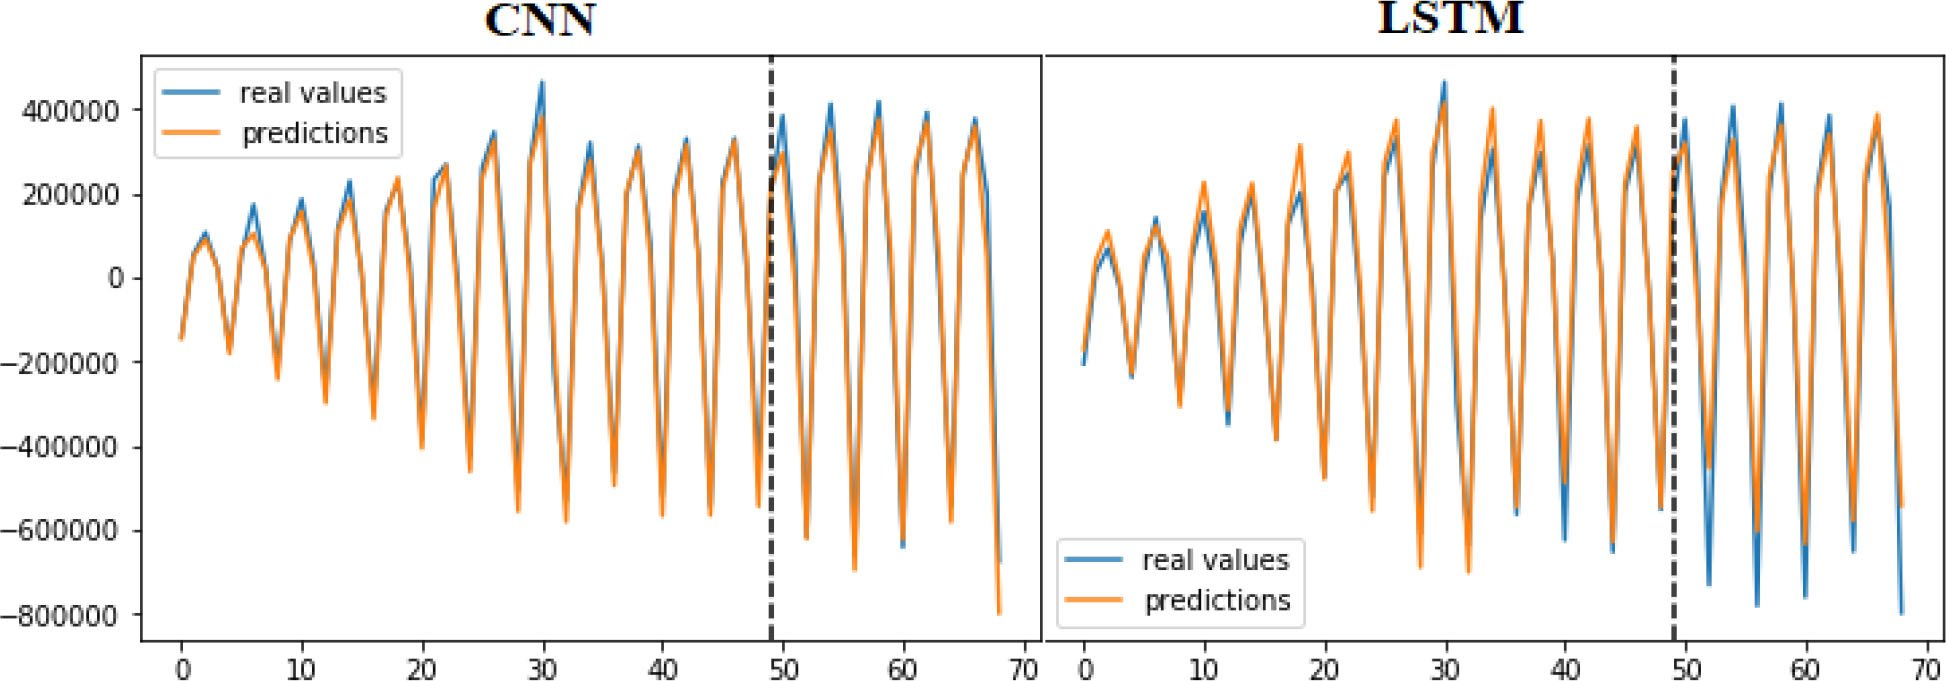
Fig. 6
CNN and LSTM real versus predicted values.
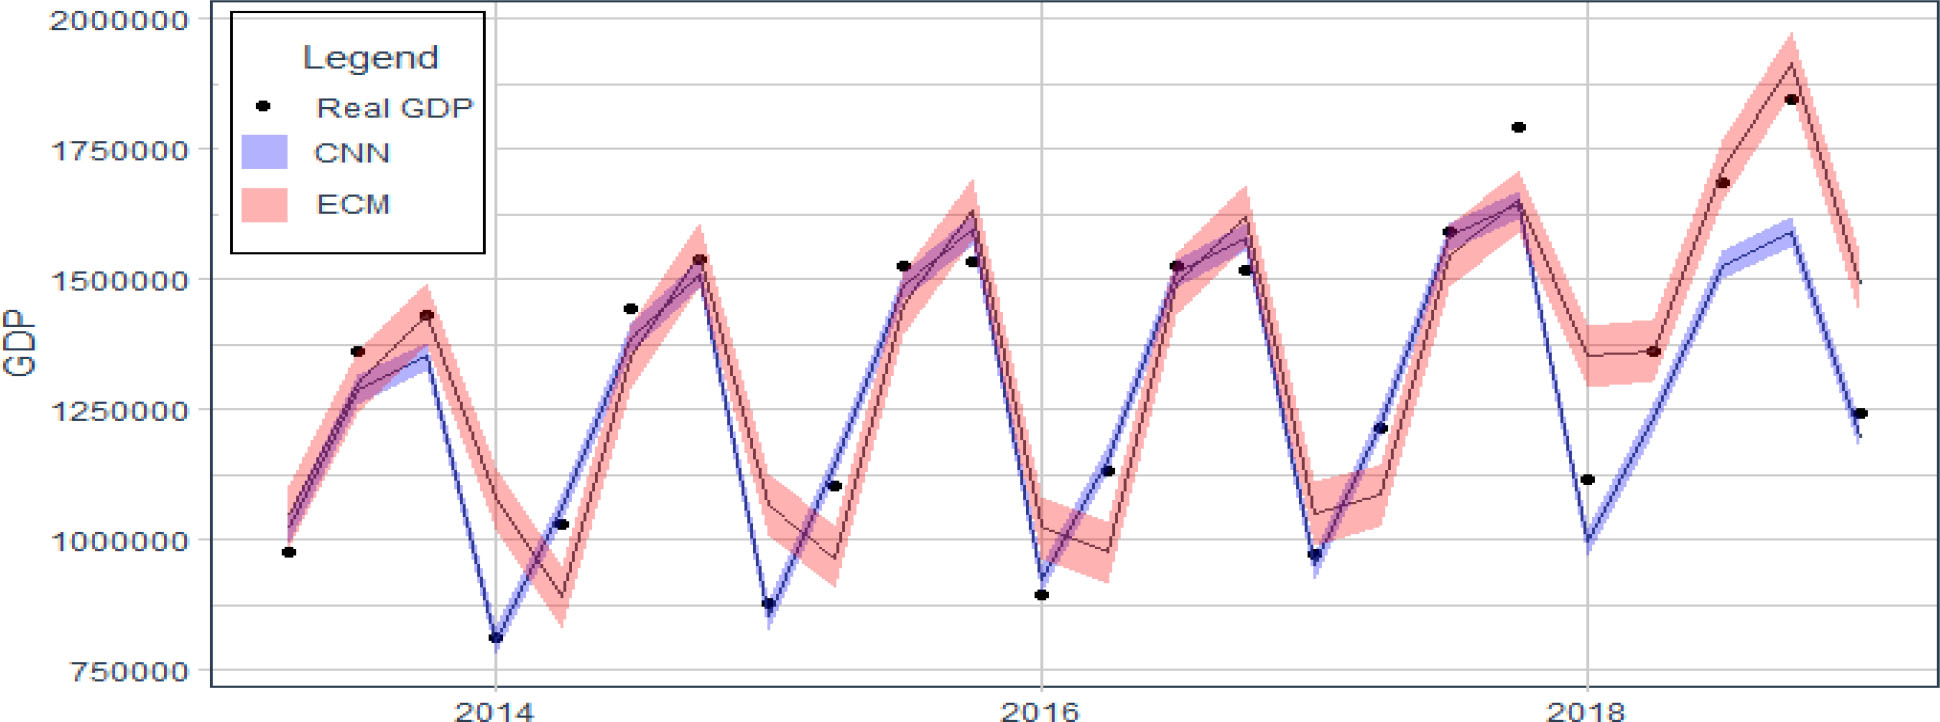
Fig. 7
CNN and ECM test predictions including post-revolutionary data.
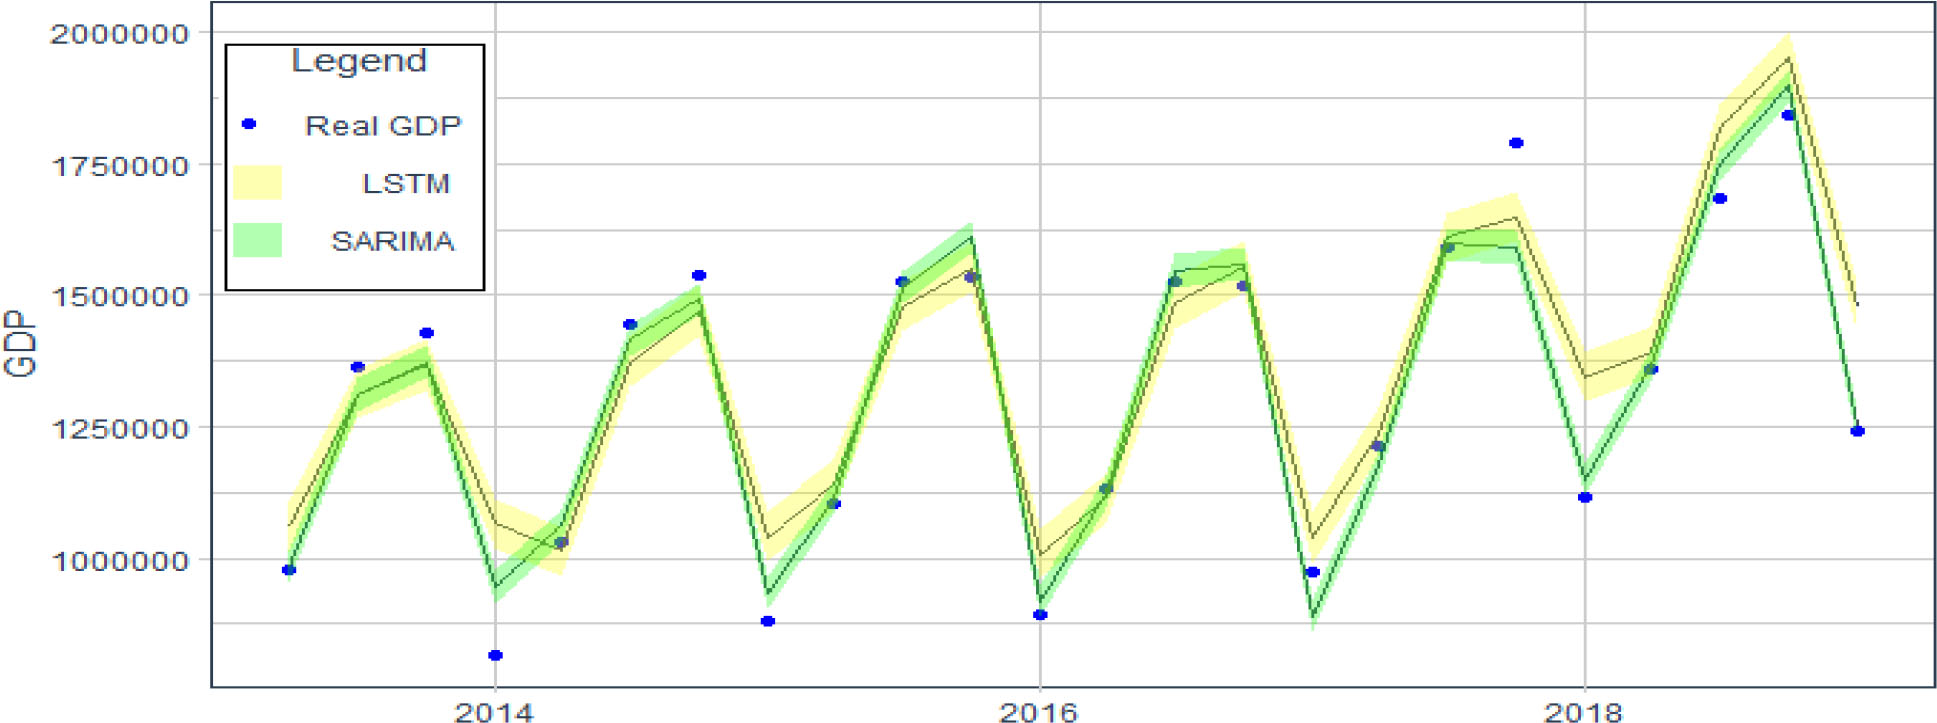
Fig. 8
LSTM and SARIMA test predictions including post-revolutionary data.
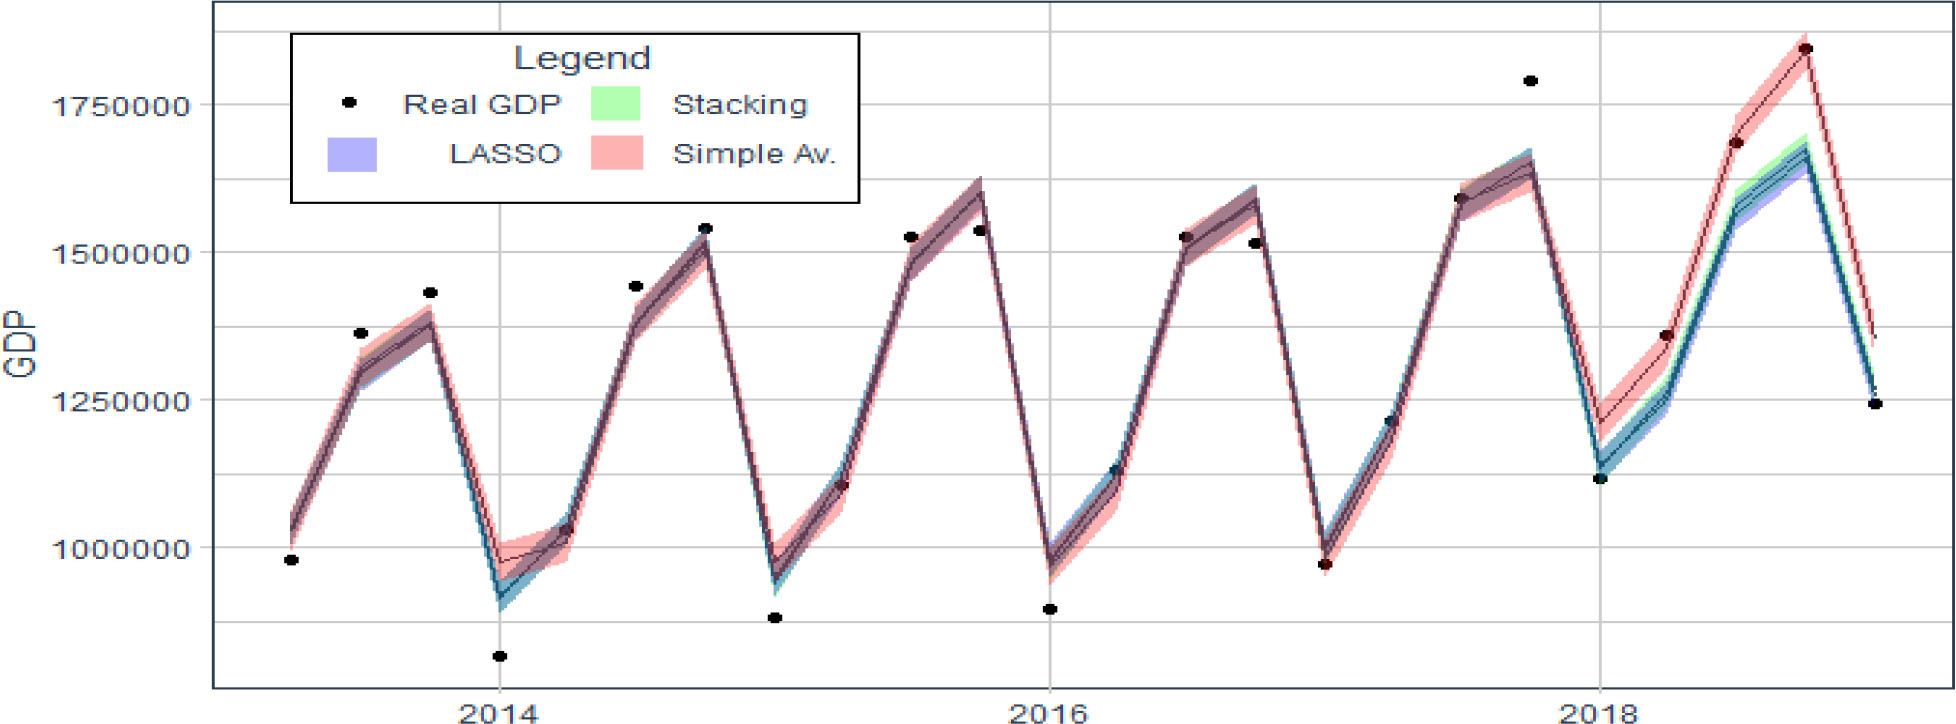
Fig. 9
Stacking, LASSO and Simple Av. test predictions including post-revolutionary data.