

Table 1:
Chemical analysis (according to IQS No.472/2019)
| Oxide % | Ordinary Portland cement (OPC) | Limits IQS No. |
|---|---|---|
| CaO | 60.41 | - |
| Si2O | 21.84 | - |
| AL2O3 | 4.72 | - |
| Fe2O3 | 3.60 | - |
| MgO | 1.50 | ≤5% |
| SO3 | 2.38 | ≤2.5% if C3A < 5% or ≤ 2.8% if C3A >5% |
| L.O.I | 3.27 | ≤4% |
| Free lime % | 1.12 | - |
| Insoluble residue % | 1.12 | ≤1.5% |
| L.S.F | 0.83 | 0.66–1.02 |
| Compounds | ||
| C3S % | 31.74 | - |
| C2S % | 38.67 | - |
| C3A % | 6.42 | - |
| C4AF % | 10.95 | - |
| Initial setting time (hour: min.) | 2.08 | 00:45 (Min.) |
| Final setting time (hour: min.) | 4:30 | 10:00 (Max.) |
| Fineness (Blaine) in m2/kg | 425 | 230 (Min.) |
| Compressive strength (MPa) at 3 days / 7days | 16 / 23 | 15 (Min.) / 23 (Min.) |
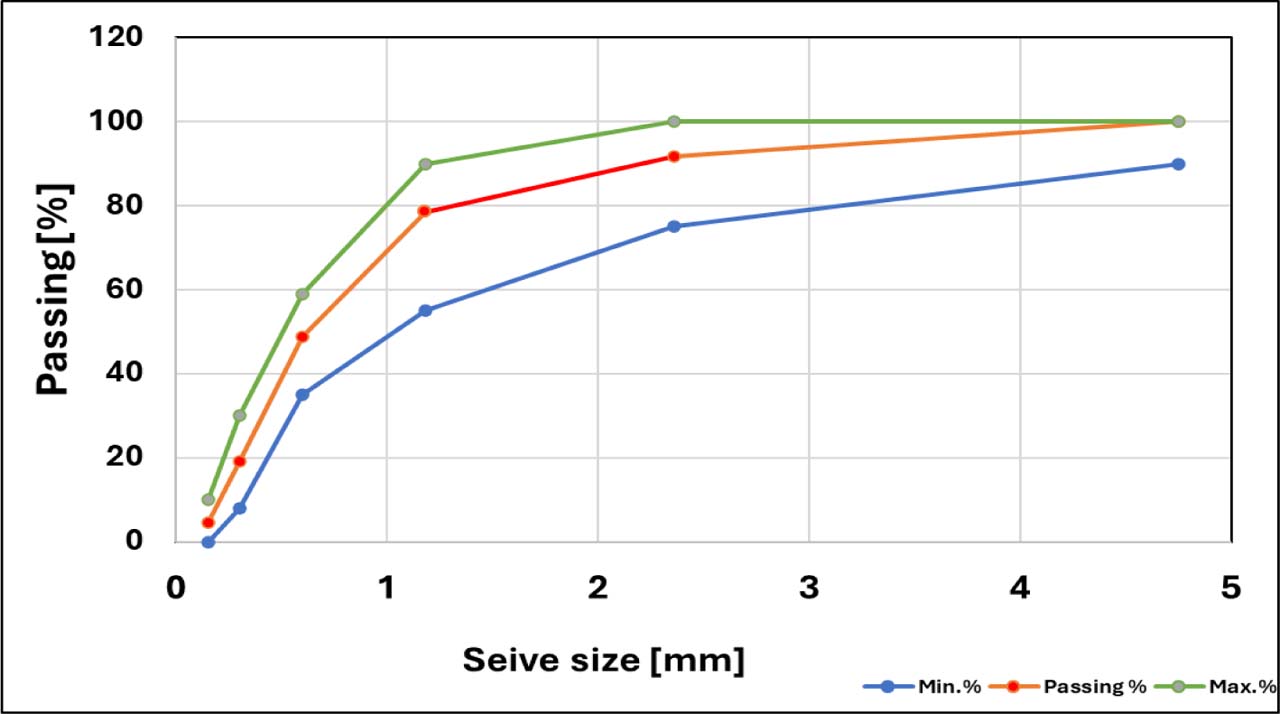
Figure 1:
Grading of sand
Table 2:
Chemical analysis of glass
| Oxides | SiO2 | MgO | CaO | Al2O3 | Fe2O3 | Na2O | SO3 | CuO | ZnO |
|---|---|---|---|---|---|---|---|---|---|
| Oxides content (Wt.%) | 72.5 | 3.72 | 10.2 | 0.70 | 0.31 | 9.9 | 0.244 | 0.227 | 0.133 |
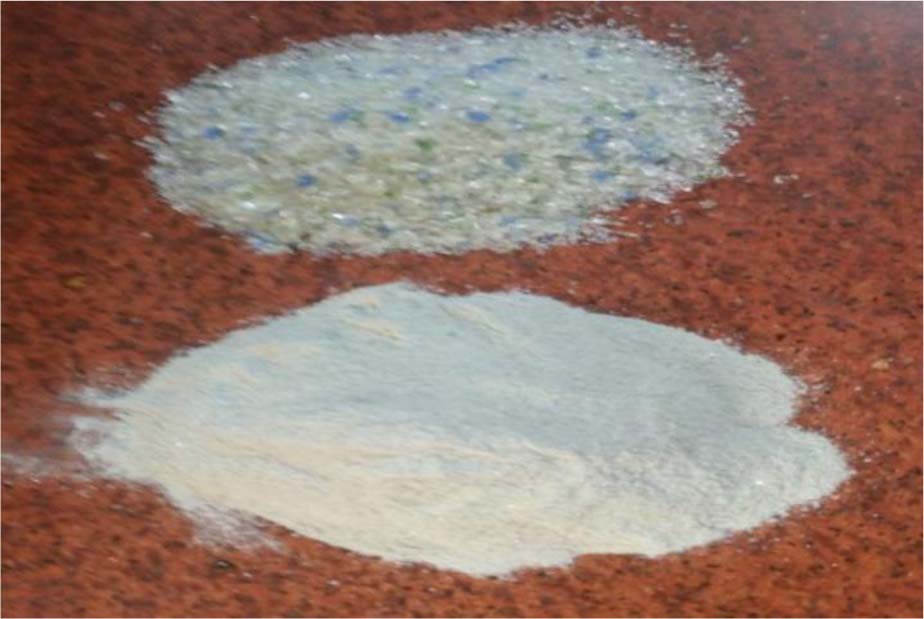
Figure 2:
Coarse and fine glass
Table 3:
Chemical properties of fly ash and limestone powder
| Test Items | Fly ash [%] | ASTM 618-05 | Limestone |
|---|---|---|---|
| SiO2 | 50 | 6.84 | |
| Al2O3 | 31 | 1.12 | |
| CaO | 5 | 45.73 | |
| MgO | 0.28 | 4.37 | |
| SO3 | 1.3 | ≤5% | 3.2 |
| Fe2O3 | 7.4 | 0.24 | |
| TiO2 | 1.6 | ||
| K2O | 1.3 | ||
| P2O3 | 0.9 | ||
| SiO2, Al2O3 and Fe2O3 | 88 | ≥70% | |
| L.O.I | 8 | ≤12% | 37.12 |
| Activity Index | 76 | ≥75% |
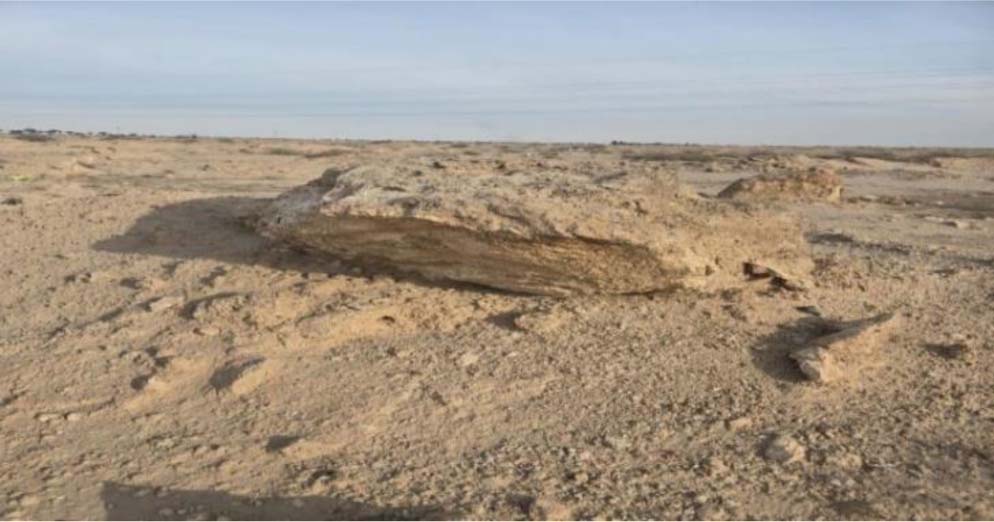
Figure 3:
Attapulgite aggregate
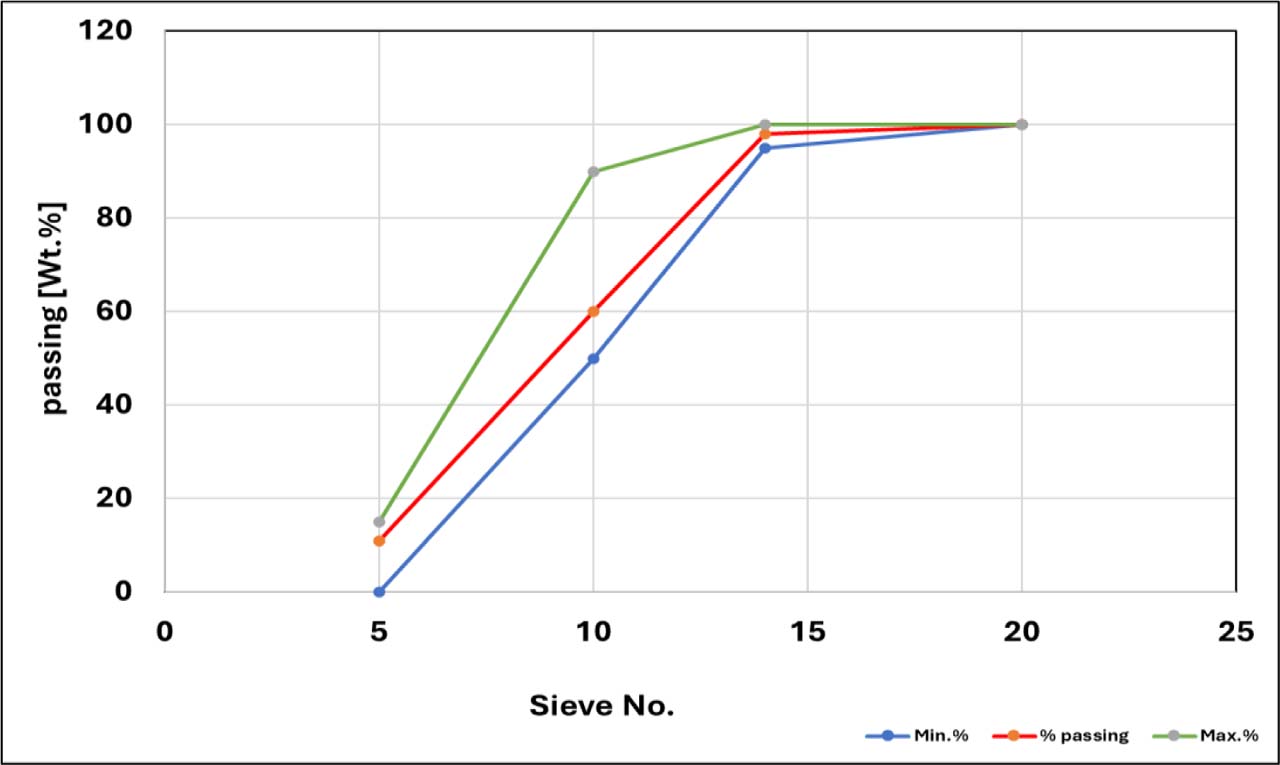
Figure 4:
Grading of attapulgite aggregate
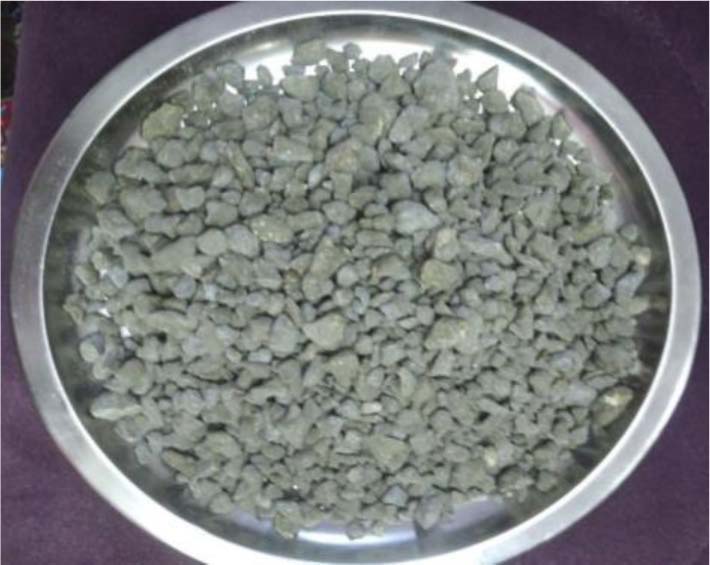
Figure 5:
Treated attapulgite by cement paste
Table 4:
Quantities of mixed materials [kg\m3]
| Mix code | C | FA | LP | w | w\b | CA | FA | GW | Sp % |
|---|---|---|---|---|---|---|---|---|---|
| G0 | 450 | 50 | 20 | 155 | 0.31 | 600 | 500 | 0 | 1.4 |
| GC10% | 450 | 50 | 20 | 155 | 0.31 | 600 | 450 | 50 | 1.37 |
| GC20% | 450 | 50 | 20 | 155 | 0.31 | 600 | 400 | 100 | 1.35 |
| GC30% | 450 | 50 | 20 | 155 | 0.31 | 600 | 350 | 150 | 1.42 |
| GC40% | 450 | 50 | 20 | 155 | 0.31 | 600 | 300 | 200 | 1.45 |
| GF10% | 450 | 50 | 20 | 155 | 0.31 | 600 | 450 | 50 | 1.43 |
| GF20% | 450 | 50 | 20 | 155 | 0.31 | 600 | 400 | 100 | 1.48 |
| GF30% | 450 | 50 | 20 | 155 | 0.31 | 600 | 350 | 150 | 1.52 |
| GF40% | 450 | 50 | 20 | 155 | 0.31 | 600 | 300 | 200 | 1.57 |
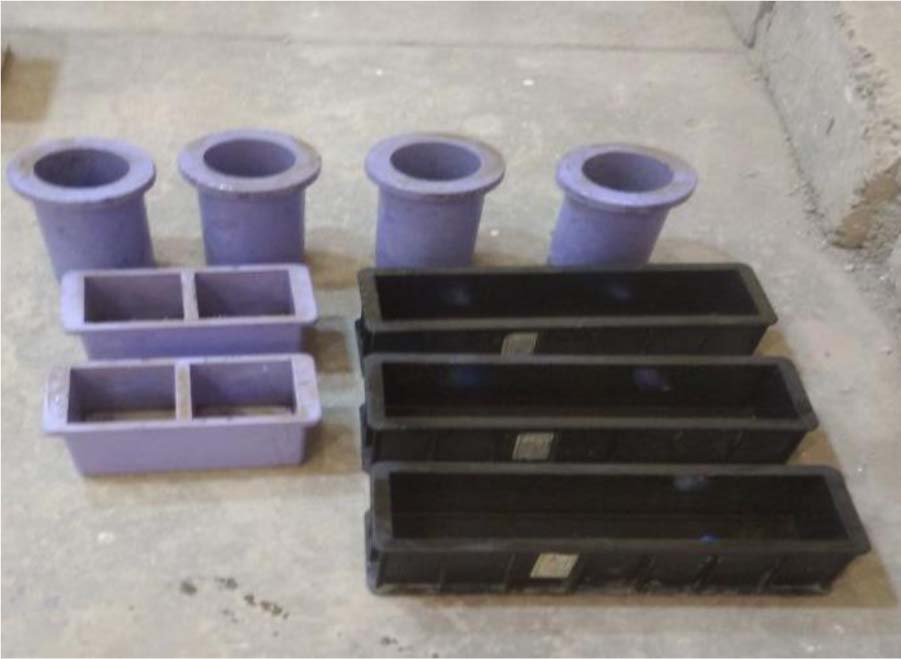
Figure 6:
Moulds used in this study
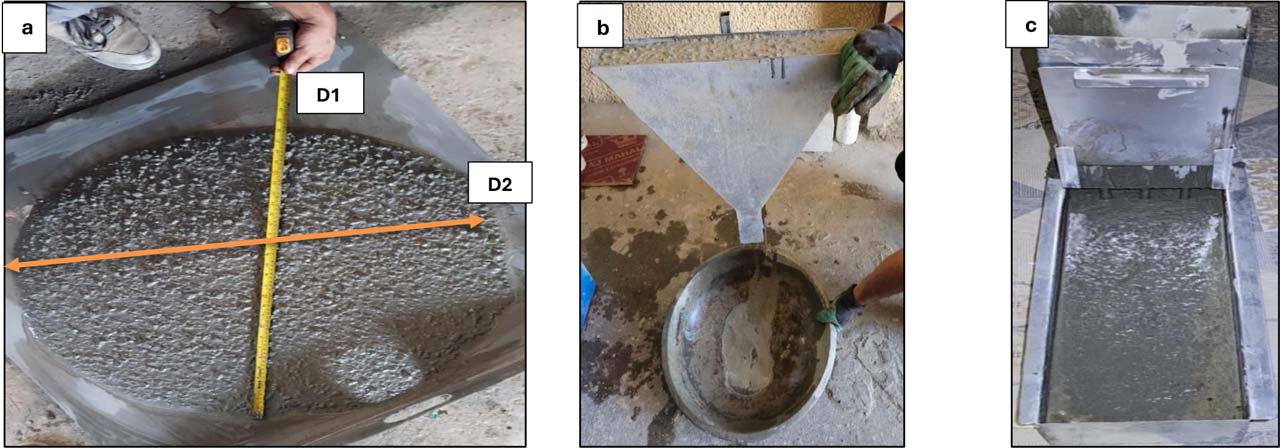
Figure 7:
Fresh test apparatus: (a) Slump flow ana T500mm, (b) V-funnel, and (c) L-box
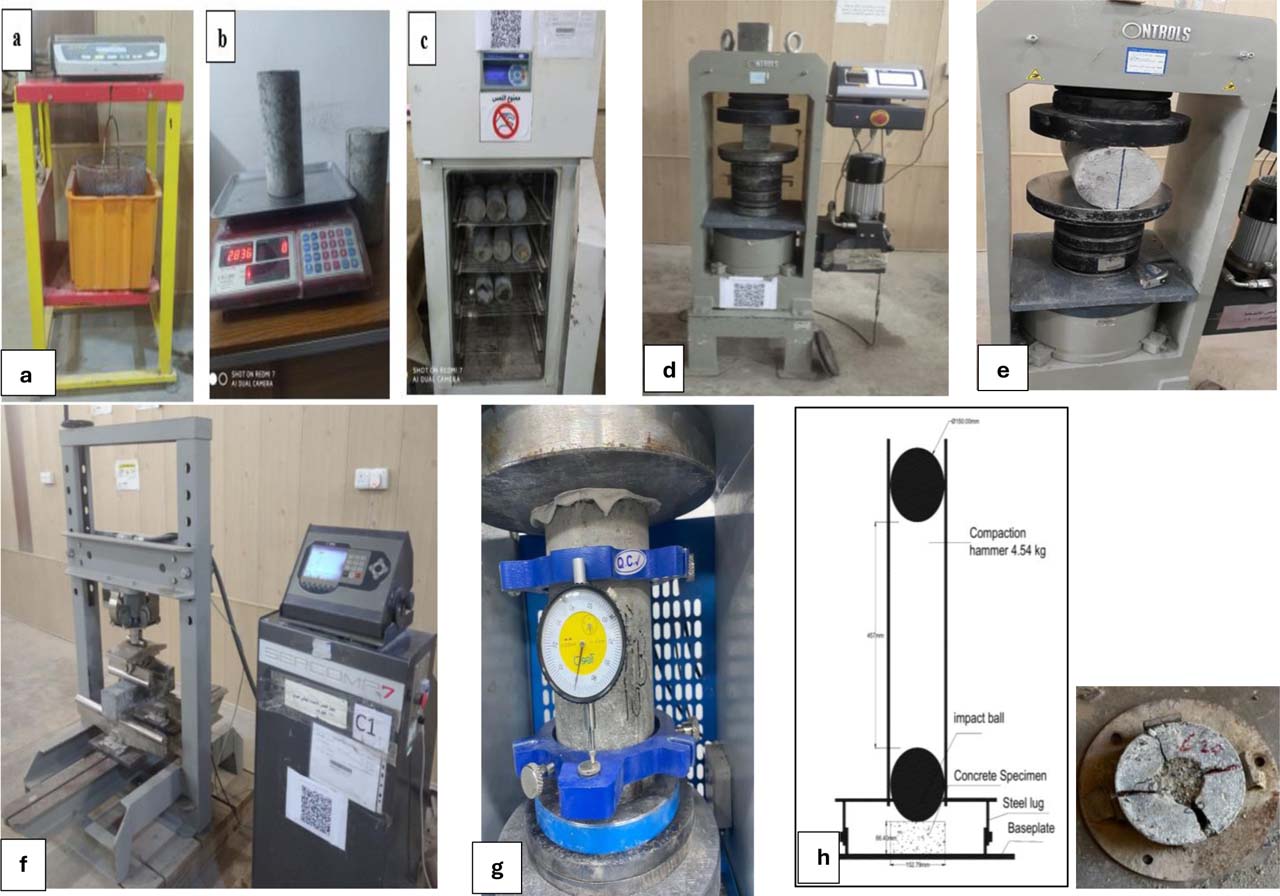
Figure 8:
Mechanical tests: (d) Compressive strength, (e) Splitting tensile strength, (f) Flexural strength, (g) Modulus of elasticity, and (h) Impact strength
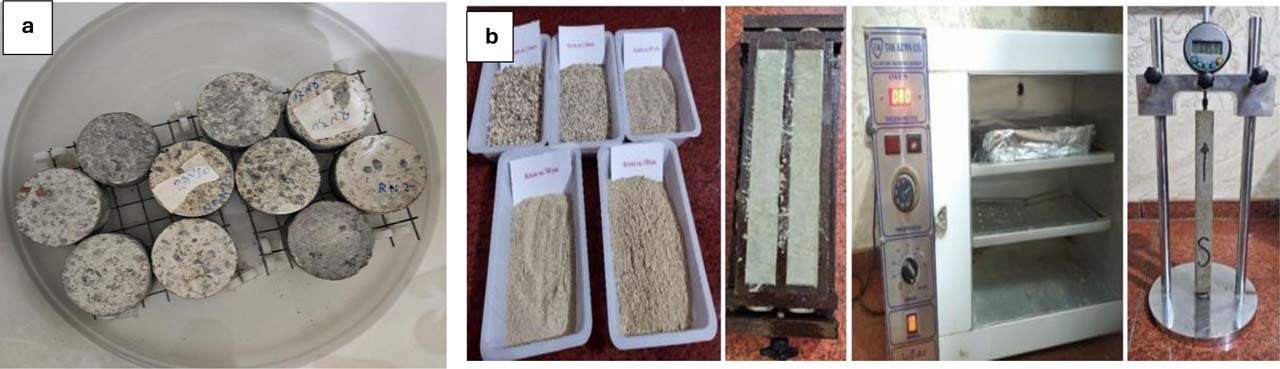
Figure 9:
Durability test setup: (a) Sorptivity, and (b) Alkali–silica reaction (ASR) expansion
Table 5:
Fresh properties of LWSCC mixtures
| Mix code | Fresh properties | |||||
|---|---|---|---|---|---|---|
| Slump [mm] | Sp% | T500 sec. | V-funnel sec. | L-box | Fresh density [Kg/m3] | |
| G0 | 720 | 1.40 | 2.83 | 7.6 | 0.95 | 1890 |
| GC10% | 720 | 1.37 | 2.80 | 7.7 | 0.96 | 1886 |
| GC20% | 725 | 1.35 | 2.74 | 7.9 | 0.98 | 1878 |
| GC30% | 715 | 1.42 | 2.90 | 7.7 | 0.93 | 1865 |
| GC40% | 700 | 1.45 | 3.66 | 7.5 | 0.90 | 1852 |
| GF10% | 715 | 1.43 | 2.94 | 7.8 | 0.96 | 1881 |
| GF20% | 705 | 1.48 | 3.10 | 8.0 | 0.94 | 1872 |
| GF30% | 697 | 1.52 | 3.22 | 8.2 | 0.92 | 1860 |
| GF40% | 685 | 1.57 | 3.28 | 8.7 | 0.89 | 1846 |
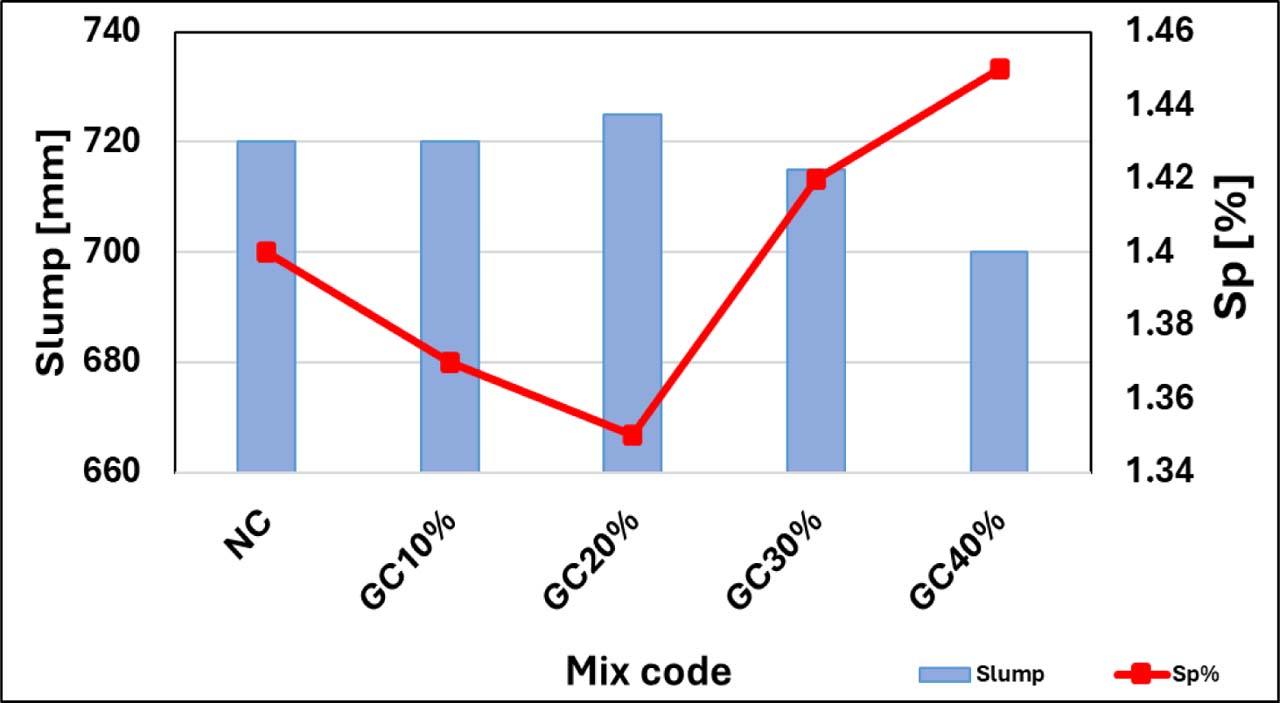
Figure 10:
Slump flow and Sp in GC mixtures
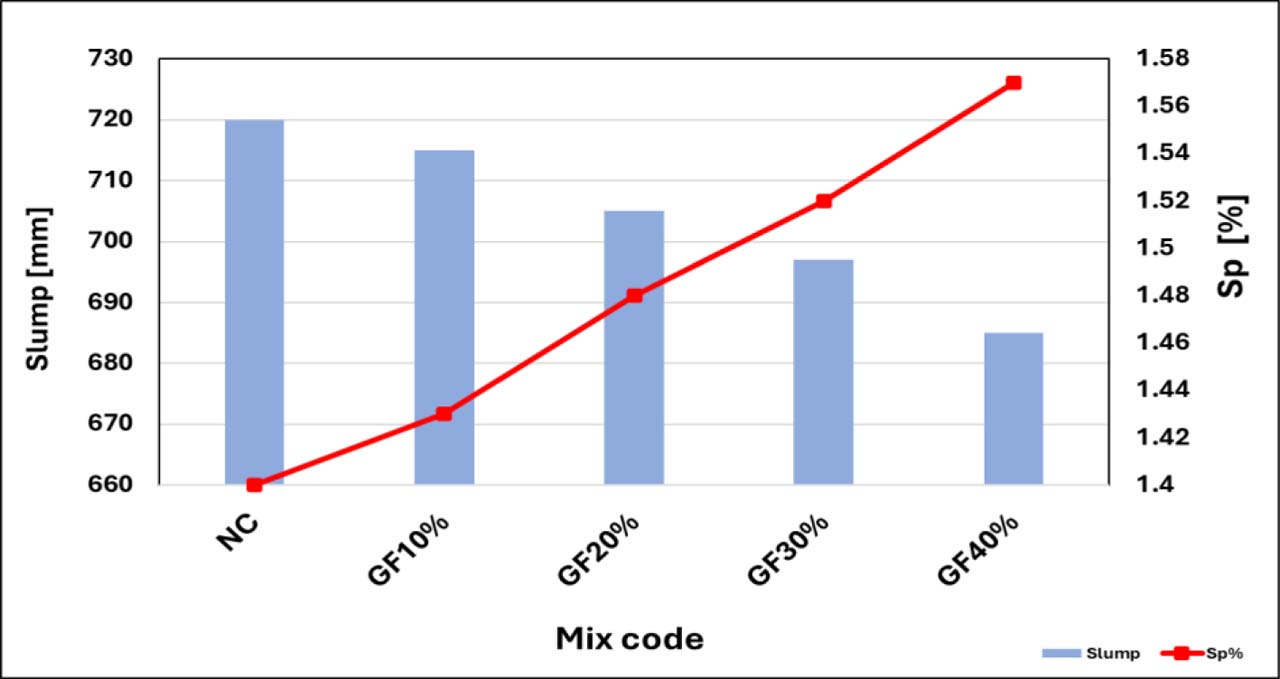
Figure 11:
Slump flow and Sp in GF mixtures
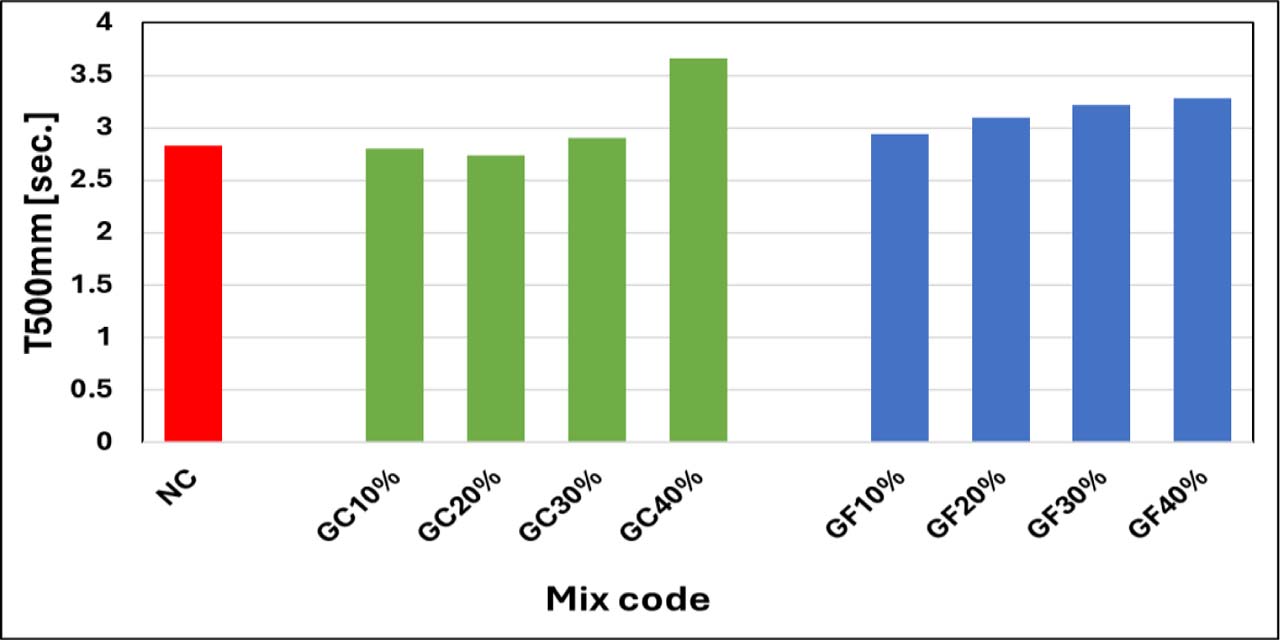
Figure 12:
T500mm results
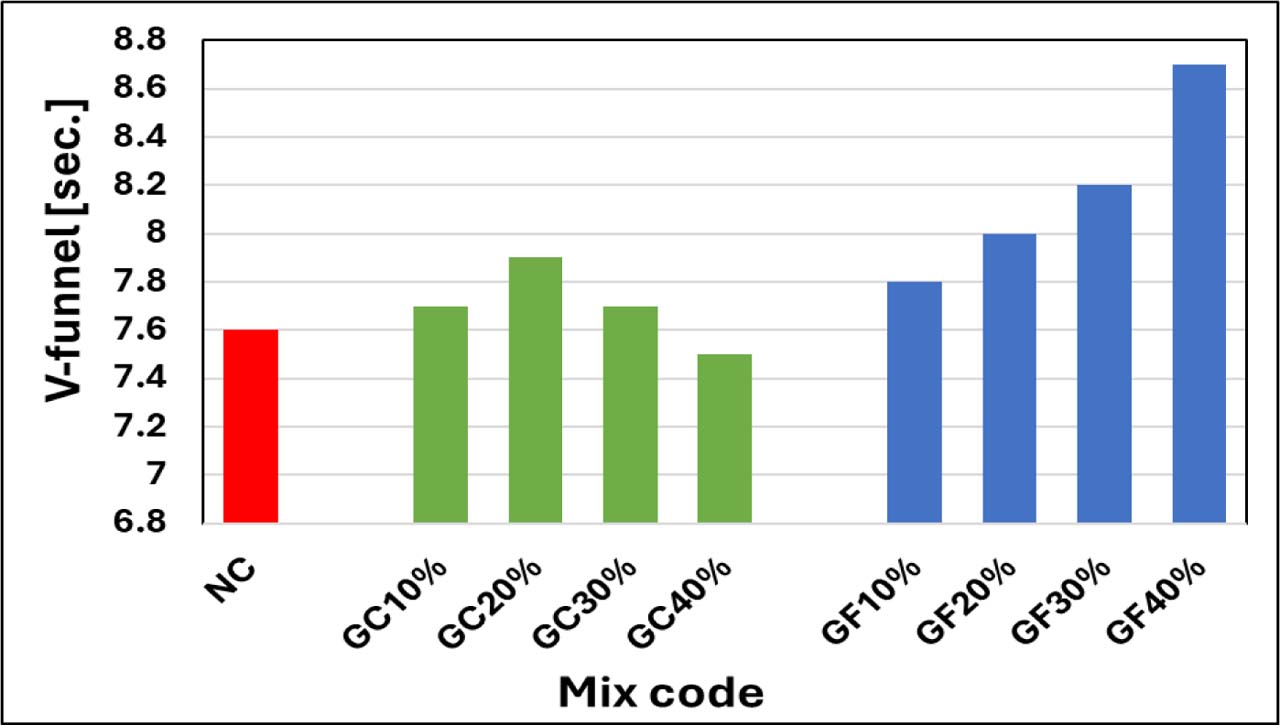
Figure 13:
Experimental results of v-funnel test
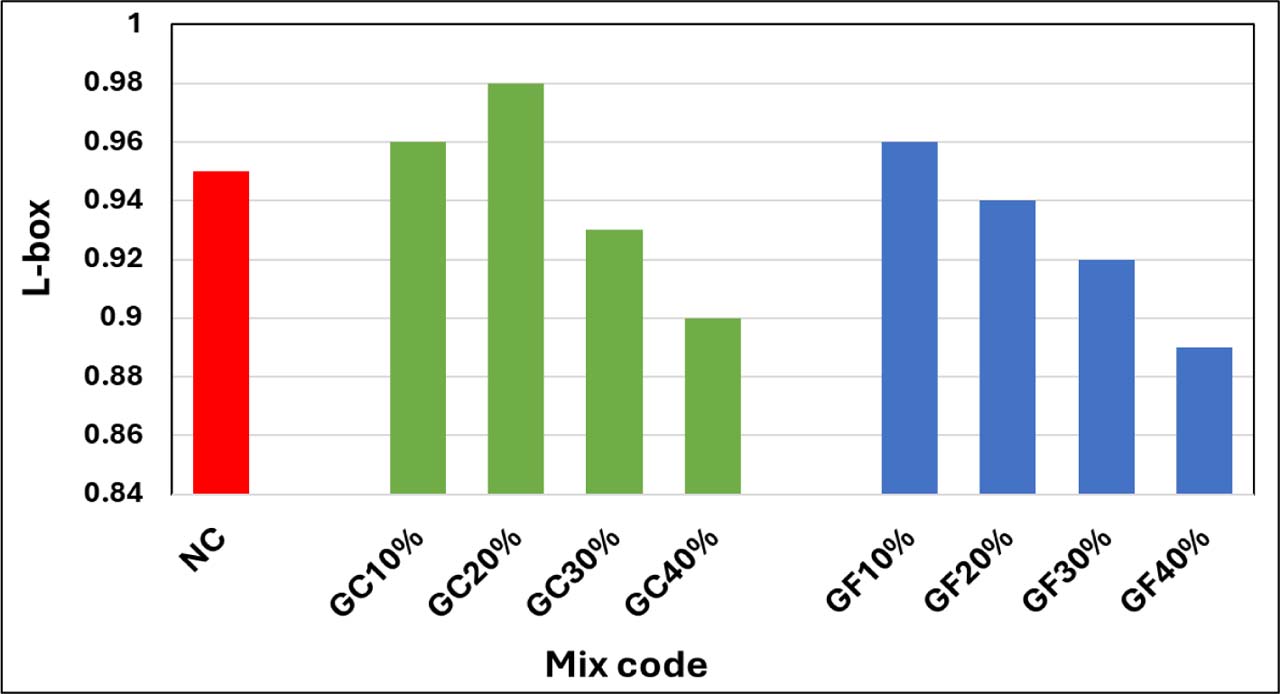
Figure 14:
Experimental results of L-Box test
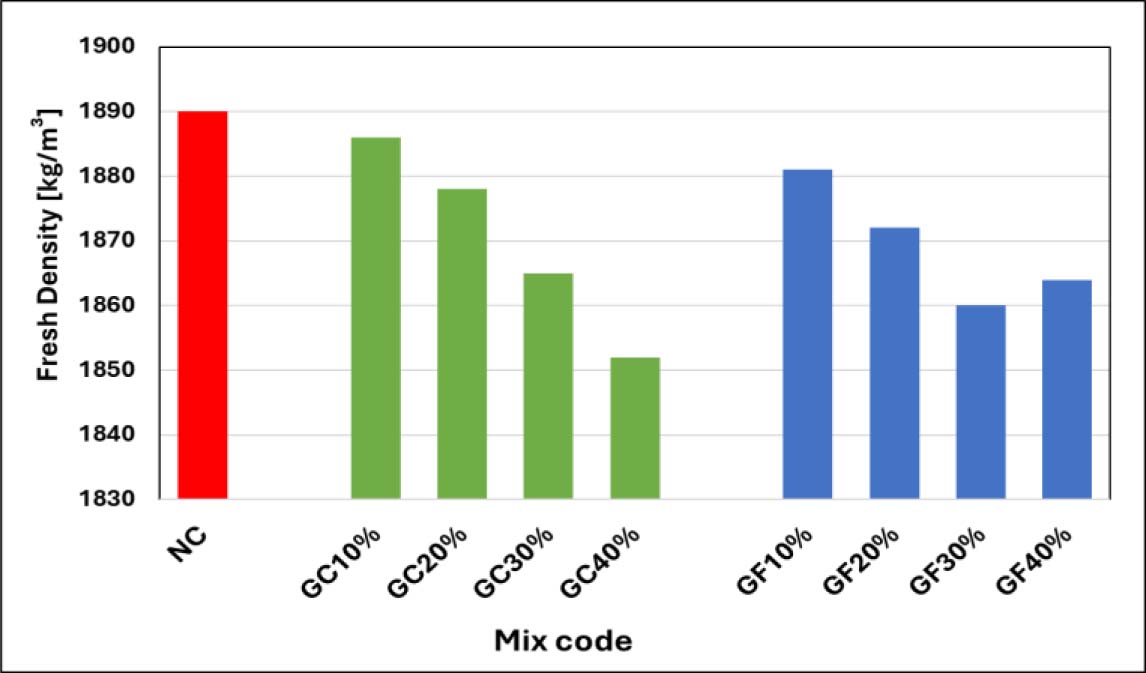
Figure 15:
Experimental results of fresh density test
Table 6:
Equilibrium density results
| Mix code | G0 | GC10 | GC20 | GC30 | GC40 | GF10 | GF20 | GF30 | GF40 |
|---|---|---|---|---|---|---|---|---|---|
| Equilibrium density [Kg/m3] | 1646 | 1637 | 1633 | 1626 | 1620 | 1633 | 1624 | 1619 | 1594 |
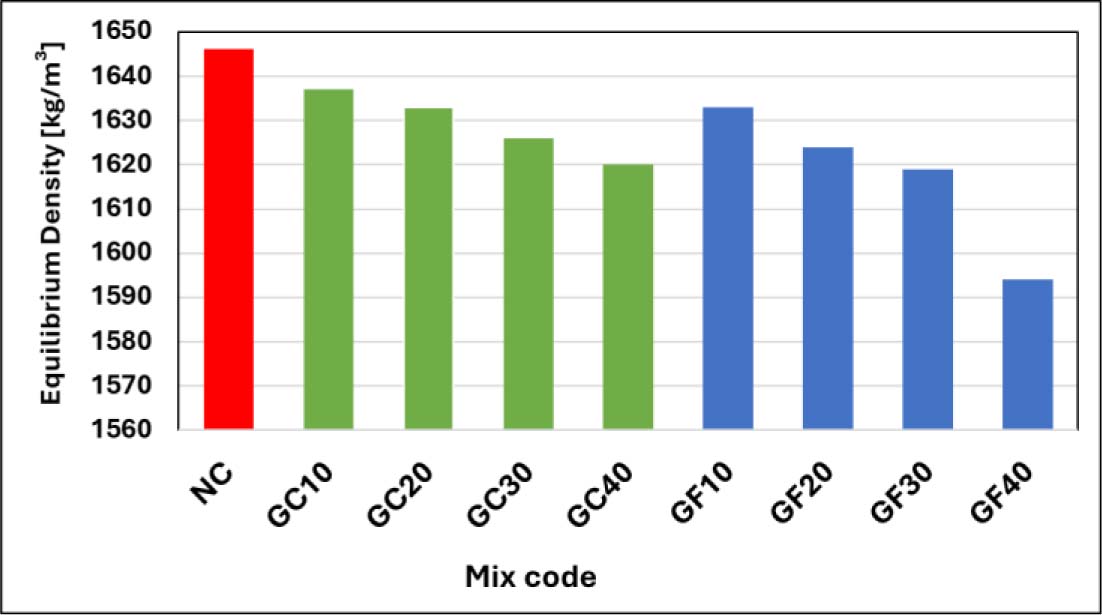
Figure 16:
Experimental results of equilibrium density test
Table 7:
Results of compressive strength at 7, 28 and 90 days
| Mix code | Compressive strength [MPa] | ||
|---|---|---|---|
| 7 d | 28 d | 90 d | |
| G0 | 25.11 | 30.03 | 32.63 |
| GC10 | 24.40 | 29.43 | 31.73 |
| GC20 | 23.89 | 28.67 | 31.15 |
| GC30 | 23.14 | 28.12 | 30.60 |
| GC40 | 22.51 | 27.44 | 29.72 |
| GF10 | 25.73 | 31.43 | 32.50 |
| GF20 | 25.93 | 32.21 | 33.18 |
| GF30 | 25.42 | 31.26 | 32.31 |
| GF40 | 24.78 | 30.07 | 31.61 |
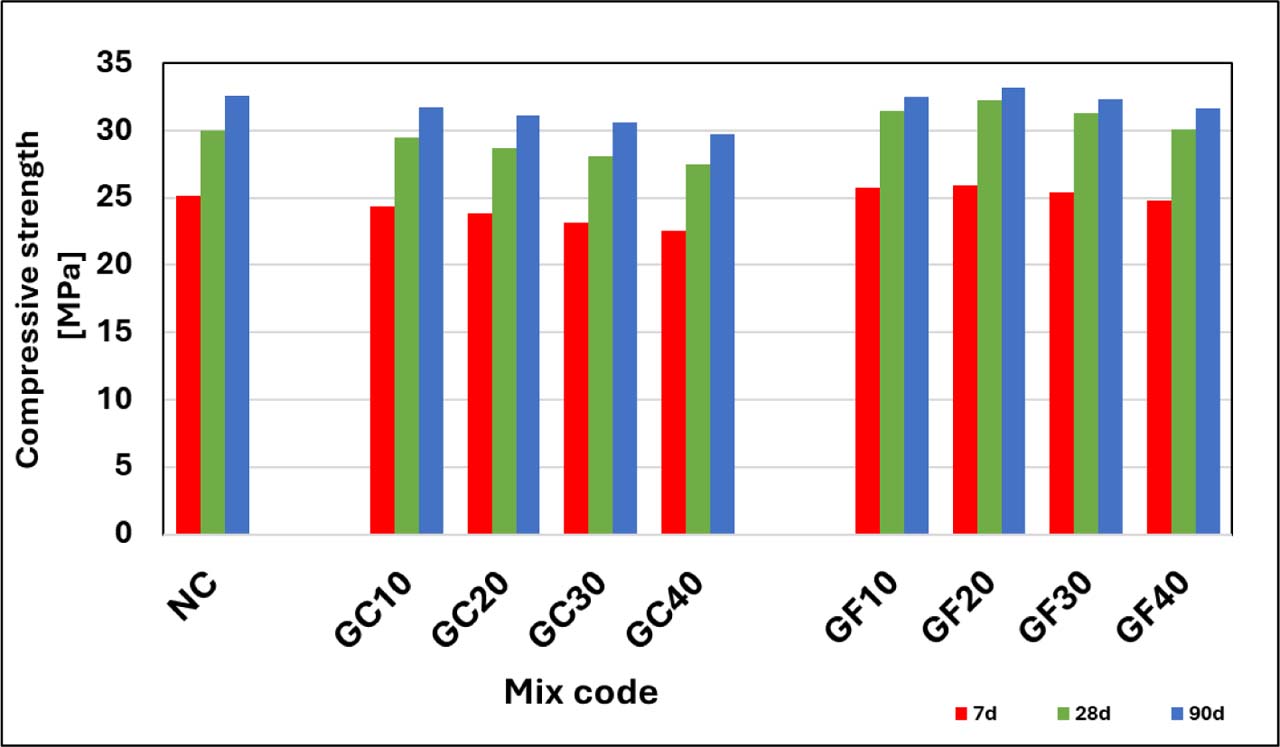
Figure 17:
Results of compressive strength at 7, 28 and 90 days
Table 8:
Results of splitting strength test
| Mix code | Splitting strength (MPa) | ||
|---|---|---|---|
| 7d | 28d | 90d | |
| G0 | 2.24 | 3.41 | 3.68 |
| GC10 | 2.21 | 3.30 | 3.62 |
| GC20 | 2.17 | 3.23 | 3.58 |
| GC30 | 2.01 | 3.14 | 3.51 |
| GC40 | 1.87 | 3.04 | 3.46 |
| GF10 | 2.27 | 3.53 | 3.77 |
| GF20 | 2.36 | 3.61 | 3.82 |
| GF30 | 2.21 | 3.48 | 3.71 |
| GF40 | 2.10 | 3.36 | 3.65 |
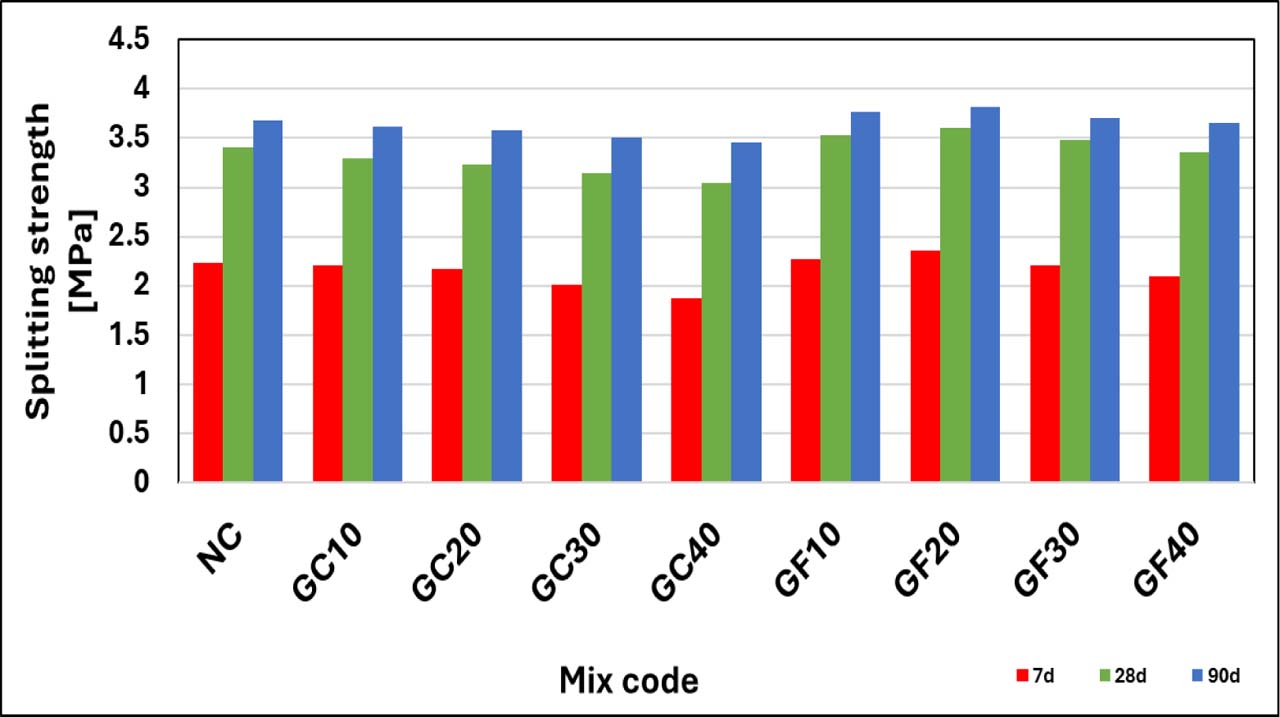
Figure 18:
Results of splitting strength test
Table 9:
Results of flexural strength test
| Mix code | Flexural strength [MPa] | ||
|---|---|---|---|
| 7 d | 28 d | 90 d | |
| G0 | 3.7 | 4.30 | 4.62 |
| GC10 | 3.68 | 4.12 | 4.52 |
| GC20 | 3.58 | 4.06 | 4.44 |
| GC30 | 3.44 | 3.91 | 4.31 |
| GC40 | 3.37 | 3.84 | 4.26 |
| GF10 | 3.96 | 4.58 | 4.71 |
| GF20 | 4.00 | 4.71 | 4.84 |
| GF30 | 3.66 | 4.27 | 4.55 |
| GF40 | 3.54 | 4.11 | 4.39 |
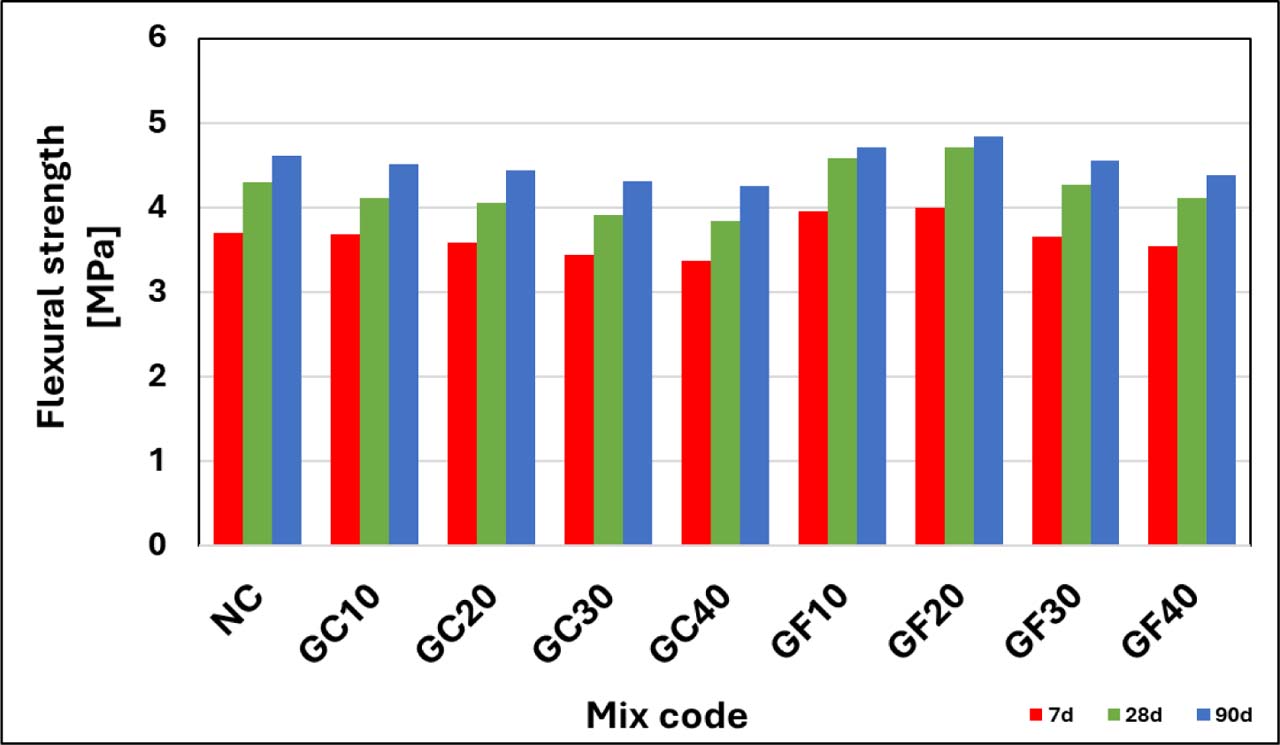
Figure 19:
Flexural strength results
Table 10:
Results of modulus of elasticity test
| Mix code | Modulus of elasticity (GPa) | |
|---|---|---|
| 28d | 90d | |
| G0 | 16.74 | 17.96 |
| GC10 | 16.22 | 17.35 |
| GC20 | 15.87 | 17.18 |
| GC30 | 15.42 | 16.76 |
| GC40 | 15.16 | 16.46 |
| GF10 | 17.62 | 17.82 |
| GF20 | 17.84 | 18.32 |
| GF30 | 17.31 | 17.87 |
| GF40 | 16.90 | 17.46 |
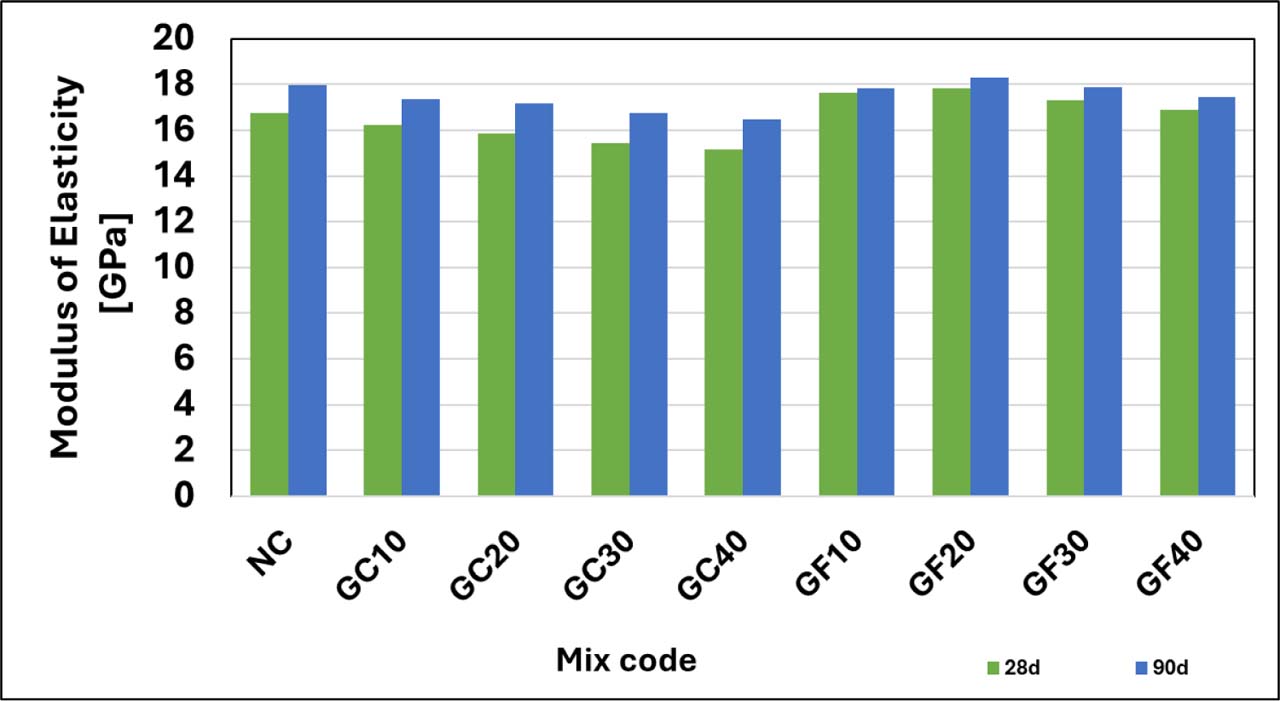
Figure 20:
Results of modulus of elasticity test
Table 11:
Results of the impact resistance test
| Mix code | Impact resistance (No. of blow) | |||||
|---|---|---|---|---|---|---|
| 7 days | 28 days | 90 days | ||||
| N1 | Nf | N1 | Nf | N1 | Nf | |
| NC | 7 | 12 | 16 | 24 | 26 | 33 |
| GC10 | 9 | 15 | 17 | 24 | 25 | 35 |
| GC20 | 9 | 12 | 15 | 22 | 23 | 33 |
| GC30 | 6 | 10 | 14 | 19 | 22 | 31 |
| GC40 | 6 | 8 | 14 | 17 | 21 | 29 |
| GF10 | 6 | 15 | 19 | 28 | 30 | 38 |
| GF20 | 9 | 12 | 21 | 30 | 33 | 42 |
| GF30 | 12 | 16 | 20 | 28 | 31 | 38 |
| GF40 | 12 | 21 | 24 | 30 | 32 | 37 |
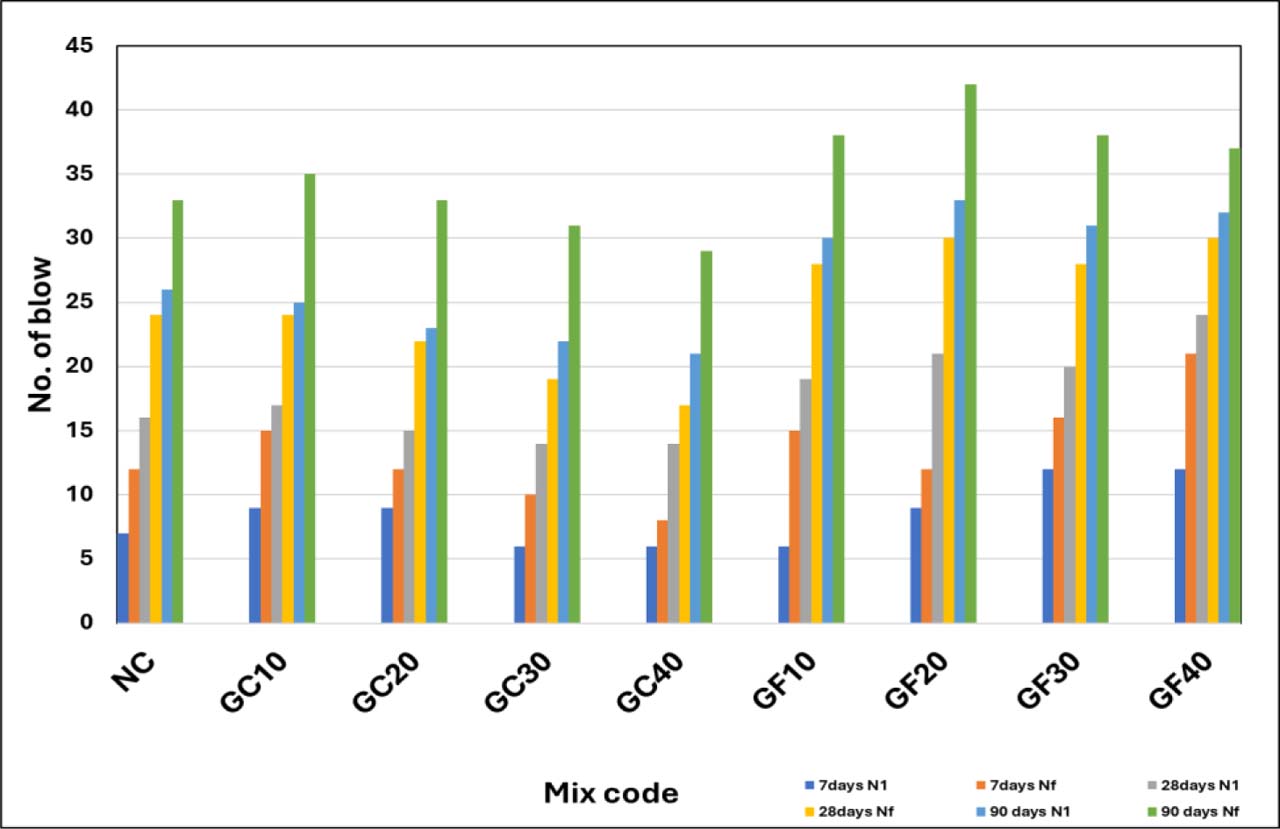
Figure 21:
Results of impact resistance test
Table 12:
Results of water absorption test
| Mix code | Water absorption [%] | ||
|---|---|---|---|
| 7 d | 28 d | 90 d | |
| G0 | 9.26 | 8.29 | 7.32 |
| GC10 | 9.48 | 8.41 | 7.47 |
| GC20 | 9.82 | 8.86 | 7.68 |
| GC30 | 9.39 | 9.11 | 7.94 |
| GC40 | 9.77 | 9.56 | 8.22 |
| GF10 | 8.65 | 7.92 | 7.12 |
| GF20 | 8.37 | 7.8 | 7.04 |
| GF30 | 8.89 | 8.11 | 7.26 |
| GF40 | 9.14 | 8.46 | 7.41 |
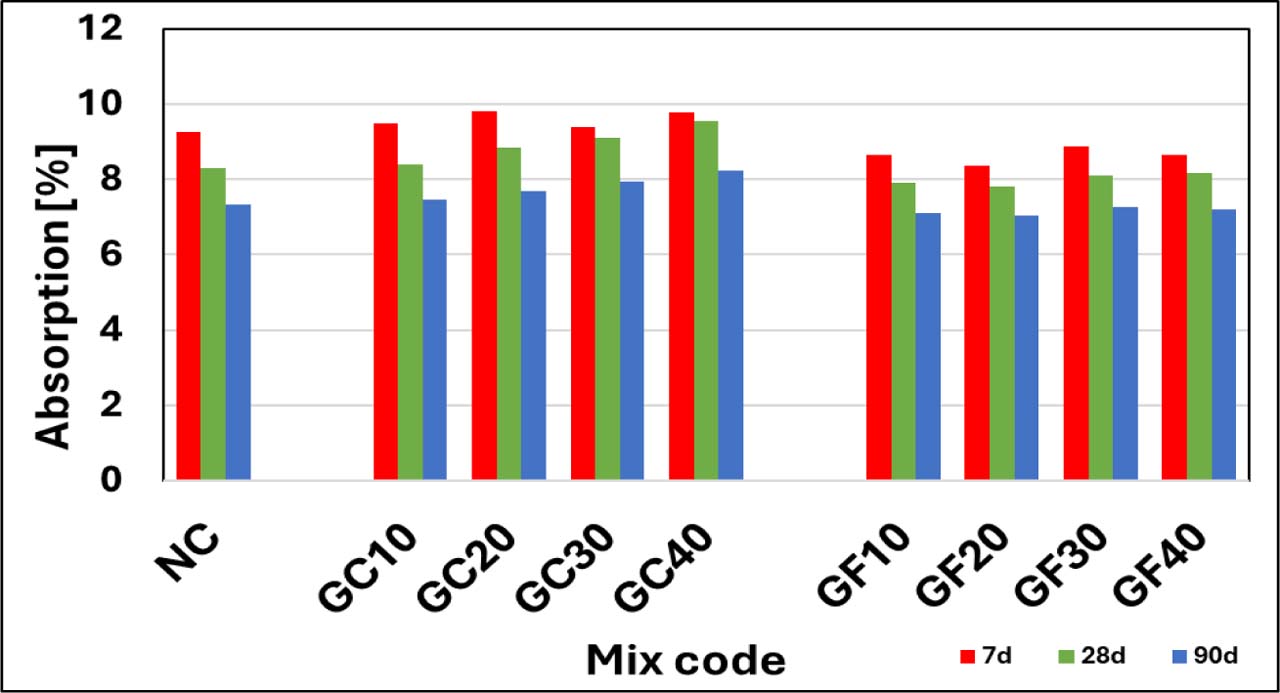
Figure 22:
Results of water absorption test
Table 13:
Results of sorptivity test
| Mix code | Sorptivity [mm\sec0.5] | ||
|---|---|---|---|
| 7 d | 28 d | 90 d | |
| G0 | 0.068 | 0.052 | 0.046 |
| GC10 | 0.073 | 0.057 | 0.053 |
| GC20 | 0.079 | 0.062 | 0.057 |
| GC30 | 0.083 | 0.073 | 0.061 |
| GC40 | 0.087 | 0.078 | 0.064 |
| GF10 | 0.064 | 0.048 | 0.041 |
| GF20 | 0.061 | 0.046 | 0.038 |
| GF30 | 0.068 | 0.052 | 0.045 |
| GF40 | 0.071 | 0.057 | 0.053 |
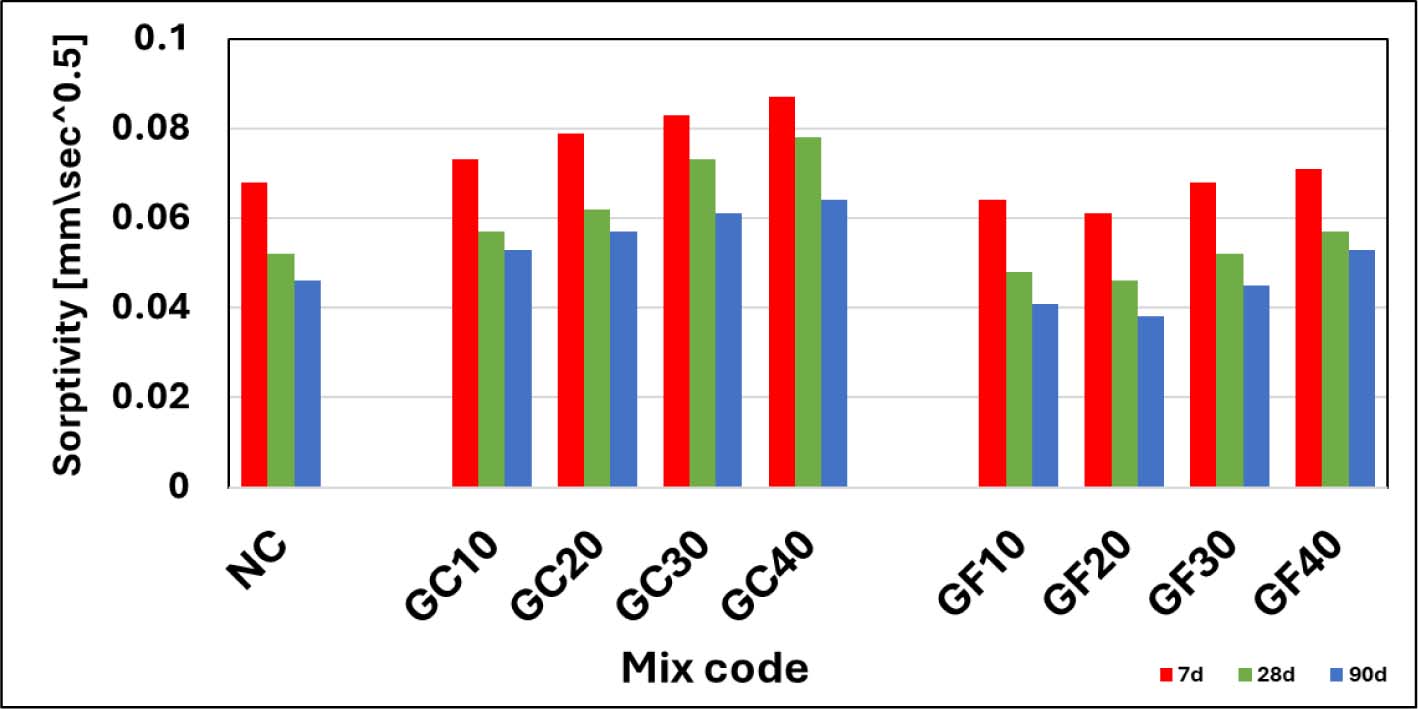
Figure 23:
Results of sorptivity test
Table 14:
Alkali-silica reaction test
| Mix code | G0 | GC10 | GC20 | GC30 | GC40 | GF10 | GF20 | GF30 | GF40 |
|---|---|---|---|---|---|---|---|---|---|
| Expansion % | 0.24 | 0.23 | 0.20 | 0.17 | 0.14 | 0.21 | 0.18 | 0.15 | 0.13 |
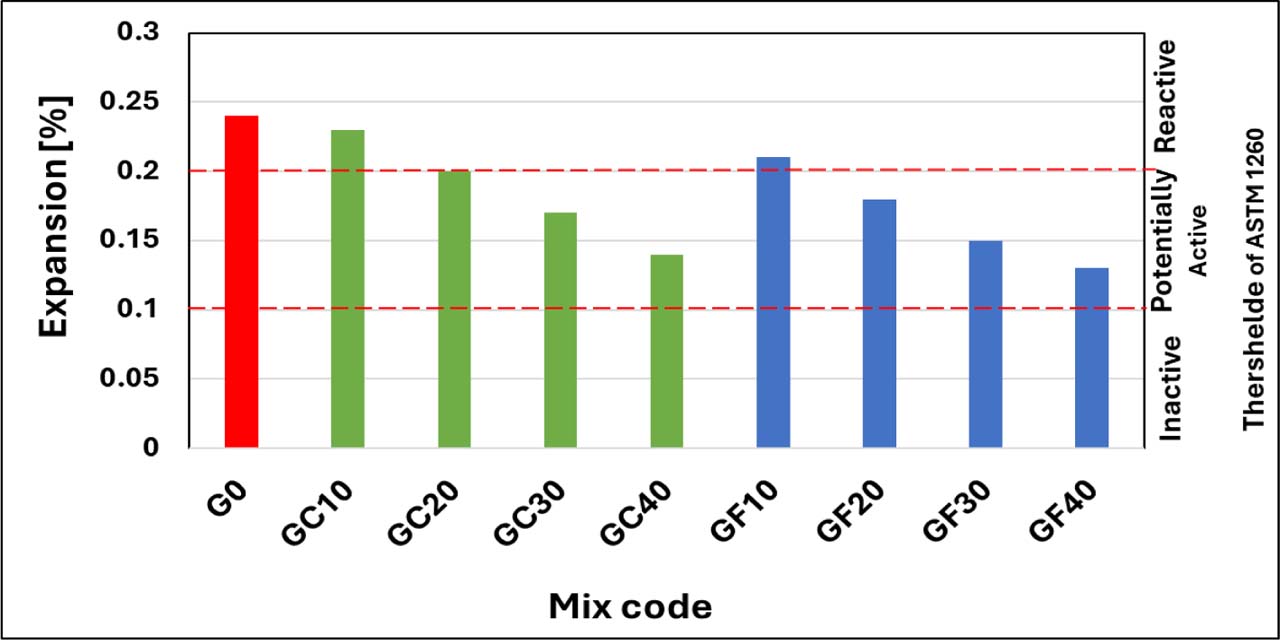
Figure 24:
Results of alkali-silica reaction test with ASTM 1260 limits
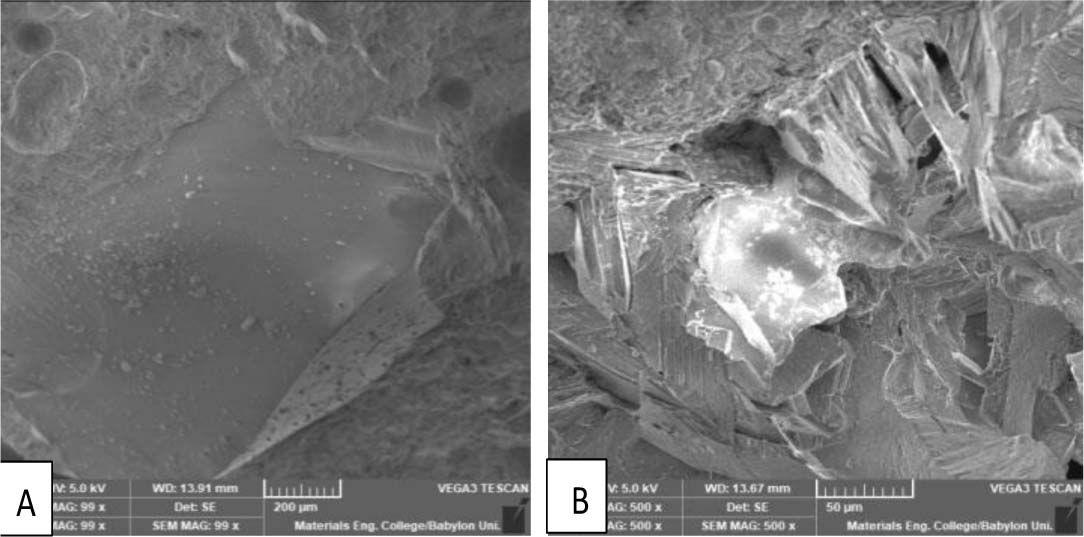
Figure 25:
SEM of LWSCC with coarse glass (GC mixture)
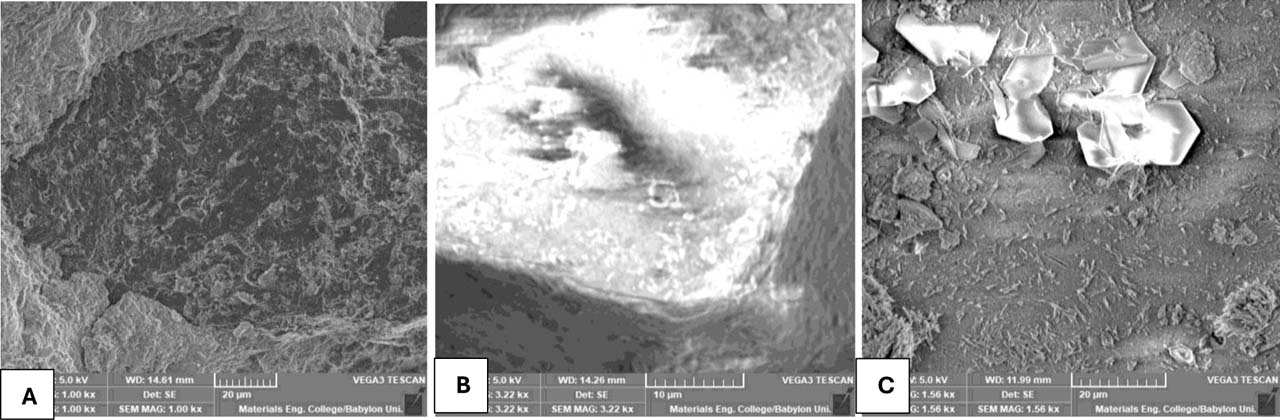
Figure 26:
SEM of LWSCC with fine glass (GF mixture)