

1. Introduction
In recent years, LWSCC has obtained extensive interest in construction applications because it combines lightweight properties with high flowability, without need for mechanical vibration. When using lightweight aggregates, concrete with a density lower than 2000 kg/m3 can be achieve, have many benefits such as improved thermal insulation, reduced dead load, and sustainability. However, lightweight aggregates characterize by its porous nature that leads to decreases in mechanical strength and durability, which the addition of supplementary materials were important to improve its performance (Omran, 2024). Globally, waste glass constitutes a major environmental challenge, with millions of tons produced annually from packaging, construction activities, and consumer products. glass is non-biodegradable and can remain in landfills indefinitely. However, its composition, which is rich in amorphous silica, makes it a hopeful candidate for use in construction purposes (Tariq, 2016). In recent decades, the construction industry has increasingly shifted toward sustainable materials and eco-friendly technologies to mitigate environmental impacts associated with conventional concrete production. Among these, the utilization of industrial waste materials such as waste glass has gained significant attention due to its abundance, non-biodegradable nature, and potential for recycling into value-added construction materials. Waste glass, when processed into suitable particle sizes, can be effectively incorporated as a fine aggregate replacement in concrete, contributing to both environmental sustainability and resource conservation (Bhat et al., 2024; Lopez & El-Fata, 2024).
Previous studies have displayed that the combination of waste glass as a partial replacement for fine aggregate in concrete and its impact on mechanical and durability properties. (Jamellodin et al., 2022) examined the influence of natural fine aggregate replacement by glass waste have particle size less than 5mm at replacement ratios of 5%, 10%, 15%, 20%, and 25% on the mechanical and durability properties of concrete with concrete grade 30 MPa at curing ages at 7th and 28th days. Also, scanning electron microscopy (SEM) analysis was conducted to characterize the microstructural morphology of the mixtures. The results indicated that the best compressive strength was attained at a 15% replacement ratio. furthermore, durability performance was enhanced by the inclusion of waste glass, as evidenced by a reduction in the water permeability coefficient at 5% replacement, compared with the reference mixture. The results display that glass waste at low replacement levels of enhance both strength and durability characteristics of concrete. Furthermore, (Jahami et al., 2022) investigates the possibility of production of high-strength concrete by partially replacing fine aggregates with waste glass sand (WGS) with replacement percentages of (0%, 25%, 50%, and 75%) have a maximum particle size 600µ. Results showed that the improvement in workability of concrete when increased the percentage of WGS. Also, significant improvements were noted in mechanical properties involving compressive strength, modulus of elasticity, and splitting tensile strength, especially at higher replacement levels, indicating the effectiveness of waste glass in improving concrete performance under optimized condition. In line with these findings, (Subba et al., 2023) This study investigates the effects of crushed waste glass on concrete properties that is workability, water absorption, compressive strength, and flexural strength. The investigation involved replacement levels of 0%, 10%, 20%, and 30%, with glass particles size passing 4.5 mm and retained on 1.2 mm sieves and considered curing ages of 7 and 28 days. The results showed that the inclusion of waste glass improved workability and reduced water absorption. Moreover, compressive and flexural strengths increased at lower replacement percentages, while higher replacement percentages led to a decrease in strength, which was attributed to the potential occurrence of alkali–silica reaction and the deterioration of bonding within the concrete matrix. Similarity, (Bhat et al., 2024) investigated the incorporation of waste glass as a replacement for both fine and coarse aggregates in concrete at replacement ratios ranging from 0% to 25% by weight. The study showed that the smooth surface texture of glass particles improved the workability of concrete mixtures whereas slightly reducing density. Generally, mechanical performance, improvements were noted at replacement levels (10–15%), where compressive strength increased compared to the control mixture. However, at higher replacement levels, reductions in flexural and tensile strengths were reported, mainly due to the interfacial bonding between glass particles and the cement matrix was weaker. Also, the waste glass leads to denser microstructure that reduced water absorption and improved resistance to permeability. Also, (Hakim et al., 2024) presented a comprehensive review about the use of waste glass as a partial replacement for fine aggregate in concrete, to improve sustainability and reduce environmental impact. The research emphasizes that incorporating waste glass can reduce the consumption of natural resources, lower carbon emissions, and offer an actual solution for waste management. The results indicate that the performance of concrete containing waste glass powder depends mainly on particle size, replacement ratios, and concrete mix design. (10–20%) replacement ratios can improve mechanical properties due to pozzolanic activity for waste glass powder and improved packing of concrete. But at higher replacement levels may lead of reduction in the workability and strength due to weaker bonding and changes in microstructure. The inclusion of waste glass powder increases resistance to permeability, chloride penetration, sulphate attack, and alkali–silica reaction, thus improving the long-term performance of concrete. The review also highlights that proper processing, grading, and the use of admixtures are important to achieve optimal performance. So, (Tong et al., 2024) explore the effect of waste glass particle sizes on the mechanical and durability properties of concrete. The findings confirmed that combining an optimal proportion of glass sand can significantly improve the mechanical properties and durability of concrete. However, higher replacement levels or the use of coarser glass particles may negatively affect performance. The pozzolanic activity of glass powder plays a key role in improving concrete behaviour, although the replacement ratio should not exceed 20%. When using a composite particle size distribution, notable improvements were observed, with compressive, tensile, and shear strengths increasing by 35.56%, 21.74%, and 13.79%, respectively. Durability was also enhanced, as evidenced by a 20.73% reduction in water absorption and a 63.10% decrease in chloride ion permeability. On other hand, (Kirane et al., 2025) showed that the particle size of glass waste significantly influences the performance of self-compacting concrete. Finer glass particles exhibit pronounced pozzolanic activity, which enhances compressive strength and reduces permeability. Conversely, coarser glass aggregates may contribute to workability improvement but can also increase expansion risks associated with ASR. Research by (AJAYE et al., 2025) investigated crushed glass waste passing sieve sizes 4.75 mm to 0.075 mm were added as partial replacement for fine aggregate in self-compacting high-strength concrete at replacement levels ranging from 5% to 30%. Their results indicated that replacement levels up to 20% maintained satisfactory workability, with all specimens exceeding the minimum slump flow criteria of 650 mm established by EFNARC guidelines. However, replacement above 20% led to increased slump flow times (5.1 to 5.2 seconds), indicating a slight decrease in workability. The V-funnel flow times (7.2 to 11.6 seconds) and L-box ratios (0.92 to 0.99) remained within EFNARC requirements, demonstrating that properly graded glass waste can be effectively incorporated without compromising fresh properties. This study aims to investigate the effect of recycled waste-glass particle size and fine-aggregate replacement levels on the fresh, mechanical, and microstructural properties of lightweight self-compacting concrete incorporating waste glass and treated attapulgite lightweight aggregate. Two waste-glass fractions, coarse glass (4.75–1.18 mm) and fine glass (<1.18 mm), were investigated at different replacement levels to determine their influence on concrete performance and identify the most effective particle size and replacement level. Treated attapulgite was used as the lightweight coarse aggregate in all mixtures.
1.1. Significance of the Study
This study investigates the influence of recycled waste glass particle size and replacement level on the fresh, mechanical, and durability properties of lightweight self-compacting concrete (LWSCC), while helping the sustainable consumption of recycled materials. Recycled waste glass has been extensively investigated in conventional concrete, its application in LWSCC remains limited. Moreover, previous studies have rarely evaluated coarse and fine recycled waste glass separately over a range of replacement levels to determine their individual effects and best replacement ratios. This study addresses this research gap by systematically comparing coarse and fine recycled waste glass at different replacement levels. In addition, the combined use of recycled waste glass with treated attapulgite by cement paste as lightweight aggregate has received very limited attention. Therefore, the findings of this study provide valuable guidance for optimizing sustainable LWSCC mixtures with improved engineering performance.
2. Methodology
2.1. Research Design
This study adopted an experimental research design to investigate the influence of recycled waste glass particle size and replacement level on the performance of sustainable lightweight self-compacting concrete (LWSCC). Recycled waste glass was used as a partial replacement for natural fine aggregate in two particle size ranges: coarse glass (4.75–1.18 mm) and fine glass (<1.18 mm). Each particle size was incorporated at replacement levels of 10%, 20%, 30%, and 40% by mass of fine aggregate, in addition to a control mixture without glass replacement. A total of nine concrete mixtures were prepared, including one control mixture, four coarse-glass mixtures (GC10–GC40), and four fine-glass mixtures (GF10–GF40). All mixtures were produced using the same cementitious materials, water-to-binder ratio, and lightweight aggregate, but for each mixture the superplasticizer dosage was adjusted to ensure that all LWSCC mixtures remained within the acceptable limits of (EFNARC, 2005). Therefore, the particle size and replacement level were the only experimental variables.
The experimental program included the evaluation of fresh properties (slump flow, T500, V-funnel, L-box, and fresh density), mechanical properties (equilibrium density, compressive strength, splitting tensile strength, flexural strength, modulus of elasticity, and impact resistance), and durability properties (sorptivity, water absorption, and alkali–silica reaction expansion). The obtained results were analyzed to identify the optimum particle size and replacement level capable of providing the best balance between fresh performance, mechanical strength, durability, and sustainability in LWSCC.
2.2. Materials and Procedures
2.2.1. Portland Cement
In the current study, Ordinary Portland Cement known by Al Mass was applied. This cement meets the Iraq specification IQS NO.5-2019. The cement is produced by (AL-Mass Company) in the north of Iraq (Kurdistan region). Table 1 shows the chemical analysis and physical test.
Table 1:
Chemical analysis (according to IQS No.472/2019)
| Oxide % | Ordinary Portland cement (OPC) | Limits IQS No. |
|---|---|---|
| CaO | 60.41 | - |
| Si2O | 21.84 | - |
| AL2O3 | 4.72 | - |
| Fe2O3 | 3.60 | - |
| MgO | 1.50 | ≤5% |
| SO3 | 2.38 | ≤2.5% if C3A < 5% or ≤ 2.8% if C3A >5% |
| L.O.I | 3.27 | ≤4% |
| Free lime % | 1.12 | - |
| Insoluble residue % | 1.12 | ≤1.5% |
| L.S.F | 0.83 | 0.66–1.02 |
| Compounds | ||
| C3S % | 31.74 | - |
| C2S % | 38.67 | - |
| C3A % | 6.42 | - |
| C4AF % | 10.95 | - |
| Initial setting time (hour: min.) | 2.08 | 00:45 (Min.) |
| Final setting time (hour: min.) | 4:30 | 10:00 (Max.) |
| Fineness (Blaine) in m2/kg | 425 | 230 (Min.) |
| Compressive strength (MPa) at 3 days / 7days | 16 / 23 | 15 (Min.) / 23 (Min.) |
2.2.2. Fine Aggregate
All LWSCC mixes design by using natural fine aggregate obtained from the Al-Ekhaider region. The physical properties of sand were specific gravity 2.64, water absorption 2% and sulphate content 0.344. The grading curve of the applied sand are given in Figure 1, according to Iraqi Specifications No. 45/1984, the used sand is in zone II.
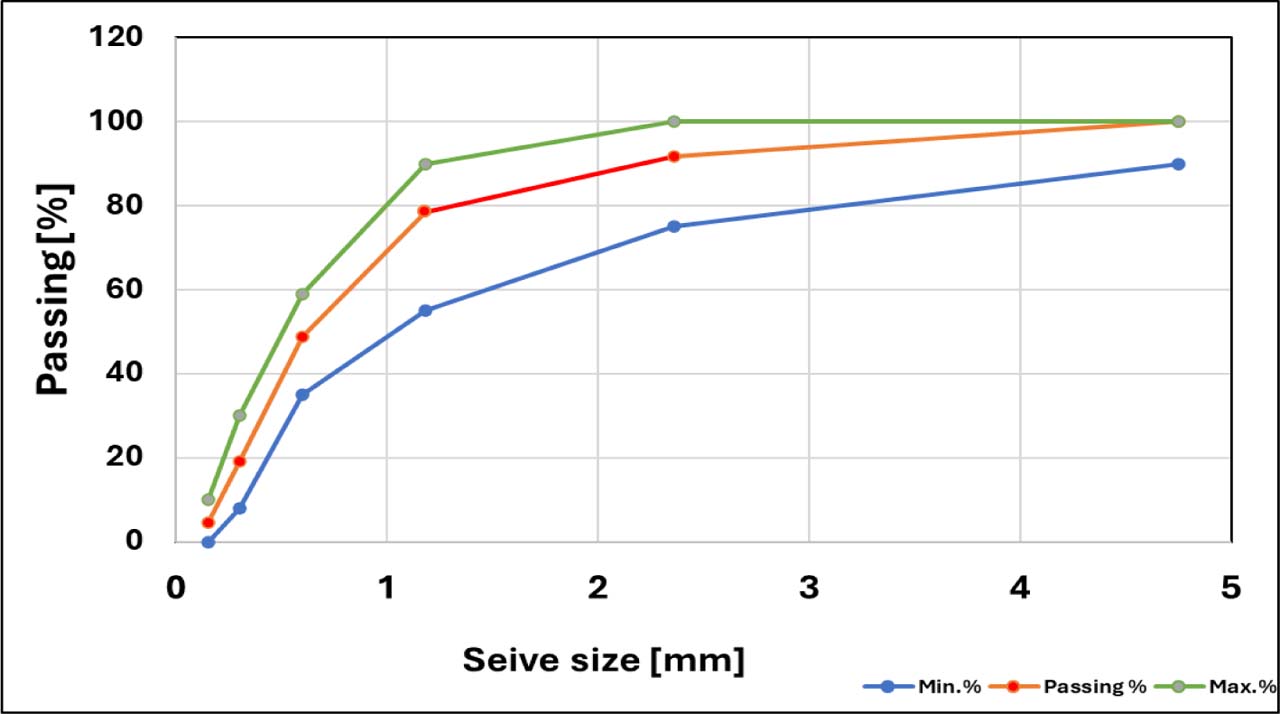
Figure 1:
Grading of sand
2.2.3. Recycled Waste Glass
The waste glass is collected from landfill juice bottles and waste windows glass, then washing it by water tap to remove impurities such as dust, labels, and juice contaminants. The cleaned glass is left to air-dry under ambient conditions to remove any excess moisture. The dried glass was crushed in the loss Angeles apparatus then sieved into two distinct fractions based on particle size. The first fraction, referred to as coarse glass, consisted of particles passing the 4.75 mm sieve and retained on the 1.18 mm sieve. The second fraction, referred to as fine glass, consisted of particles passing the 1.18 mm sieve as shown in the Figure 2. both types were stored in containers to prevent moisture absorption prior to mixing. The prepared glass materials were used as partial replacements for natural sand at specified replacement ratios (10, 20, 30 and, 40) % in the concrete mixture. The chemical analysis of the waste glass used in this study were illustrated in Table 2.
Table 2:
Chemical analysis of glass
| Oxides | SiO2 | MgO | CaO | Al2O3 | Fe2O3 | Na2O | SO3 | CuO | ZnO |
|---|---|---|---|---|---|---|---|---|---|
| Oxides content (Wt.%) | 72.5 | 3.72 | 10.2 | 0.70 | 0.31 | 9.9 | 0.244 | 0.227 | 0.133 |
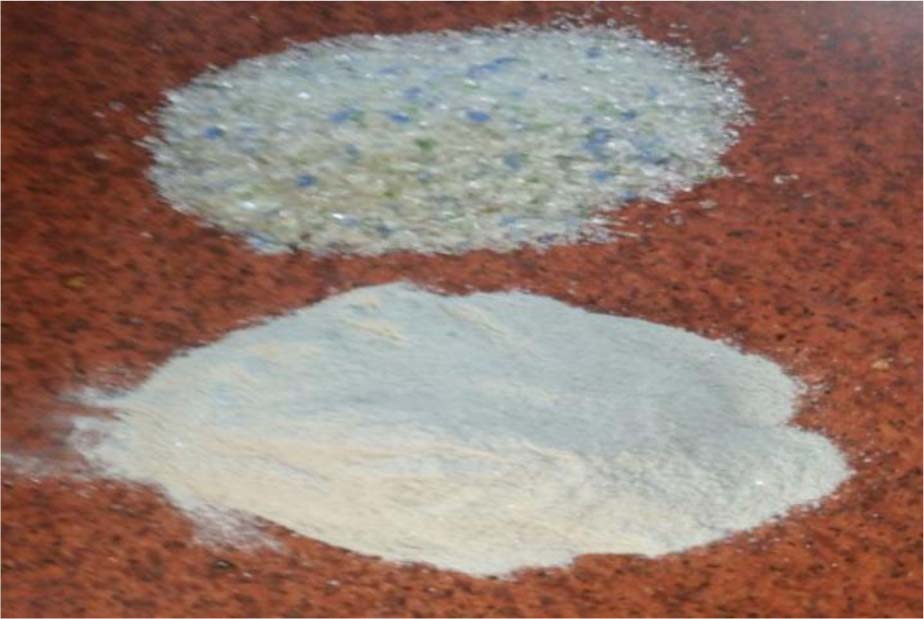
Figure 2:
Coarse and fine glass
2.2.4. Supplementary Cementitious Materials (Fly Ash and Limestone Powder)
Class F fly ash and limestone powder (LP) were utilized as supplementary cementitious materials in this study to improve the performance of LWSCC. The fly ash conforms with ASTM C 618 requirements.
Limestone powder, locally known as Al-Ghubra, was used as a filler material to increase the cohesiveness and improve particle packing of the mixture, Its high calcium oxide (CaO). Table 3 show the chemical analysis of fly ash type F and limestone powder.
2.2.5. Super-plasticizer
Superplasticizer (Sp) (high-range water-reducing admixture), commercially known as Master Glenium® 54, was used to achieve the required workability. It is based on modified polycarboxylate ether and complies with ASTM C494 Type F. The chemical admixture properties are white-like to straw coloured liquid form, relative density 1.07 and PH 5–8.
2.2.6. Attapulgite Aggregate
Attapulgite lightweight aggregate as shown in the Figure 3 was employed as coarse aggregate in this study. Attapulgite study from the Al-Najaf region the aggregate was obtained. Attapulgite aggregate particle size distribution within the range of 5–14 mm to conforms to BS EN 882:1992, it has a dry unit weight of 866 kg/m3, water absorption of 26%, and specific gravity of 1.54, the grading of LWA in Figure 4 below:
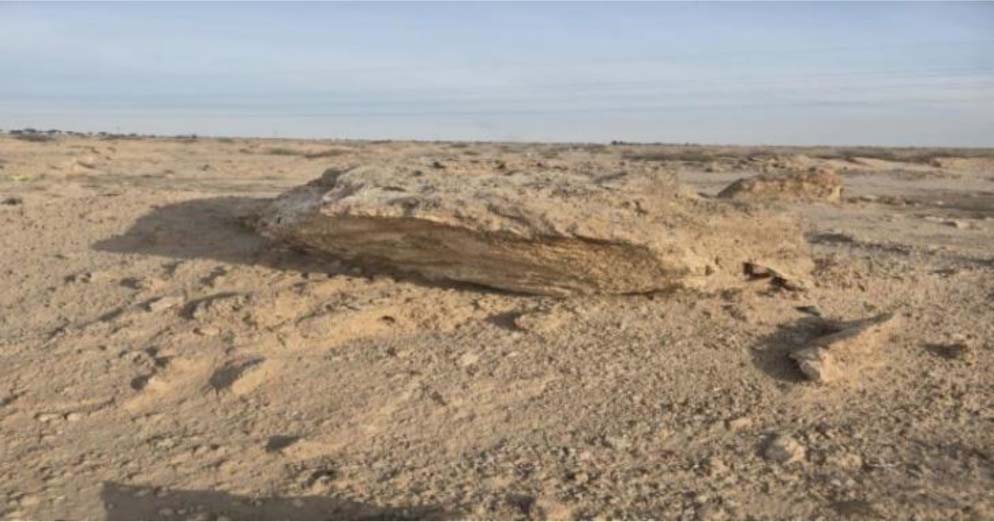
Figure 3:
Attapulgite aggregate
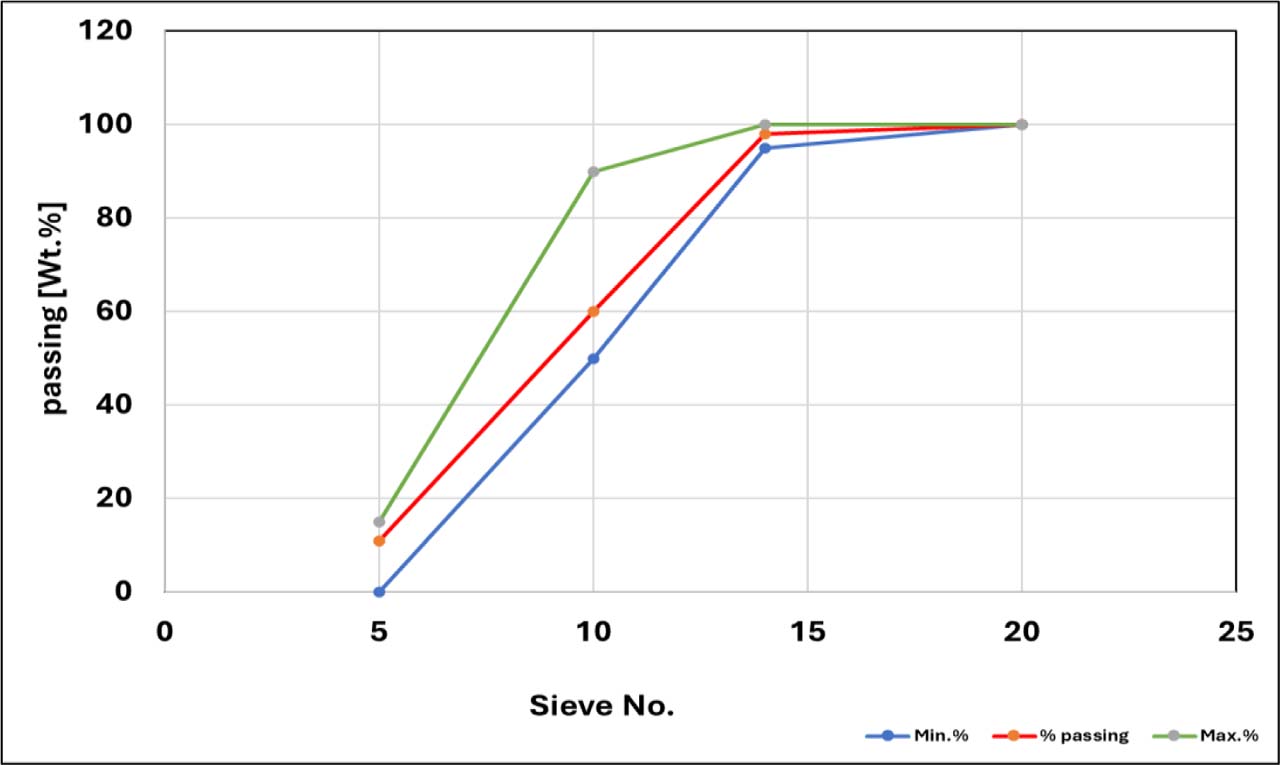
Figure 4:
Grading of attapulgite aggregate
To reduce absorption water of attapulgite aggregate, the aggregate surface was treated with cement impregnation according to (Yew et al., 2023) cement paste is made by using ordinary Portland cement known by Al Mas and tap water. Dry the attapulgite aggregate in before treated it. Prepare the grout by using cement and water with w\c=0.6 and mix it by using the blade mixer. Soaking LWA aggregate in the grout and mix it for 5 minutes. then, leave it for a period until the coating is evenly distributed, empty it into a basket (mesh) to eliminate of excess grout. After that, spread it on a horizontal, non-absorbent surface until the initial setting occurs. Sieving aggregate by using mesh to remove any Excess cement from its surface. Then cured it for Figure 6: Treated Attapulgite by Cement Paste three days to ensure sealed the pores and getting additional strength. Figure 5 shows the results of treated attapulgite by cement paste.
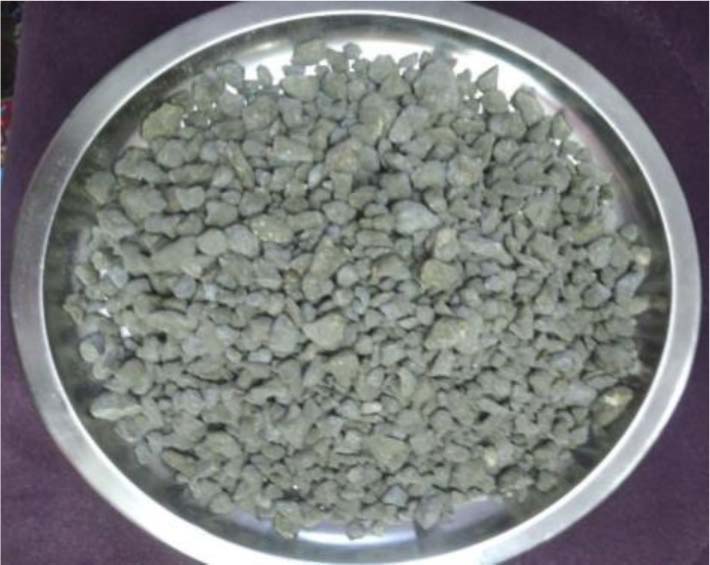
Figure 5:
Treated attapulgite by cement paste
3. Mix Design
The mix design methodology used in LWSCC incorporated with treated attapulgite aggregate as a coarse aggregate was designed according to IS 10262: 2019 as a reference mix (G0). To study the effect of glass waste, a part of natural fine aggregate was replaced with two types of particle size in replacement proportion (10%, 20%, 30%, and 40%) by mass of fine aggregate. The recycled waste glass replaced natural fine aggregate on a mass-for-mass basis. Accordingly, the combined mass of natural fine aggregate and waste glass was maintained at 500 kg/m3 in all mixtures. Laboratory work includes producing two new types of LWSCC. The first type named GC was prepared by substituting natural sand by coarse glass and the other named GF produced substituting natural sand by fine glass. The water-to-binder ratio (w/b) was ensured constant at 0.31 for all mixtures to confirm consistency in comparison. The binder system consisted of cement(C), fly ash (FA), and limestone powder (LP), which were incorporated to improve workability, enhance particle packing, and increase strength and durability improvement. The dosage of superplasticizer (SP) for each mixture was adjusted to maintain the required flowability and self-compacting characteristics in accordance with EFNARC guidelines. The quantities of mixed materials (kg\m3) are displayed in Table 4.
Table 4:
Quantities of mixed materials [kg\m3]
| Mix code | C | FA | LP | w | w\b | CA | FA | GW | Sp % |
|---|---|---|---|---|---|---|---|---|---|
| G0 | 450 | 50 | 20 | 155 | 0.31 | 600 | 500 | 0 | 1.4 |
| GC10% | 450 | 50 | 20 | 155 | 0.31 | 600 | 450 | 50 | 1.37 |
| GC20% | 450 | 50 | 20 | 155 | 0.31 | 600 | 400 | 100 | 1.35 |
| GC30% | 450 | 50 | 20 | 155 | 0.31 | 600 | 350 | 150 | 1.42 |
| GC40% | 450 | 50 | 20 | 155 | 0.31 | 600 | 300 | 200 | 1.45 |
| GF10% | 450 | 50 | 20 | 155 | 0.31 | 600 | 450 | 50 | 1.43 |
| GF20% | 450 | 50 | 20 | 155 | 0.31 | 600 | 400 | 100 | 1.48 |
| GF30% | 450 | 50 | 20 | 155 | 0.31 | 600 | 350 | 150 | 1.52 |
| GF40% | 450 | 50 | 20 | 155 | 0.31 | 600 | 300 | 200 | 1.57 |
4. Mixing, Casting, and Curing Procedure of LWSCC
Due to the high-water absorption capacity of the treated attapulgite aggregate, it was immersed in water for approximately 24 hours prior mixing to achieve a saturated surface dry (SSD) condition to prevent the absorption of mixing water by the attapulgite aggregate. After soaking, the aggregate was spread on a flat surface and allowed to air-dry until all free surface moisture had evaporated, ensuring that only internal moisture remained within the particles. Afterward, all materials were mixed using a pan mixer with a capacity of 0.04 m3. Initially, the fine (glass and sand) and coarse aggregates (attapulgite) were dry-mixed for approximately 30 seconds to ensure uniform distribution. Then, half of the mixing water was added, and the mixture was mixed for one minute. The mixture was permitted to time out for one minute to ensure the aggregates will water absorption. Afterward, cement, fly ash, and limestone powder were added and mixed for an additional minute. The superplasticizer and the remaining water were then introduced, and the mixture was further mixed for about three minutes to ensure proper dispersion and homogeneity. Once a uniform light weight self-compacting concrete mixture was achieved, the mixer was stopped. For casting, all moulds were cleaned and oiled prior to use to prevent adhesion. The fresh concrete was placed in a single layer without any external vibration, in accordance with SCC casting requirements, for specimens including cylinders, cubes, and prisms, as shown in Figure 6. The surface was then levelled using a steel trowel and left undisturbed in the laboratory for 24 hours. After demoulding, the specimens were cured in a water tank under laboratory conditions for curing periods of 7, 28 and 90 days, whereas the modulus of elasticity was evaluated at 28 and 90 days.
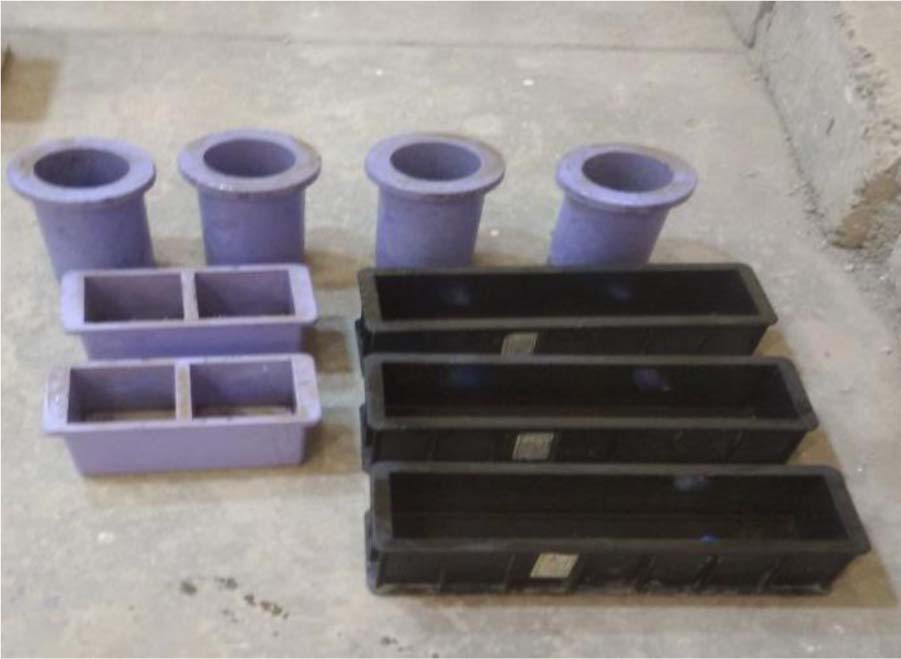
Figure 6:
Moulds used in this study
5. Testing of Concrete Properties
5.1. Fresh Tests
Fresh Tests To verify from being the concrete of the mixes is SCC, the four standard tests (Slump flow test, T50 cm slump flow test, V-funnel test, and L-box fresh test) of SCC were carried out on each batch and the results were compared with the standard limitations mentioned in (EFNARC, 2005). Figure 7 Fresh test apparatus: (a) Slump flow ana T500mm, (b) V-funnel, and (c) L-box.
5.2. Mechanical Properties Tests
The mechanical tests of the hardened LWSCC mixtures were investigate by using standardized test methods to show the effect of recycled materials on their structural performance. These tests were compressive strength by using three specimens with size (100*100*100) mm that confirmed the requirements of BS EN 12390-3, 2009, Equilibrium density performed by using the two cylinders have dimensions of 100mm diameter x 200mm height, and they were tested based on ASTM C 567-05 standards. Splitting tensile strength was assessed according to ASTM Standard C496, 2011 where three cylinders have dimensions, 100 mm in diameter and 200 mm in height mm were used, flexural strength also assessed by using three prism of concrete specimens with dimensions of 100 mm × 100 mm × 400 mm subjected to a flexural strength test (two points load) according to ASTM C78/C78M, 2010, modulus of elasticity was determined according to ASTM C469, 2014, the test was performed by using two cylindrical specimens measuring 100mm diameter×200 mm in height.
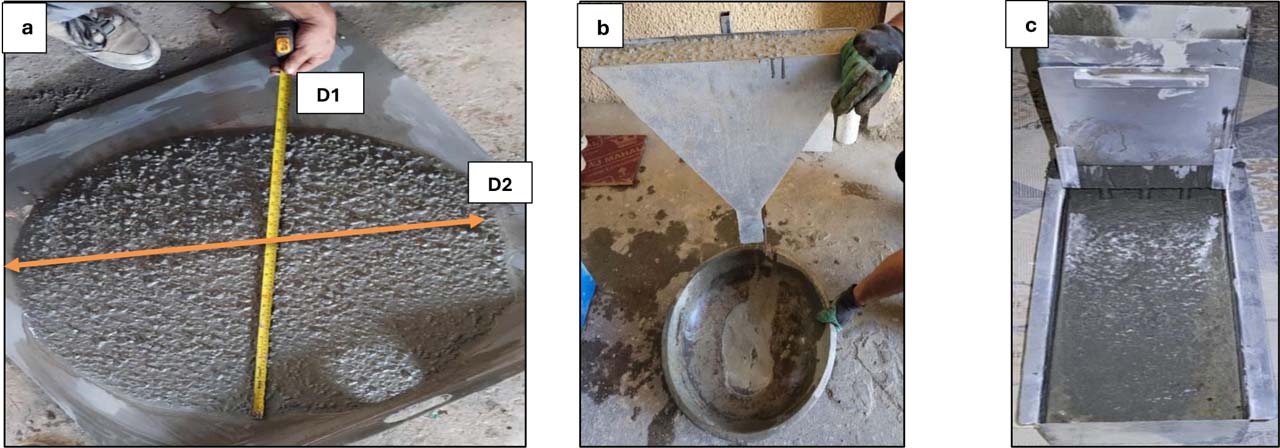
Figure 7:
Fresh test apparatus: (a) Slump flow ana T500mm, (b) V-funnel, and (c) L-box
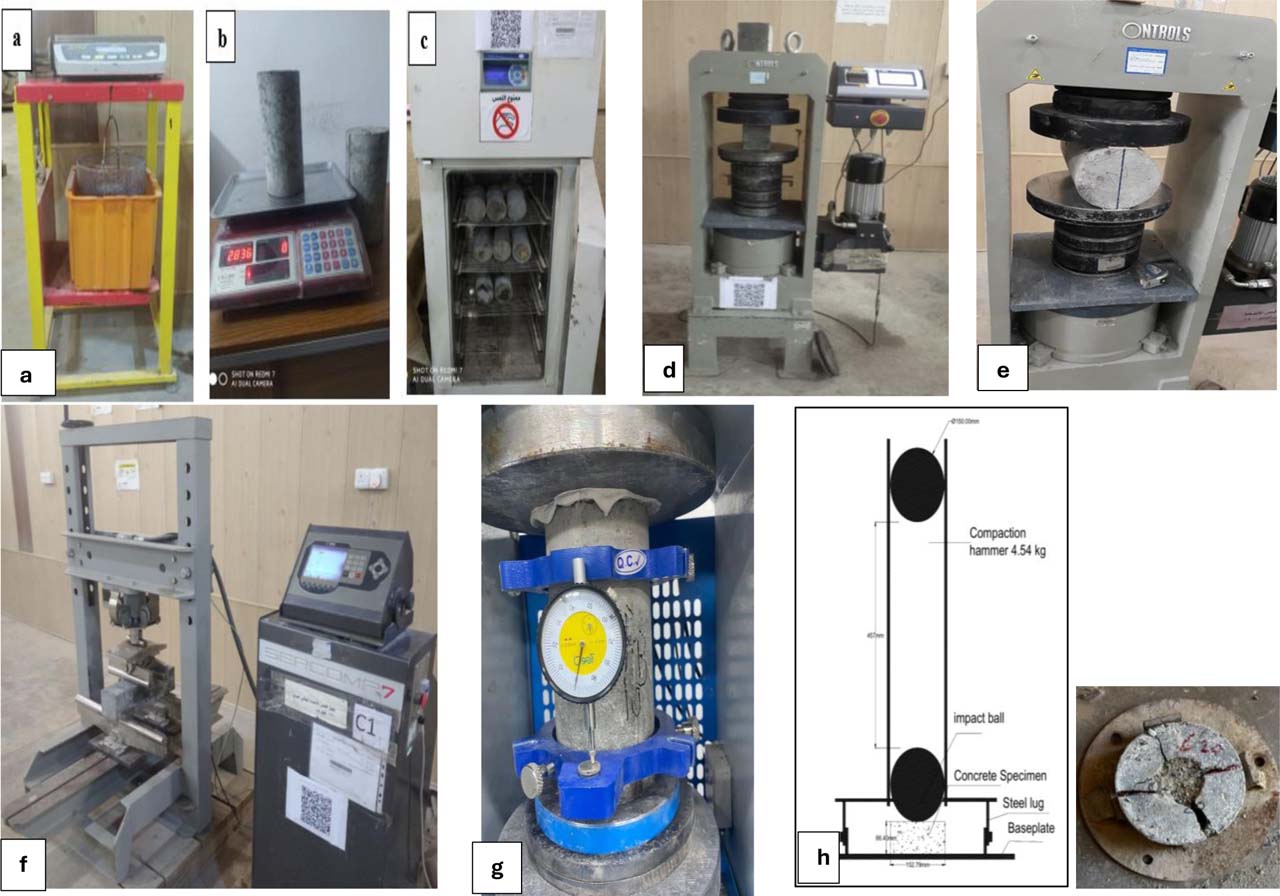
Figure 8:
Mechanical tests: (d) Compressive strength, (e) Splitting tensile strength, (f) Flexural strength, (g) Modulus of elasticity, and (h) Impact strength
200 mm height. Finally, the impact resistance test was conducted according to the procedure recommended by ACI Committee 544 using three cylindrical concrete disc specimens with dimensions of 150 mm diameter and 65 mm height. Figure 8 Show the mechanical test procedure: (a) Compressive strength, (b) Splitting tensile strength, (c) Flexural strength, and (d) Modulus of elasticity, (f) Impact resistance.
5.3. Durability Test
Water absorption was determined in accordance with ASTM C642 by using three specimens of 100 × 100 × 100 mm for each mixture at each testing age. Sorptivity was measured according to ASTM C1585-2004 by using two cylindrical disc specimens, 100 ± 6 mm diameter disc, with a thickness of 50 ± 3 mm, for each mixture at each testing age. The alkali–silica reaction was evaluated in accordance with ASTM C1260 using two mortar-bar specimens measuring with dimensions of 25 × 25 × 285 mm. For each test, the reported result represents the mean value obtained from the replicate specimens.
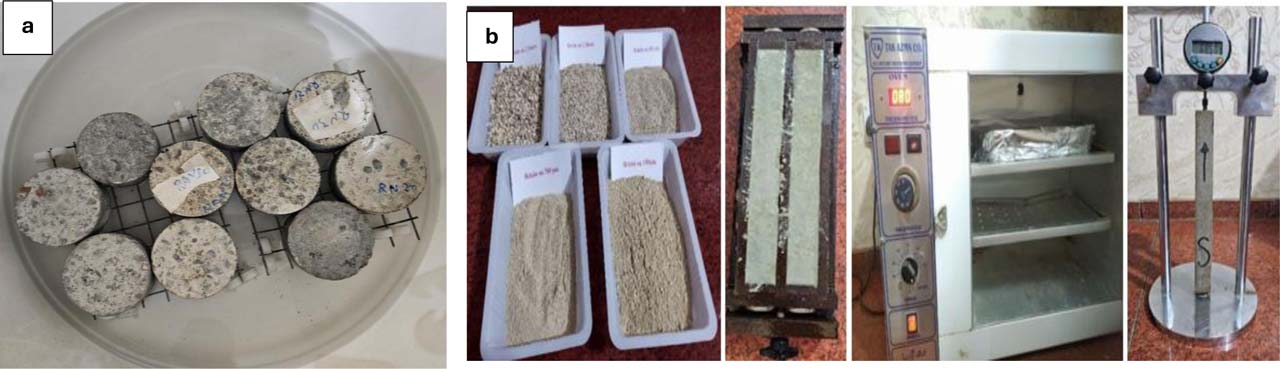
Figure 9:
Durability test setup: (a) Sorptivity, and (b) Alkali–silica reaction (ASR) expansion
6. Results and Discussion
6.1. Fresh Properties of LWSCC Incorporating Glass Waste
The results offered in Table 5 show the effect of waste glass content and particle size on the fresh properties of LWSCC mixtures, including slump flow, viscosity, passing ability, and fresh density.
Table 5:
Fresh properties of LWSCC mixtures
| Mix code | Fresh properties | |||||
|---|---|---|---|---|---|---|
| Slump [mm] | Sp% | T500 sec. | V-funnel sec. | L-box | Fresh density [Kg/m3] | |
| G0 | 720 | 1.40 | 2.83 | 7.6 | 0.95 | 1890 |
| GC10% | 720 | 1.37 | 2.80 | 7.7 | 0.96 | 1886 |
| GC20% | 725 | 1.35 | 2.74 | 7.9 | 0.98 | 1878 |
| GC30% | 715 | 1.42 | 2.90 | 7.7 | 0.93 | 1865 |
| GC40% | 700 | 1.45 | 3.66 | 7.5 | 0.90 | 1852 |
| GF10% | 715 | 1.43 | 2.94 | 7.8 | 0.96 | 1881 |
| GF20% | 705 | 1.48 | 3.10 | 8.0 | 0.94 | 1872 |
| GF30% | 697 | 1.52 | 3.22 | 8.2 | 0.92 | 1860 |
| GF40% | 685 | 1.57 | 3.28 | 8.7 | 0.89 | 1846 |
The slump flow results indicate that the incorporation of recycled glass significantly affects the flowability of LWSCC depending on the replacement level and particle size. Table 5 and Figure 10 show the experimental results for LWSCC mixtures with sand replacement percentage (10-40)%.
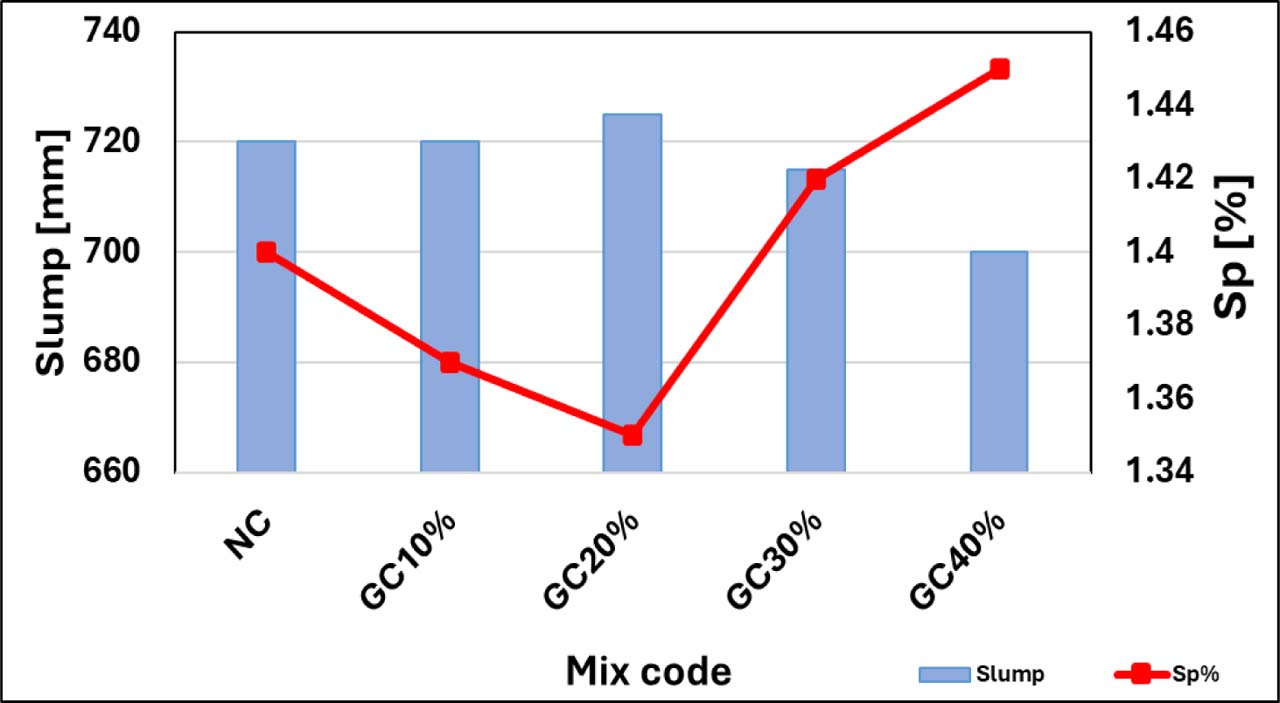
Figure 10:
Slump flow and Sp in GC mixtures
The reference mix (G0) achieved a slump flow of 720 mm, which falls within the acceptable range for self-compacting concrete. For mixtures containing coarse glass (GC), at 10% and 20% replacement the slump flow was 720 mm and 725mm, respectively, it is approximately as same reference mix. This behaviour can be primarily attributed to the smooth surface texture and low water absorption of glass, which reduce internal friction between particles and enhance flowability. Furthermore, the slight reduction in superplasticizer (SP) dosage contributes to improved flowability by increasing the amount of free water available within the mixture. However, when the replacement level increased to 30% and 40%, the slump flow decreased to 715 mm and 700 mm, respectively. This reduction caused by increased interparticle interaction and the interruption of the natural sand gradation at higher glass replacement ratios, where the increasing waste glass content leads to a loss of best particle size distribution and less efficient particle packing., which negatively affects the flow of the mixture. The superplasticizer SP dosage increased to maintain workability because the higher glass content increases particle interaction and internal friction within the mixture as illustrated in Figure 3. This observation is consistent with findings by (Akinpelu et al., 2025; Çelik et al.; Sharifi et al., 2016).
In contrast, the slump flow results of LWSCC mixtures containing fine recycled glass (GF) showed a gradual decrease in flowability as the replacement level increased from 10% to 40% as shown in the Figure 11. Compared with the control mixture, the slump flow decreased from 715 mm at 10% to 685 mm at 40% replacement. This reduction can be attributed mainly to increased content and specific surface area of fine glass particles. As a result, a larger amount of cement paste is required to coat the particles, leading to higher internal friction within the mixture and consequently reducing the flowability. Furthermore, the angular shape and rough edges of crushed glass particles may increase particle interlocking, which also contributes to lowering the slump flow.
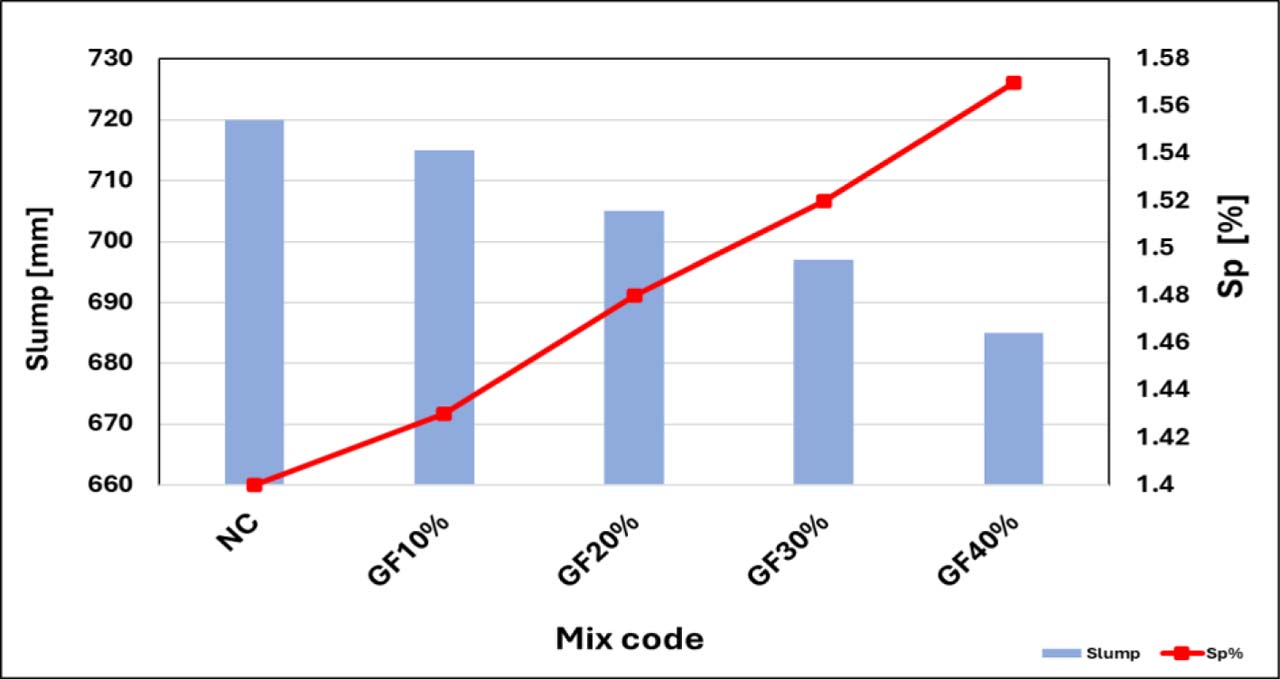
Figure 11:
Slump flow and Sp in GF mixtures
To overcome this reduction in workability, the dosage of superplasticizer was gradually increased from 1.40% in the control mixture to 1.57% at 40% glass replacement as shown in the Figure 4. The increase in superplasticizer dosage improves dispersion of cement particles and reduces flocculation within the cement paste, which enhances the fluidity of the mixture and helps maintain the self-compacting properties of the concrete despite the higher glass content. Similar results were showed by (Hamada et al., 2022; Subba et al., 2023). LWSCC made using glass waste GC, GF with replacement ratios of 10, 20, 30 and 40% could be classified as SF2 in accordance with EFNARC.
The T50 cm flow time results provide an indication of the viscosity and flow rate of (LWSCC) mixtures. Table 5 and Figure 12 present the variation of T500mm with different replacement levels of waste glass.
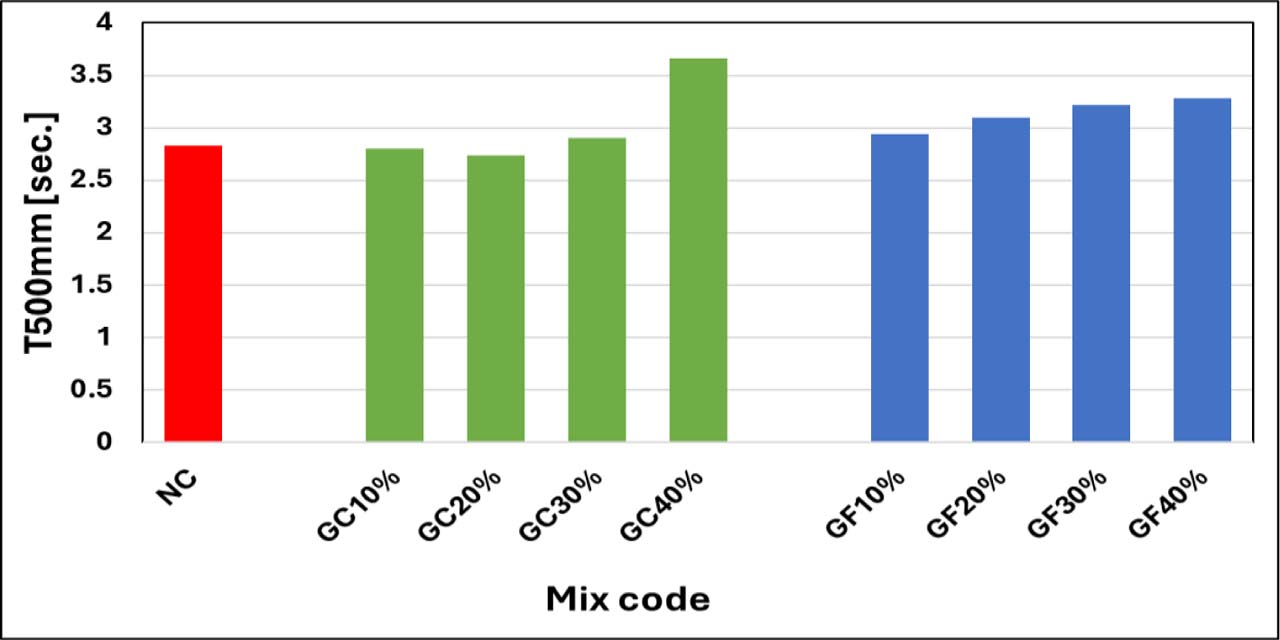
Figure 12:
T500mm results
The reference mix (G0) recorded a T50 value of 2.83 s, which reflects acceptable viscosity for self-compacting concrete. For mixtures incorporating coarse glass (GC), the T50 values decreased to 2.8 s and 2.74 s at 10% and 20% replacement, respectively, indicating faster flow and reduced viscosity compared to the reference mix. These increments may be attributed that coarse glass improves flowability (slump flow) at lower replacement levels because of smooth surface and low absorption of coarse glass, which reduce internal friction that improve flowability. At 30% and 40% replacement, T50 increased to 2.90 s, 3.66s, respectively. This due to increase internal friction between aggregate particles leads to a slight increase in viscosity. These studies are confirmed with previous studies (Alam et al., 2025) (Poudel et al., 2025).
For mixtures containing fine glass (GF) presented a higher T500mm values, representing to increased resistance to flow. The T500mm were 2.94 s and 3.10 s at 10% and 20% replacement, respectively, afterward at 30% and 40%, it increased to 3.22s and 3.28s, respectively. The highest value (3.28 s) at 40% replacement exceeds that of the reference mix, indicating increased viscosity and slower flow. This behaviour is mainly attributed to the higher surface area of fine glass particles, which increases paste demand and internal cohesion within the mixture. Similar findings were reported in (Subba et al., 2023) (Hassan & Pekrioglu-Balkis, 2024).
The V-funnel test is commonly used to evaluate the viscosity and flowability of self-compacting concrete (SCC). Table 6 and Figure 13 show the experimental results of v-funnel test. According to EFNARC guidelines, SCC mixtures can be classified into two viscosity classes: VF1 when the V-funnel flow time is less than 8 seconds and VF2 when the flow time ranges between 8 and 25 seconds.
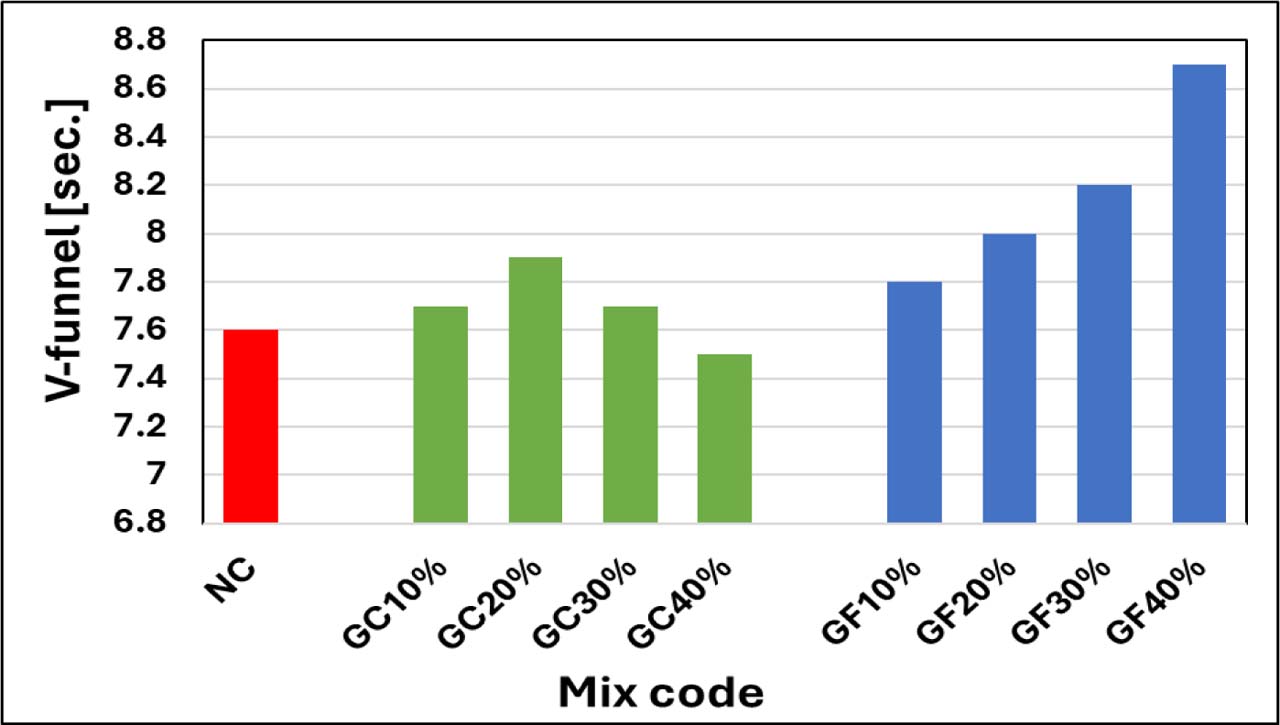
Figure 13:
Experimental results of v-funnel test
V-funnel time For the GC mixtures were slightly increased from 7.7 s to 7.9 s at 10% and 20%, after that it decreased to 7.7 s and 7.5 s at 30% and 40%, respectively. These results attributed to the incorporation of GC at 10 % and 20% replacement ratios produced a small increase in viscosity due to variations in particle packing and interaction within the paste phase. Conversely, at higher replacement ratios (30 and 40) %, the smoother surface of glass and lower water absorption appear to reduce internal friction and facilitated flow through the funnel. This behaviour is consistent with previous studies indicating that recycled glass can improve the fresh properties of SCC when its surface texture and particle size distribution enable particle movement and improve paste lubrication (Ahmad et al., 2023) (ElNemr & Shaltout, 2025).
In contrast, V-funnel time of GF mixtures increased progressively from 7.8 s to 8.7 s with increasing fine glass content from 10% to 40%. This increment indicates that the mixtures became slightly more viscous as the replacement level increased. The higher viscosity may result from the greater number of fine particles within the mix, which increases particle interaction and internal resistance during flow (Aidjouli et al., 2024) (Taher et al., 2024).
The L-box test is used to evaluate the passing ability of SCC, which reflects the capacity of concrete to flow through reinforcement without blocking or segregation. The L-box ratio (H2/H1) indicates the degree of passing ability, and EFNARC recommends values between 0.8 and 1.0 for acceptable SCC performance. The reference mixture exhibited an L-box ratio of 0.95, indicating excellent passing ability and a high capacity for the concrete to flow through obstacles such as reinforcing bars as shown in the Table 5 and Figure 14.
When substituting fine aggregate by waste glass with grading passing from sieve 4.75mm and retained on sieve 1.18mmwas incorporated in the (GC mixtures), the L-box ratio initially increased slightly 0.96 at 10% and 0.98 at 20% replacement, suggesting an improvement in passing ability. This improvement can be attributed to the micro-filling capability of the glass powder, which enhances the homogeneity of the paste and improves lubrication between aggregate particles, facilitating smoother flow through confined spaces. However, as the replacement ratio increased to 30% and 40%, the L-box values decreased to 0.93 and 0.90, respectively.
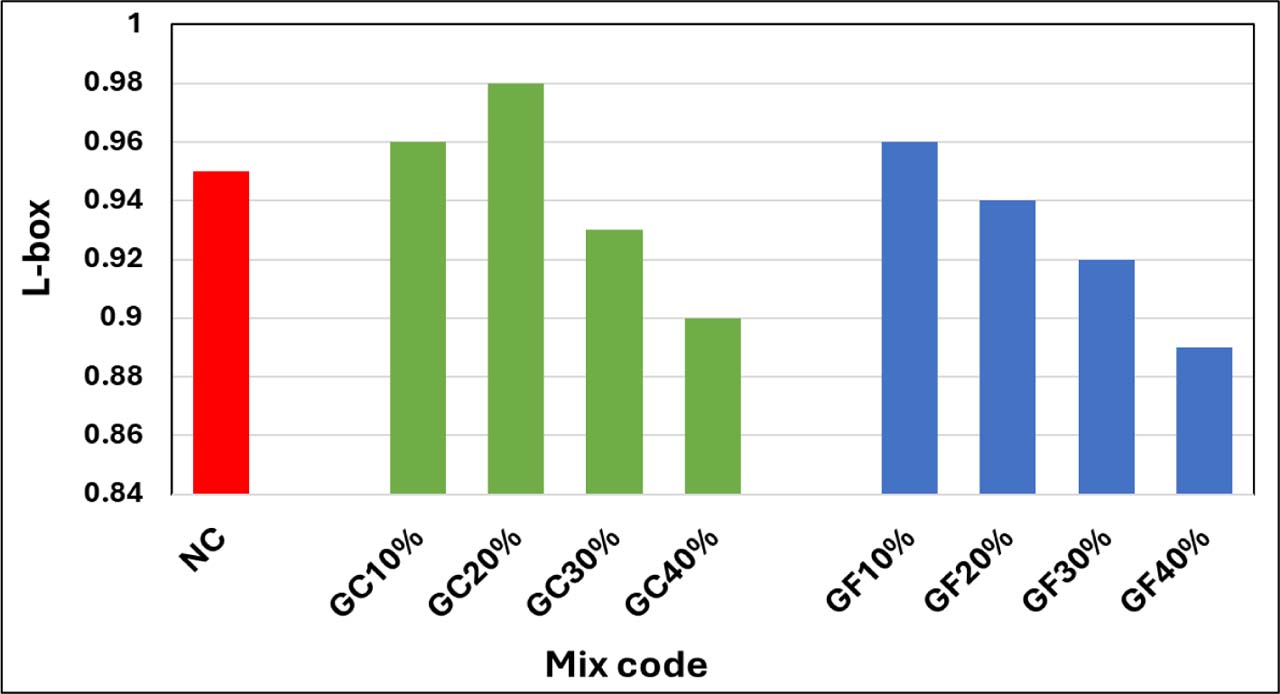
Figure 14:
Experimental results of L-Box test
The reduction in passing ability at higher replacement levels can be explained by the increase in mixture viscosity and cohesiveness, which restricts the movement of coarse aggregates through the reinforcing bars. Similar findings were reported in recent investigations on SCC containing glass powder and nano-additives, where increasing the powder content slightly reduced the L-box ratio due to increased cohesiveness and reduced paste fluidity (Hama et al., 2025) (Saha et al., 2024). When substituting fine aggregate by waste glass with grading passing from sieve 1.18mm (GF mixtures), the L-box ratio decreased gradually from 0.96 to 0.89 as the glass powder content increased. This trend indicates a reduction in the passing ability of the mixtures, which is consistent with the increase in viscosity observed in the V-funnel results. When the paste becomes more viscous, the mobility of coarse aggregates is restricted, increasing the likelihood of blocking between reinforcing bars, similar results were conducted by (Aidjouli et al., 2024) (Taher et al., 2024).
Fresh density is an important property, and it provides an indication of the uniformity and stability of the mixture, as well as the effectiveness of the mix design. Table 5 and Figure 15 show the result of fresh density of GC and GF mixtures.
The fresh density of GC mixtures showed a gradual reduction with increasing replacement levels. Compared to the reference mix (1890 kg/m3), the density decreased by approximately 0.21%, 0.63%, 1.32%, and 2.01% at 10%, 20%, 30%, and 40% replacement levels, respectively. This reduction is mainly attributed to the lower specific gravity of glass compared to natural sand, as well as the angular shape and smooth surface of glass particles, which increase void content and reduce packing density. Similar trends were reported in previous studies, where the incorporation of waste glass led to a decrease in concrete density due to increased porosity and weaker interfacial bonding between glass particles and cement paste. Similar results were obtained by (Jahami et al., 2022) (Qaidi et al., 2022).
The fresh density of GF mixtures decreased progressively with increasing replacement levels. Compared to the control mix (1890 kg/m3), the reduction reached approximately 0.48%, 0.95%, 1.59%, and 2.33% at 10%, 20%, 30%, and 40%, respectively. The reduction in density was more pronounced than that of GC mixture, which can be attributed to the higher surface area of fine glass particles, leading to increased water demand, air entrainment, and void formation. Although fine glass may contribute to a micro-filling effect at low replacement levels, higher contents result in particle agglomeration and increased porosity, thereby reducing density. Similar trends were reported in previous studies (Wen et al., 2025) (Jamellodin et al., 2022).
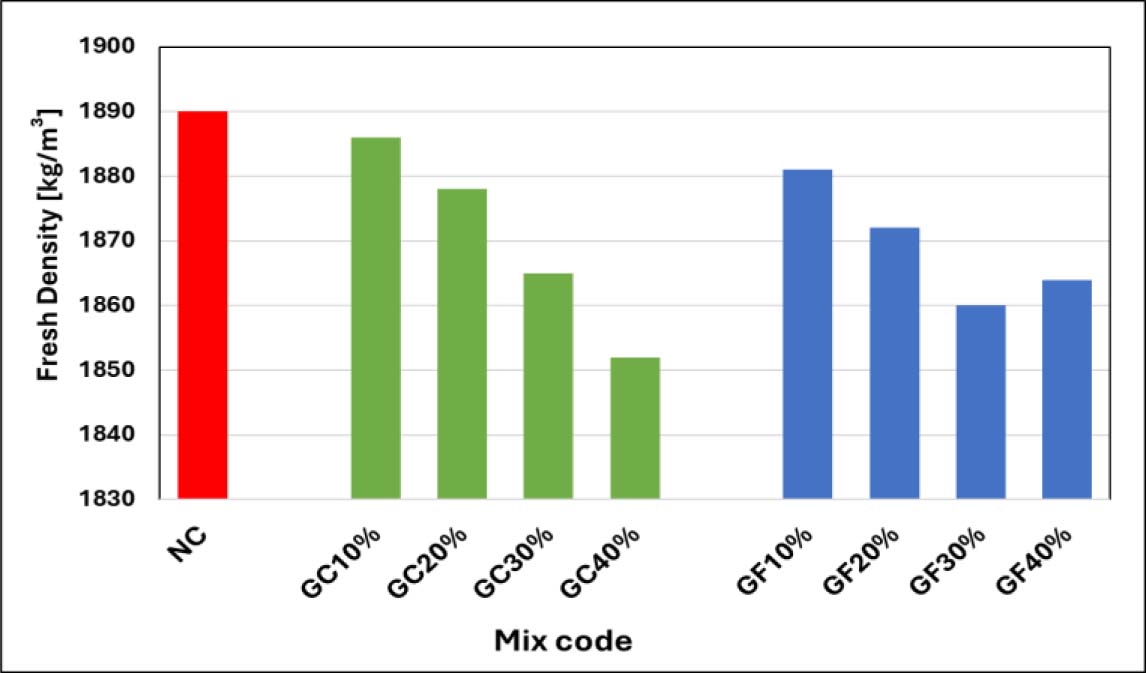
Figure 15:
Experimental results of fresh density test
6.2. Harden Properties Results
6.2.1. Equilibrium Density
The equilibrium density results clearly show a systematic reduction with increasing glass replacement for both GC and GF mixtures compared to the reference mixture (1646 kg/m3), confirming the sensitivity of LWSCC density to aggregate type and particle size distribution. Table 6 and Figure 16 show the results of Equilibrium density for LWSCC of GC and GF mixtures.
Table 6:
Equilibrium density results
| Mix code | G0 | GC10 | GC20 | GC30 | GC40 | GF10 | GF20 | GF30 | GF40 |
|---|---|---|---|---|---|---|---|---|---|
| Equilibrium density [Kg/m3] | 1646 | 1637 | 1633 | 1626 | 1620 | 1633 | 1624 | 1619 | 1594 |
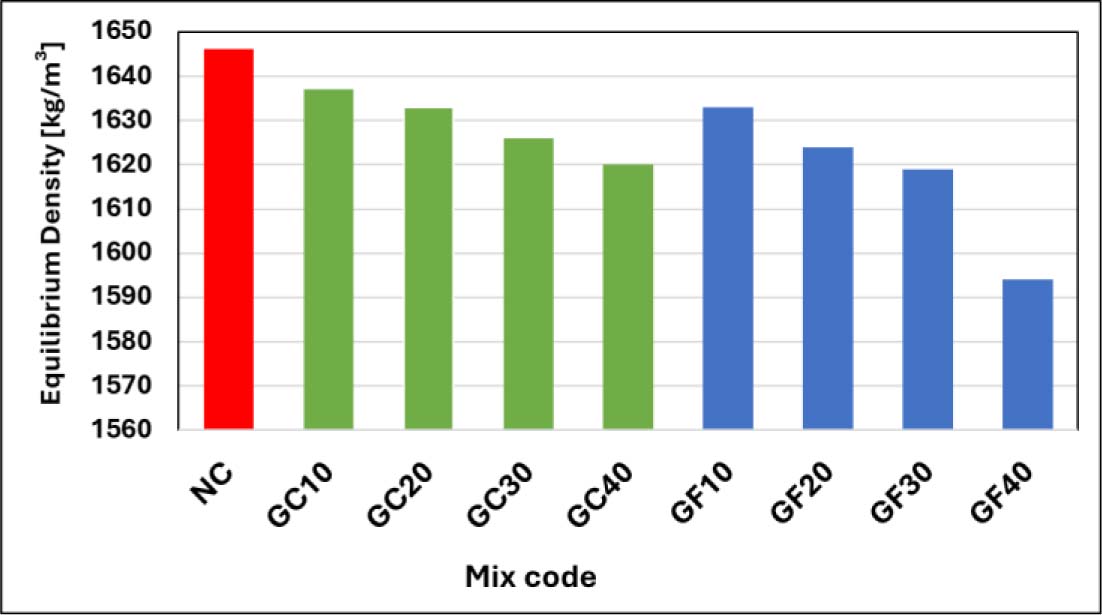
Figure 16:
Experimental results of equilibrium density test
From the above results, LWSCC contained coarser glass (GC mixtures), the equilibrium density decreased from 1637 kg/m3 (10%) to 1620 kg/m3 (40%), corresponding to a total reduction of approximately 1.6%,0.55%, 1.21%, and 1.58% at 10%, 20%, 30%, and 40%, respectively. This reduction indicates that the coarser glass fraction maintained relatively better packing efficiency and particle interlock within the cementitious matrix.
LWSCC contained finer glass (GF mixtures) showed decreasing in the density from 1633 kg/m3 at (10%) to 1594 kg/m3 at (40%), the reduction was approximately 0.79%, 1.34%, 1.64%, and 3.16% at 10%, 20%, 30%, and 40%, respectively. The rate of reduction in GF mixtures was higher than that of GC mixtures. This behaviour can be attributed to the fine glass particles has a higher specific surface area of, which increases required water demand and helps of particle agglomeration, leading to reducing of packing efficiency and the creation of micro-voids within the matrix. These results stay within the acceptable limits of structural lightweight concrete according to ACI 318-11 (Standard, 2011), which specifies that the equilibrium density of structural lightweight concrete normally ranges between 1440 and 1840 kg/m3.
6.2.2. Compressive Strength
Compressive strength is an important mechanical property of concrete that denotes concrete ability to resist applied loads, and it is widely used to evaluate its quality and performance. In LWSCC, compressive strength influenced by many factors such as aggregate type, particle size, and the replacement materials like waste glass. Table 7 and Figure 17 illustrated the results of compressive strength at 7, 28 and 90 days.
The compressive strength results show a significant influence of glass particle size and replacement ratios on the mechanical properties of LWSCC. For GC mixtures, a continuous reduction in compressive strength was observed with increasing replacement levels at all curing ages. At 7 days, the strength decreased by approximately 2.8%, 4.9%, 7.8%, and 10.4% for 10%, 20%, 30%, and 40% replacement, respectively, compared to the control mix. A similar trend was observed at 28 days, where the reduction about 2%, 4.5,6.4% and 8.6% at 10%, 20%, 30%, and 40% replacement, while at 90 days, the decrease in compressive strength at10%, 20%, 30%, and 40% was approximately 2.8%, 4.5%, 6.2% and 8.9%, respectively. This behavior is mainly attributed to the smooth surface of glass particles and coarse glass behaves mainly as an inert aggregate resulting in a weaker interfacial transition zone (ITZ), which leads to poor bonding and the formation of internal micro cracks. These findings are consistent with previous studies (Tong et al., 2024) (Qaidi et al., 2022) (Dadouch et al., 2024), which reported that increasing the proportion of glass aggregate, particularly with larger particle sizes, reduces compressive strength due to weak adhesion and unfavorable particle morphology.
For GF mixture displayed an improvement in compressive strength. At 7 days, the strength increased by approximately 2.5% and 3.3% at 10% and 20% replacement, respectively, before slightly decreasing at higher ratios 1.2%,1.3% at 30% and 40%. At 28 days, the improvement became more pronounced, with increases of about 4.7%, 7.3%, and 4.1% at 10%, 20%, and 30% replacement, respectively, while the strength remained nearly equal to the control mix at 40% replacement. Similarly, at 90 days, slight improvements of about 1.9% and 1.7% were observed at 10% and 20%, followed by reductions of approximately 1.0% and 3.1% at 30% and 40%, respectively. The enhancement at 10% and 20% levels can be attributed to the particle packing, void filling, and refinement of the pore structure. Although finely ground waste glass may exhibit pozzolanic activity because of its amorphous silica, which raise the formation of additional C–S–H gel and result in a denser microstructure. This behavior agrees with recent studies (Poudel et al., 2025) (Ishaq & Mohammed, 2026)]. Though, at higher replacement levels (30% and 40%), the reduction in strength for GF mixtures due to the increase in specific surface area, which required a raise water demand and leads to particle agglomeration and higher porosity, Similar results were obtained by (Kassed & Ali, 2021).
Table 7:
Results of compressive strength at 7, 28 and 90 days
| Mix code | Compressive strength [MPa] | ||
|---|---|---|---|
| 7 d | 28 d | 90 d | |
| G0 | 25.11 | 30.03 | 32.63 |
| GC10 | 24.40 | 29.43 | 31.73 |
| GC20 | 23.89 | 28.67 | 31.15 |
| GC30 | 23.14 | 28.12 | 30.60 |
| GC40 | 22.51 | 27.44 | 29.72 |
| GF10 | 25.73 | 31.43 | 32.50 |
| GF20 | 25.93 | 32.21 | 33.18 |
| GF30 | 25.42 | 31.26 | 32.31 |
| GF40 | 24.78 | 30.07 | 31.61 |
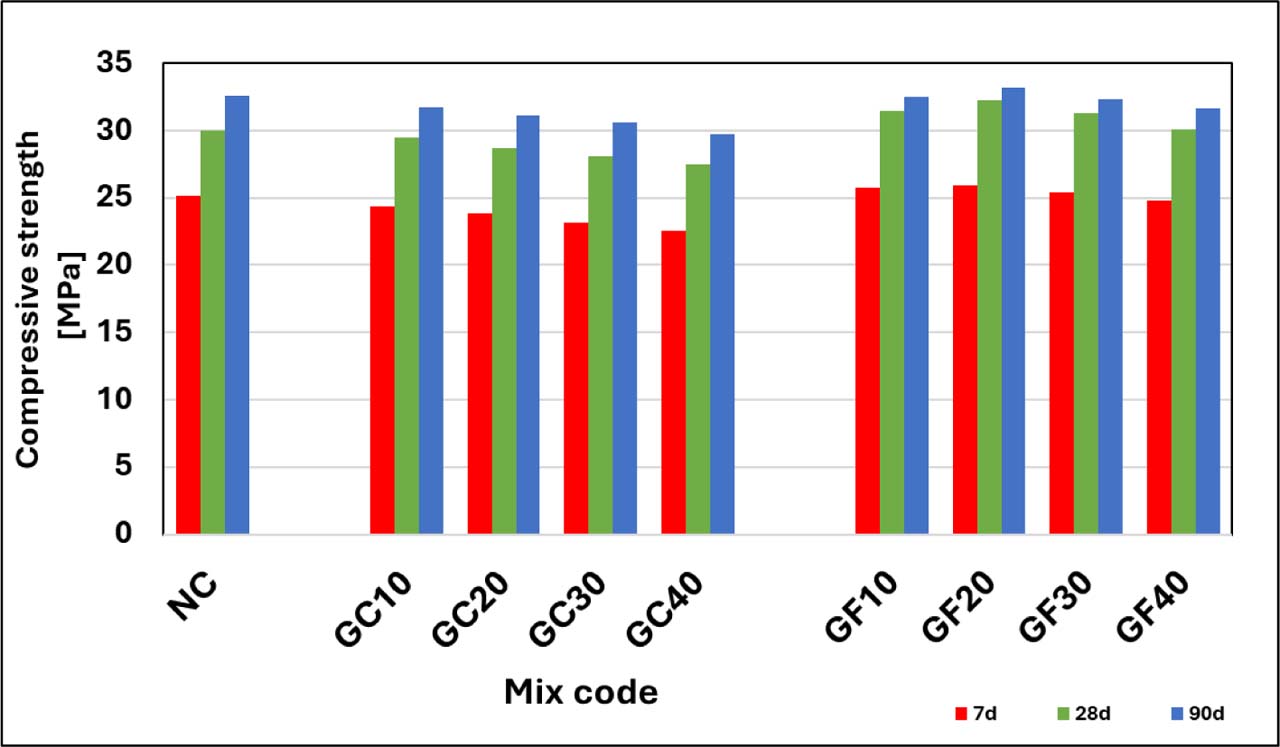
Figure 17:
Results of compressive strength at 7, 28 and 90 days
For both GC, GF mixtures at glass replacement percentage 30% and 40%, attained compressive strength values within the acceptable limits of structural lightweight concrete according to ACI 318-11. However, at these percentages the observed reduction is not desirable, it causes a decline in mechanical efficiency, so it can still be acceptable for specific structural applications where reduced self-weight is useful.
6.2.3. Splitting Tensile strength
The splitting tensile strength results show obvious dependency on both glass particle size and replacement percentage fraction, exhibiting a behavior closely aligned with the compressive strength trends. Table 8 and Figure 18 display experimental results of splitting strength test.
For LWSCC mixtures incorporating coarse glass (GC), experimental results show a progressive reduction in tensile strength with increasing replacement levels at all specified ages. At 7 days, the reduction ranged from approximately 1.3%,3.1%, 10.3% and 16.5% at 10%,20%, 30% and 40% replacement ratios, respectively, while at 28 days, the decrease was approximately 3.2%, 5.3%,7.9% and 10.9% at the same replacement at age 7days. At the same replacement levels, a similar decreasing trend was also marked at 90 days, with reductions 6.2%,7.3%,9.1% and 10.4%. This deterioration can be primarily attributed to the inherently smooth and non-porous surface of glass particles, which significantly weakens the interfacial transition zone (ITZ), thus reducing the efficiency of stress transfer and of micro cracks were initiated under tensile loading.
Table 8:
Results of splitting strength test
| Mix code | Splitting strength (MPa) | ||
|---|---|---|---|
| 7d | 28d | 90d | |
| G0 | 2.24 | 3.41 | 3.68 |
| GC10 | 2.21 | 3.30 | 3.62 |
| GC20 | 2.17 | 3.23 | 3.58 |
| GC30 | 2.01 | 3.14 | 3.51 |
| GC40 | 1.87 | 3.04 | 3.46 |
| GF10 | 2.27 | 3.53 | 3.77 |
| GF20 | 2.36 | 3.61 | 3.82 |
| GF30 | 2.21 | 3.48 | 3.71 |
| GF40 | 2.10 | 3.36 | 3.65 |
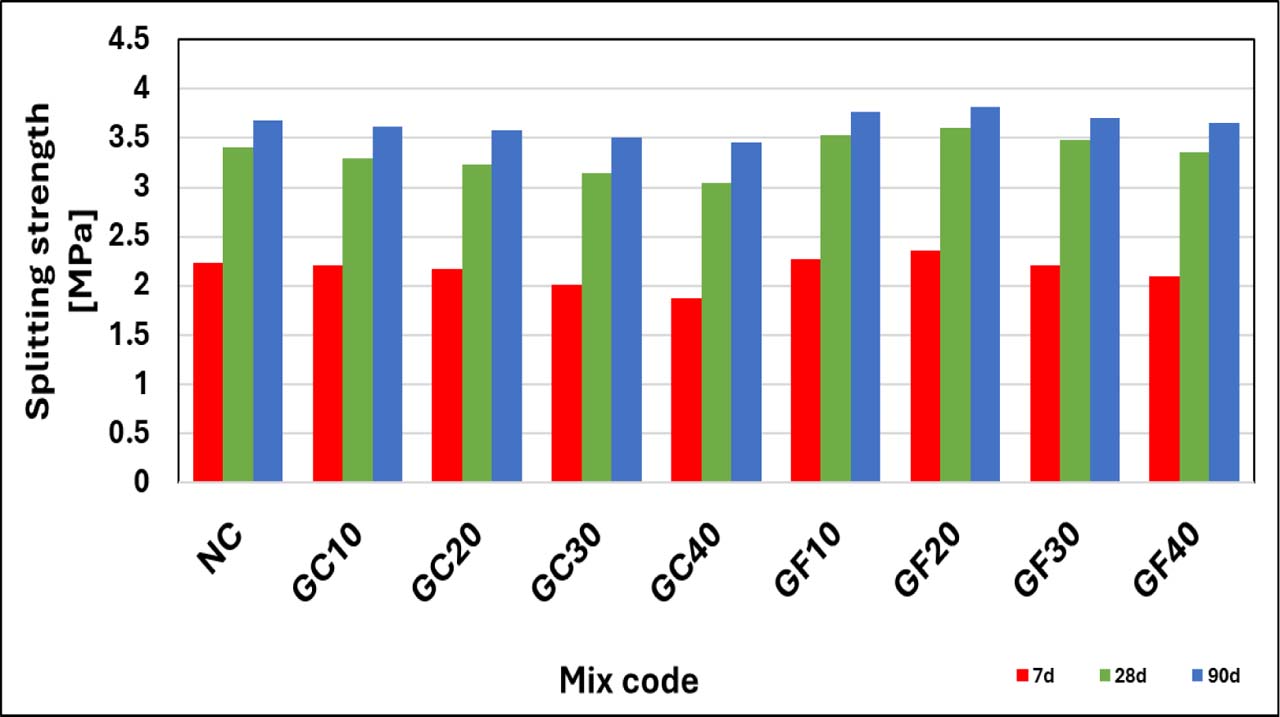
Figure 18:
Results of splitting strength test
For LWSCC mixtures incorporating with fine glass (GF), at 7 days, increases of approximately 1.3%, 5.4% at 10% and 20% relative to the control mixture, whereas GF30 and GF40 showed reductions of approximately 1.3% and 6.3%. This improvement enhanced more pronounced at 28 days, where the tensile strength increased by approximately 3.5%, 5.9%, 2.1% for GF10, GF20, and GF30, respectively, while GF40 exhibited a reduction of approximately 1.5%. The greatest performance was attained at 20% replacement, elsewhere which a gradual decline was observed. At 90 days, for GF10, GF20, GF30, and GF40 are increased +2.4%, +3.8%, +0.8%, and −0.8%, respectively, This improvement can be attributed to the double function of fine glass particles as both micro-fillers and pozzolanic materials, which contribute to pore refinement, improved packing density, and the formation of additional C–S–H gel, ultimately leading to a denser and more cohesive microstructure. Conversely, at higher replacement levels (greater than 30%), the tensile strength begins to decline. This reduction is due to the specific surface area were increased, which leads to higher water requirement, facilitates particle agglomeration, and leads to increased porosity and weak internal cohesion between concrete consistence. Similar observations have been reported in recent studies, where excessive glass content resulted in a dilution effect and increased void formation, ultimately compromising mechanical performance. Such findings are greatly agreement with previous experimental studies (Fayed et al., 2024) (Oan & Elrefaei, 2022).
6.2.4. Flexural Strength
The flexural strength results of LWESCC mixtures containing coarse glass (GC) showed a consistent deterioration with increasing replacement ratio at all curing ages, indicating that coarse glass adversely affected the bending resistance of the matrix. Table 9 and Figure 19 show the results of flexural strength tests.
Table 9:
Results of flexural strength test
| Mix code | Flexural strength [MPa] | ||
|---|---|---|---|
| 7 d | 28 d | 90 d | |
| G0 | 3.7 | 4.30 | 4.62 |
| GC10 | 3.68 | 4.12 | 4.52 |
| GC20 | 3.58 | 4.06 | 4.44 |
| GC30 | 3.44 | 3.91 | 4.31 |
| GC40 | 3.37 | 3.84 | 4.26 |
| GF10 | 3.96 | 4.58 | 4.71 |
| GF20 | 4.00 | 4.71 | 4.84 |
| GF30 | 3.66 | 4.27 | 4.55 |
| GF40 | 3.54 | 4.11 | 4.39 |
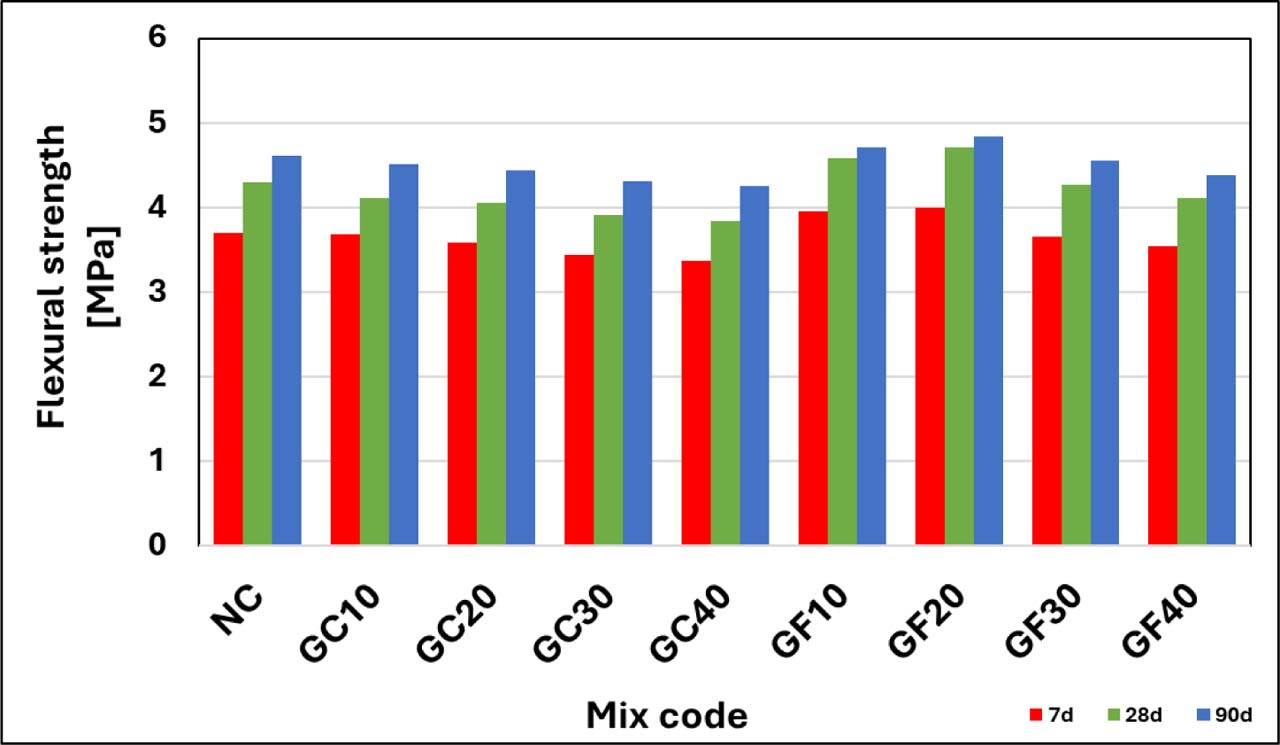
Figure 19:
Flexural strength results
At 7 days, the flexural strength decreased by 0.5%, 3.2%, 7.0%, and 8.9% at 10%, 20%, 30%, and 40% replacement, respectively, compared with the reference mix. A similar downward trend was observed at 28 days, where the reductions reached 4.2%, 5.6%, 9.1%, and 10.7%, respectively, while at 90 days the corresponding decreases were 2.2%, 3.9%, 6.7%, and 7.8%. The progressive reduction can be attributed to the smooth and non-porous surface of coarse glass particles, which weakens the interfacial transition zone (ITZ) and reduces the efficiency of stress transfer under flexural loading. Also, the angular and brittle nature of coarse glass may help microcrack initiation and propagation, thereby reducing the capacity of the concrete to resist tensile stresses generated by bending. This behavior is consistent with previous findings (Saha et al., 2024) (Qaidi et al., 2022).
LWSCC mixtures containing fine glass (GF) exhibited a more favorable response, particularly at low replacement levels, confirming that glass particle size plays a decisive role in flexural behavior. Over 7 days, the flexural strength increased by 7.0% and 8.1% at 10% and 20% replacement, respectively, before declining by 1.1% and 4.3% at 30% and 40%. At 28 days, the enhancement became more pronounced, with increases of 6.5% and 9.5% at 10% and 20%, respectively, whereas slight and moderate reductions of 0.7% and 4.4% were recorded at 30% and 40%. Likewise, at 90 days, the strength improved by 2.0% and 4.8% at 10% and 20%, respectively, but then decreased by 1.5% and 5.0% at 30% and 40%. The best performance was attained at 20% replacement, especially at 28 days, where the highest improvement 9.5% was recorded. This development is primarily attributed to the filler effect of fine glass particles and their pozzolanic influence, which increases packing density, reduces internal voids, produces a more compacted microstructure, and reinforce the ITZ. Though, once the replacement level exceeded the optimum threshold, the positive effect gradually decreased that causes reduction in flexural strength. This behavior can be mainly combined with dilution effects, increased surface area, localized particle agglomeration, and the formation of higher porosity inside the matrix. This trend agrees well with the literature of (Jahami et al., 2022) (ElNemr & Shaltout, 2025).
6.2.5. Modulus of Elasticity
The modulus of elasticity results of LWASCC mixtures demonstrated a clear dependency on both glass particle size and replacement ratio, with distinct trends observed for (GC) and (GF) across curing ages (28 and 90 days). Table 10 and Figure 20 show the results of modulus of elasticity test.
For GC mixtures, a continuous reduction in elastic modulus was recorded with increasing replacement levels. At 28 days, the modulus of elasticity decreased from 16.74 GPa (reference mix) to 16.22, 15.87, 15.42, and 15.16 GPa at 10%, 20%, 30%, and 40% replacement, corresponding to reductions of approximately 3.1%, 5.2%, 7.9%, and 9.4%, respectively. A similar trend was observed at 90 days, where the modulus declined from 17.96 GPa to 17.35, 17.18, 16.76, and 16.46 GPa, representing reductions of about 3.4%, 4.3%, 6.7%, and 8.4%, respectively. This reduction is mainly attributed to the smooth surface texture and weak interfacial transition zone (ITZ) associated with coarse glass particles, which reduces stiffness and stress transfer efficiency within the cement matrix. Additionally, the angular shape and lower bonding characteristics of glass aggregates contribute to increased microcracking and reduced rigidity, as reported in previous studies (Ahmed & Rana, 2023). In contrast, GF mixtures exhibited an initial improvement in modulus of elasticity at lower replacement levels, followed by a reduction at higher contents. At 28 days, the modulus increased to 17.62 and 17.84 GPa at 10% and 20% replacement, corresponding to increases of approximately 5.3% and 6.6%, respectively, before decreasing to 17.31 GPa (3.4% increase) and 16.90 GPa (1.0% increase) at 30% and 40%. Similarly, at 90 days, the modulus increased to 17.82 and 18.32 GPa (−0.8% decrease and +2.0% increase relative to control), then decreased to 17.87 (−0.5%) and 17.46 GPa (−2.8%) at higher replacement levels. The enhancement at low replacement levels can be attributed to particle packing, void filling, and refinement of the pore structure. Although finely ground waste glass may exhibit pozzolanic activity because of its amorphous silica content that improve matrix densification, thereby increasing stiffness. This behavior is well supported by recent findings (Chen et al., 2022) indicating that finely ground glass enhances microstructure and elastic properties through secondary hydration reactions [38]. Moreover, the improvement in mechanical performance at moderate replacement levels (≈20%) has been widely reported due to pore refinement and improved packing density. However, beyond the optimum replacement level, the modulus decreases due to dilution effects, insufficient calcium hydroxide for continued pozzolanic reaction, and increased porosity, which weakens the internal structure. Furthermore, increasing glass content leads to disruption in aggregate interlocking and increased micro voids, resulting in reduced stiffness. Similar observations were reported in previous studies (Gholampour et al., 2025).
Table 10:
Results of modulus of elasticity test
| Mix code | Modulus of elasticity (GPa) | |
|---|---|---|
| 28d | 90d | |
| G0 | 16.74 | 17.96 |
| GC10 | 16.22 | 17.35 |
| GC20 | 15.87 | 17.18 |
| GC30 | 15.42 | 16.76 |
| GC40 | 15.16 | 16.46 |
| GF10 | 17.62 | 17.82 |
| GF20 | 17.84 | 18.32 |
| GF30 | 17.31 | 17.87 |
| GF40 | 16.90 | 17.46 |
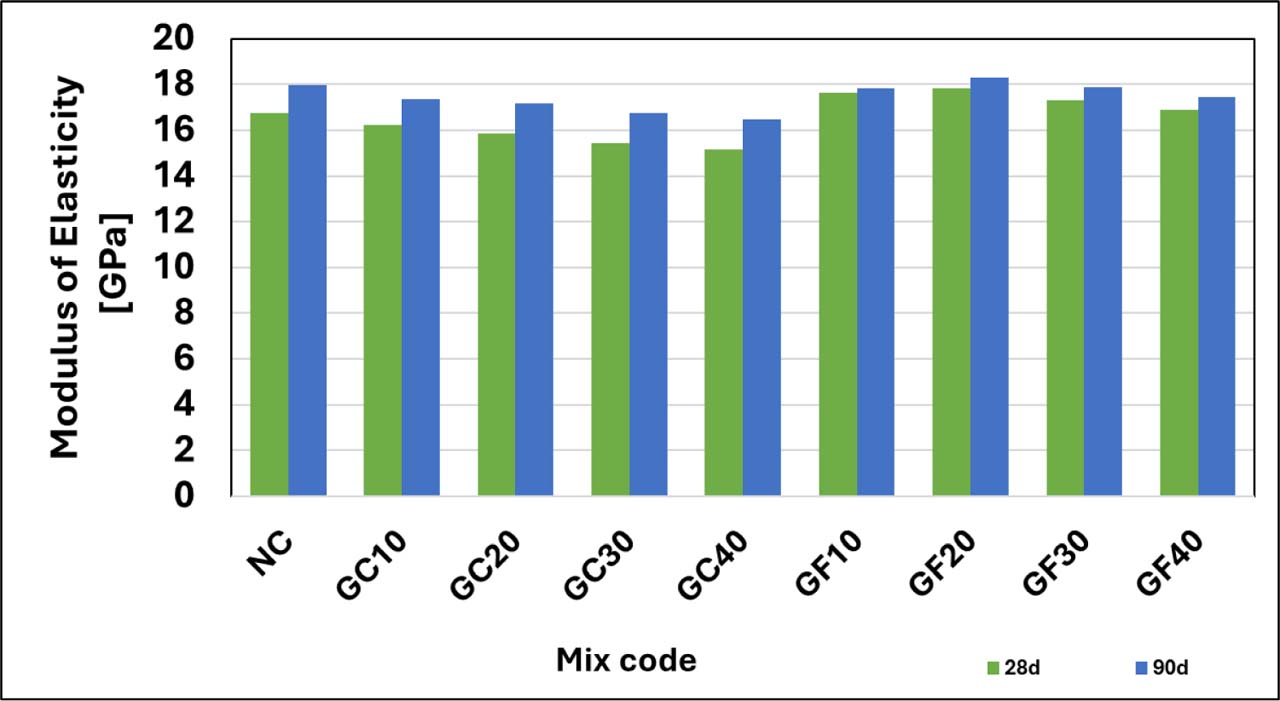
Figure 20:
Results of modulus of elasticity test
6.2.6. Impact Resistance by Drop-weight Method
Impact resistance is considered one of the key properties of LWSCC. The results of the impact resistance test for the control mix G0 and other mixes (GC and GF) at (10–40) % replacement ratios at the age of 7, 28 and 90 days are presented in Table 11 and illustrated in Figure 21. The performance was evaluated based on the number of blows required to initiate the first crack (N1) and to reach failure (N2).
For LWSCC mixtures incorporating coarse glass (GA), a general reduction in impact resistance was observed with increasing replacement ratio. At 10% replacement, a slight improvement or comparable performance was recorded; however, beyond 20%, both N1 and Nf decreased progressively, indicating reduced energy absorption capacity and increased brittleness of the concrete matrix. This behavior can be attributed to weaker ITZ and smooth surface of coarse glass particles, which limit crack bridging and promote early crack propagation. This behavior can be attributed to weaker ITZ and smooth surface of coarse glass particles, which limit effective stress transfer and promote early crack propagation, particularly at higher replacement levels. Regardless of the replacement ratio, impact resistance generally increased with treatment age from 7 to 90 days, as reflected by increase in both first-crack (N1) and failure (Nf) blow counts. This age-dependent improvement can be attributed to constant hydration and progressive densification of cementitious matrix, which enhanced matrix strength and resistance to crack initiation and propagation. Nevertheless, the relative performance of mixtures with higher coarse-glass contents remained lower, indicating that prolonged curing could improve the overall impact resistance but could not fully overcome the adverse effect of the weak glass–matrix interface. Similar findings have been reported in previous studies, where higher glass content led to reductions in tensile-related properties due to poor bonding and increased microcracking (Jassam et al., 2022).
In contrast, LESCC mixtures incorporating fine glass (GF mixtures) exhibited a noticeable improvement in impact resistance at moderate replacement levels (10–20%), where both N1 and Nf values increased related to reference mix. This enhancement is mainly attributed to filler effect and improved particle packing, which densify the microstructure and enhance crack resistance. Moreover, pozzolanic activity of fine glass particles contributes to strengthening the cement matrix, resulting in improved energy absorption under repeated impact loading. However, at greater replacement levels (30–40%), a decline in impact resistance was saw, which can be linked to particle agglomeration, increased porosity, and decrease matrix cohesion. The beneficial effect of curing age was also evident in the GF mixtures, with both N1 and Nf generally increasing from 7 to 28 and 90 days. The improvement at later ages was particularly associated with the continued development of cementitious matrix and the contribution of fine glass to particle packing and possible pozzolanic reactions. Consequently, combined effects of matrix densification and fine-glass incorporation enhanced resistance to crack initiation and failure, particularly at moderate replacement levels. These results are in good agreement with recent studies indicating that optimal glass content ranges between 10–20%, beyond which mechanical and durability properties tend to deteriorate (Ahmed & Rana, 2023) (Ubeid et al., 2020).
Table 11:
Results of the impact resistance test
| Mix code | Impact resistance (No. of blow) | |||||
|---|---|---|---|---|---|---|
| 7 days | 28 days | 90 days | ||||
| N1 | Nf | N1 | Nf | N1 | Nf | |
| NC | 7 | 12 | 16 | 24 | 26 | 33 |
| GC10 | 9 | 15 | 17 | 24 | 25 | 35 |
| GC20 | 9 | 12 | 15 | 22 | 23 | 33 |
| GC30 | 6 | 10 | 14 | 19 | 22 | 31 |
| GC40 | 6 | 8 | 14 | 17 | 21 | 29 |
| GF10 | 6 | 15 | 19 | 28 | 30 | 38 |
| GF20 | 9 | 12 | 21 | 30 | 33 | 42 |
| GF30 | 12 | 16 | 20 | 28 | 31 | 38 |
| GF40 | 12 | 21 | 24 | 30 | 32 | 37 |
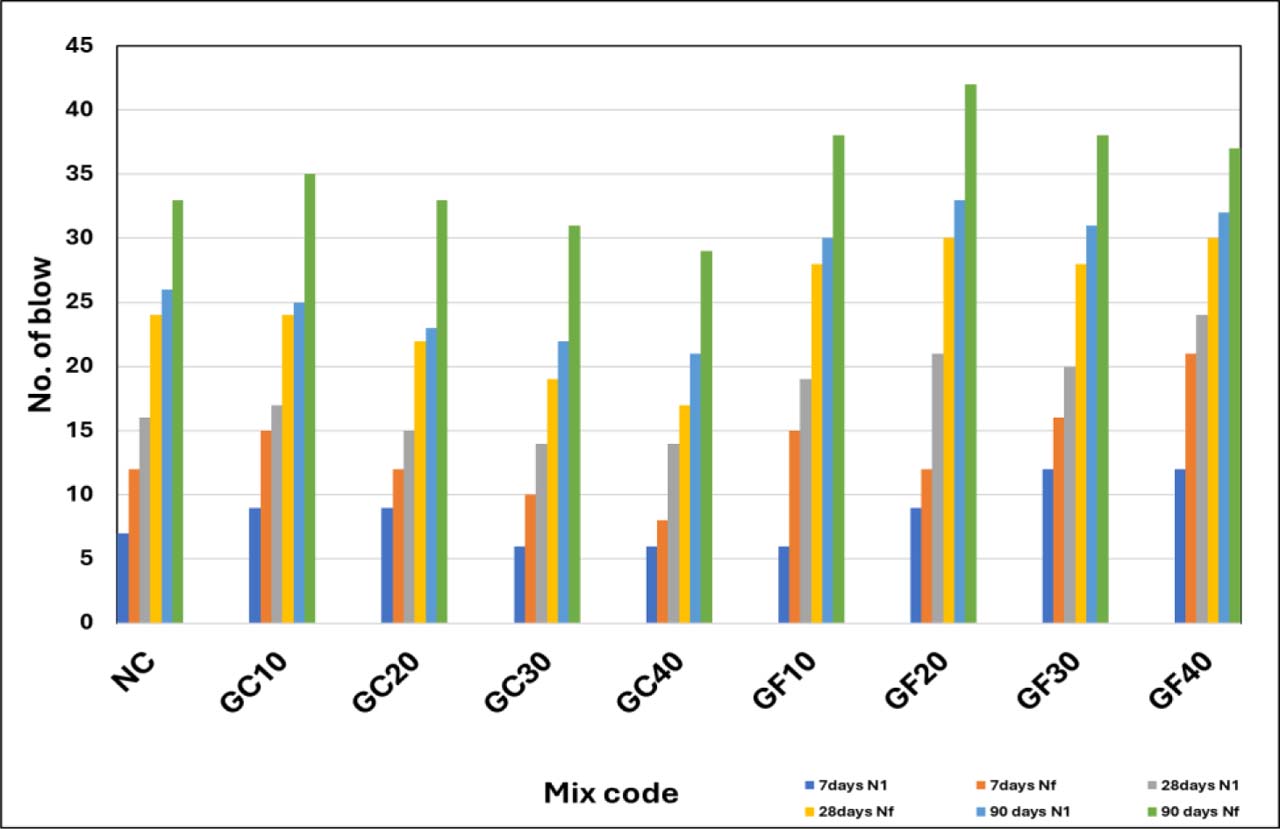
Figure 21:
Results of impact resistance test
6.3. Durability Tests Results
6.3.1. Water Absorption
The results of the water absorption resistance test for the control mix G0 and other mixes (GC and GF) at (10–40) % replacement ratios at the age of 7, 28 and 90 days are presented in Table 12 and illustrated in Figure 22.
Table 12:
Results of water absorption test
| Mix code | Water absorption [%] | ||
|---|---|---|---|
| 7 d | 28 d | 90 d | |
| G0 | 9.26 | 8.29 | 7.32 |
| GC10 | 9.48 | 8.41 | 7.47 |
| GC20 | 9.82 | 8.86 | 7.68 |
| GC30 | 9.39 | 9.11 | 7.94 |
| GC40 | 9.77 | 9.56 | 8.22 |
| GF10 | 8.65 | 7.92 | 7.12 |
| GF20 | 8.37 | 7.8 | 7.04 |
| GF30 | 8.89 | 8.11 | 7.26 |
| GF40 | 9.14 | 8.46 | 7.41 |
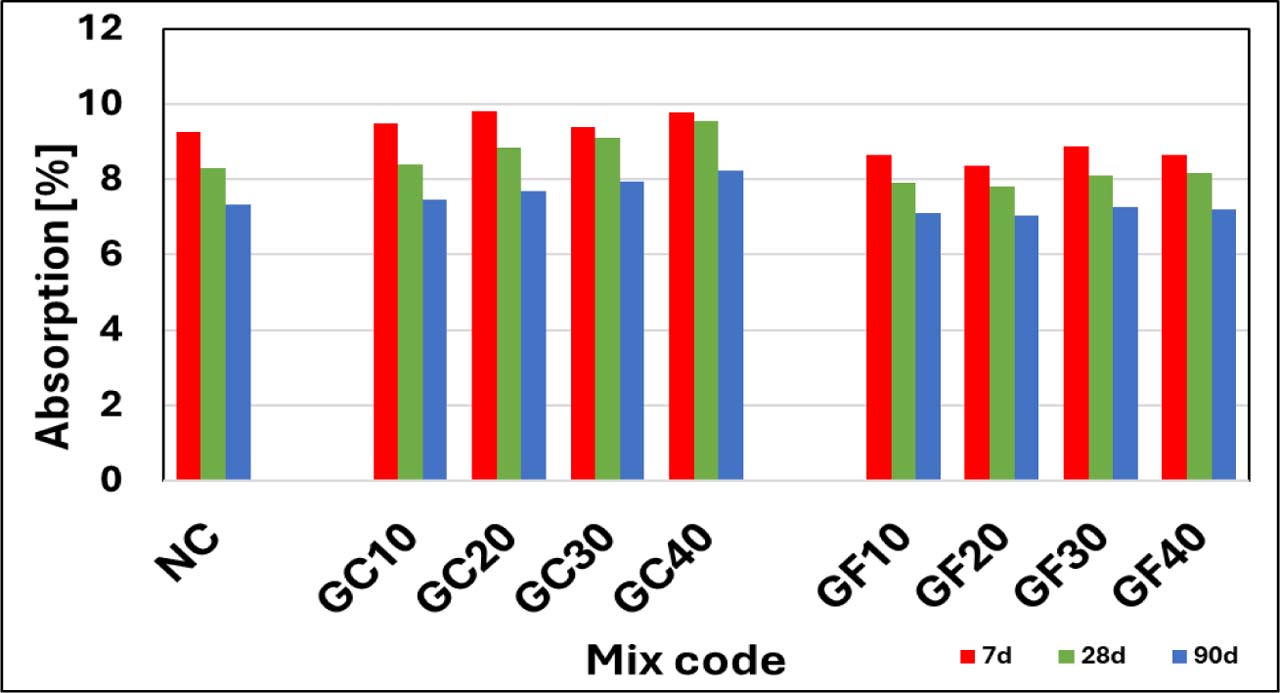
Figure 22:
Results of water absorption test
For all mixtures, the water absorption values decreased with increasing curing age, which can be attributed to the continued hydration process and the resulting refinement of the pore structure. However, the incorporation of coarse glass generally increased water absorption compared with the control mixture. At 7 days, the absorption of the control mixture was 9.26%, whereas the GC10, GC20, GC30, and GC40 mixtures recorded 9.48%, 9.82%, 9.39%, and 9.77%, respectively. These values represent increases of about 2.4%, 6.0%, 1.4%, and 5.5% relative to the control mixture. Although the results fluctuated with increasing GC content at this early curing age, all GC mixtures exhibited higher absorption than the control. At 28 days, the water absorption increased progressively from 8.29% for the control mixture to 8.41%, 8.86%, 9.11%, and 9.56% for GC10, GC20, GC30, and GC40, corresponding to increases about 1.4%, 6.9%, 9.9%, and 15.3%, respectively. A similar progressive trend was observed at 90 days, when the control mixture recorded an absorption of 7.32%, compared with 7.47%, 7.68%, 7.94%, and 8.22% for the respective GC mixtures. These results correspond to increases of approximately 2.0%, 4.9%, 8.5%, and 12.3%. The increase in water absorption associated with coarse-glass incorporation, particularly at the higher replacement ratios, may be attributed to the smooth and relatively impermeable surface of the glass particles, which can weaken the bond with the surrounding cementitious matrix. Consequently, a less compact interfacial transition zone (ITZ), containing micro-voids and interconnected capillary pores, may develop and facilitate water penetration. Nevertheless, further microstructural observations and statistical analysis are required to confirm this interpretation. Furthermore, the increase in water absorption is strongly correlated with the observed reduction in compressive strength at higher replacement levels, confirming that the deterioration in microstructure adversely affects both mechanical and durability properties. Similar trends have been reported in previous studies. (Seddik Meddah, 2019) (Kuri et al., 2023).
In contrast, mixtures incorporating fine glass (GF) generally exhibited lower water absorption than the control mixture. At 7 days, the water absorption decreased from 9.26% for the control mixture to 8.65%, 8.37%, 8.89%, and 8.64% for GF10, GF20, GF30, and GF40, respectively. These values correspond to reductions of approximately 6.6%, 9.6%, 4.0%, and 6.7%. At 28 days, the control mixture recorded a water absorption of 8.29%, whereas the corresponding values for GF10, GF20, GF30, and GF40 were 7.92%, 7.80%, 8.11%, and 8.16%, representing reductions of approximately 4.5%, 5.9%, 2.2%, and 1.6%, respectively. Similarly, at 90 days, water absorption decreased from 7.32% for the control mixture to 7.12%, 7.04%, 7.26%, and 7.21% for GF10, GF20, and GF30, corresponding to reductions of approximately 2.7%, 3.8%, 0.8%, and 1.2% respectively.
The results indicate that a 20% fine-glass replacement ratio was the best level for reducing water absorption at all curing ages. The improved performance at low and moderate fine glass contents may be attributed to the filler effect and potential pozzolanic activity of the fine glass particles, which refine the pore structure and promote the formation of additional C–S–H gel, thereby producing a denser cementitious matrix. At higher replacement ratios, however, the beneficial effect became less pronounced, possibly because of particle agglomeration and the dilution of the cementitious material. These effects may limit the availability of calcium hydroxide for pozzolanic reactions and increase the volume of accessible pores. These findings are consistent with those reported by (Chen et al., 2022) (Roy, 2025).
6.3.2. Sorptivity
When the surface of hardened concrete is submerged in water or exposed to moisture, the concrete pores absorb water by action of capillary suction and the rate at which water is absorbed is called sorptivity. Durability, deterioration under wet-dry cycle and service lifetime of concrete can be related with its rate of sorptivity. The results of capillary water absorption at 28 days of curing are presented in Table 13 and Figure 23.
The sorptivity results demonstrate a clear dependency on both glass particle size and replacement level across all curing ages (7, 28, and 90 days). For mixtures incorporating coarse glass GC, a continuous increase in sorptivity was observed with increasing replacement ratios. At 7 days, sorptivity increased from 0.068 mm/s^0.5 in the control mix to 0.073, 0.079, 0.083, and 0.087 mm/s^0.5 at 10%, 20%, 30%, and 40% replacement ratios, corresponding to increases of approximately 7.4%, 16.2%, 22.1%, and 27.9%, respectively. A similar trend was noted at 28 days, where sorptivity increased by 9.6%, 19.2%, 40.4%, and 50% for the same replacement levels. On 90 days, the increase ranged from 15.2% to 39.1%. This behavior can be attributed to the weak interfacial transition zone (ITZ) and increased porosity associated with coarse glass particles, which reduces packing density and facilitates capillary water ingress, previous studies confirmed that (Kirane et al., 2025) (Jahami et al., 2025).
In other hand, mixtures containing fine glass (GF) exhibited a reduction in sorptivity at 10% and 20% replacement ratios, followed by a slight increase at30% and 40% replacement ratios. At 7 days, sorptivity decreased from 0.068 mm/s^0.5 to 0.064 and 0.061 mm/s^0.5 at 10% and 20% replacement, representing reductions of 5.9% and 10.3%, respectively, before increasing to 0.068 and 0.071 mm/s^0.5 at 30% and 40%. A similar trend was observed at 28 days, where reductions reached 7.7% and 11.5% at 10% and 20%, respectively. At 90 days, the sorptivity decreased by up to 17.4% at 20% replacement, indicating improved durability. This reduction may be associated with the filler effect and pozzolanic reactivity of fine glass particles, which refine the pore structure and enhance matrix densification. Particle packing, void filling, and refinement of the pore structure. Although finely ground waste glass may exhibit pozzolanic activity because of its amorphous silica content, this activity can reduce capillary pores, leading to lower water absorption rates. This finding agrees with previous studies (Roy, 2025) (Raman et al., 2025).
Table 13:
Results of sorptivity test
| Mix code | Sorptivity [mm\sec0.5] | ||
|---|---|---|---|
| 7 d | 28 d | 90 d | |
| G0 | 0.068 | 0.052 | 0.046 |
| GC10 | 0.073 | 0.057 | 0.053 |
| GC20 | 0.079 | 0.062 | 0.057 |
| GC30 | 0.083 | 0.073 | 0.061 |
| GC40 | 0.087 | 0.078 | 0.064 |
| GF10 | 0.064 | 0.048 | 0.041 |
| GF20 | 0.061 | 0.046 | 0.038 |
| GF30 | 0.068 | 0.052 | 0.045 |
| GF40 | 0.071 | 0.057 | 0.053 |
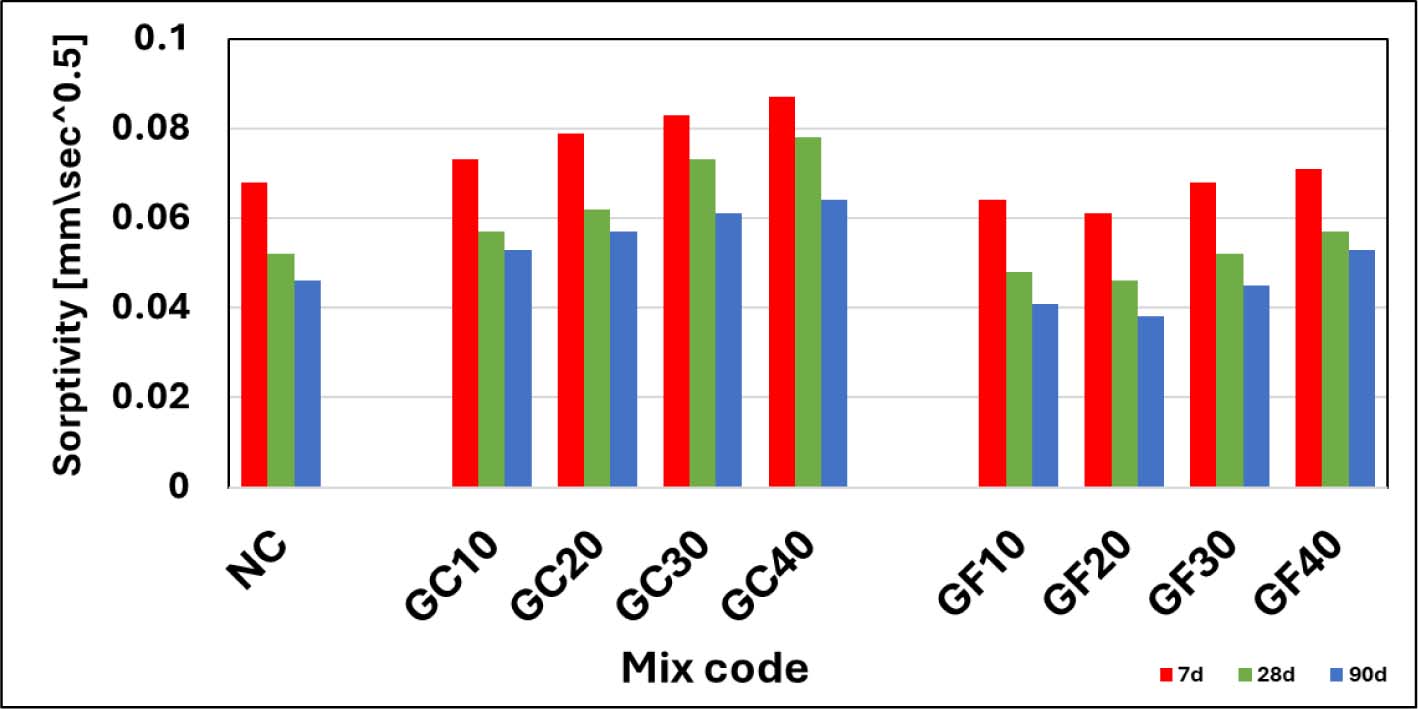
Figure 23:
Results of sorptivity test
6.3.3. Alkali-silica Reaction (ASR)
The results ASR presented in Table 14 and Figure 24
Table 14:
Alkali-silica reaction test
| Mix code | G0 | GC10 | GC20 | GC30 | GC40 | GF10 | GF20 | GF30 | GF40 |
|---|---|---|---|---|---|---|---|---|---|
| Expansion % | 0.24 | 0.23 | 0.20 | 0.17 | 0.14 | 0.21 | 0.18 | 0.15 | 0.13 |
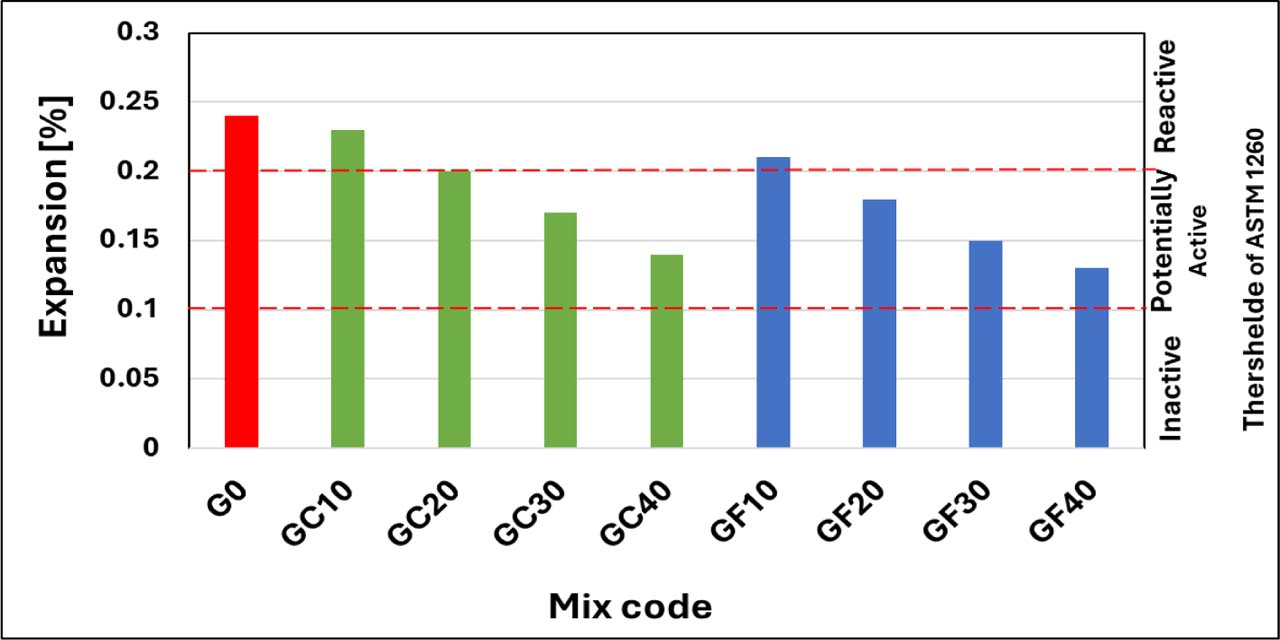
Figure 24:
Results of alkali-silica reaction test with ASTM 1260 limits
The ASR expansion results indicate that the control mixture (G0) exhibited a high expansion value of 0.24%, exceeding the ASTM C1260 limit and confirming the presence of deleterious alkali–silica reaction. The incorporation of glass as a partial replacement of sand significantly influenced the expansion behavior depending on both the replacement ratio and particle size. When replacing fine aggregate by coarse glass (GC), the expansion remained unchanged at 10% replacement (0.23%), indicating no improvement, while at 20%, 30%, and 40% it decreased to 0.20%, 0.17%, and 0.14%, compared to the control mixture G0. However, although this reduction occurred, the expansion values of GC mixtures remained relatively high, indicating that coarse glass may act as a reactive aggregate. This may be attributed to the presence of internal microcracks within larger glass particles, which facilitate ASR gel formation and expansion, this finding agreement with (Rajabipour et al., 2010). When using fine glass as a fine aggregate replacement showed a more significant reduction in expansion, decreasing from 0.21% at 10% replacement to 0.18%, 0.15%, and 0.13% at 20%, 30%, and 40%, relative to the control. This pronounced reduction indicates that fine glass is more effective in mitigating ASR expansion, particularly at higher replacement levels, where the expansion approached the non-deleterious range. The improved performance of GF mixtures is mainly attributed to its finer particle size to produce dense CSH gel by pozzolanic reaction (pozzolanic activity), reduces calcium hydroxide content, and improves the microstructure, thus controlling ASR gel formation. These findings are in good agreement with previous investigations (Gökşen et al., 2023) (Huang et al., 2021) (Kioko, 2021), which confirmed that the ASR expansion is controlled by glass particles size, where coarse glass acts as a reactive aggregate while fine glass acts as a pozzolanic material able of mitigating expansion, especially at higher replacement levels. This mechanism provides a possible literature-based explanation; however, it was not directly confirmed in the present study.
7. Scanning Electron Microscope (SEM) Analysis
Scanning Electron Microscopy analysis is a widely used technique to investigate the microstructure of cementitious composites. In this study, SEM was used to investigate the interfacial transition zone (ITZ) and the bonding between treated attapulgite aggregate, waste glass particles, and the cement matrix. This analysis helps to clarify the observed differences in mechanical and durability properties of LWSCC mixtures.
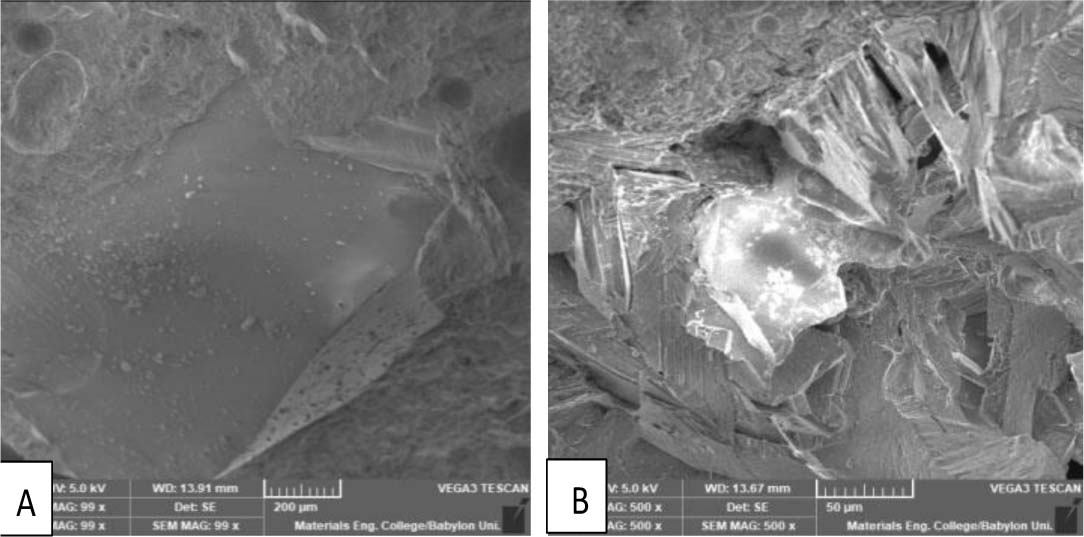
Figure 25:
SEM of LWSCC with coarse glass (GC mixture)
The SEM image as shown in the Figure (25-A) illustrates a large coarse glass particle embedded within the cementitious matrix, characterized by a smooth, dense, and non-porous surface. This smooth morphology indicates the inert nature of glass and its limited chemical interaction with the surrounding cement paste. The surface appears largely free of continuous hydration products, with only scattered fine deposits, indicating weak adhesion between the glass particle and the cement matrix. A distinct interfacial transition zone (ITZ) can be observed along the particle boundary, where slight separation and increased porosity are evident. This weak and discontinuous interface confirms that the bonding mechanism is predominantly mechanical rather than chemical. Consequently, such microstructural features may contribute to localized stress concentration and negatively affect the overall mechanical performance of the lightweight self-compacting concrete.
Figure (25-B) presented the SEM images reveal a heterogeneous microstructure composed of coarse glass particles embedded within the cementitious matrix. The SEM images of the GC mixture show coarse-glass particles with relatively smooth surfaces embedded in the cementitious matrix. Visible gaps and local discontinuities can be observed at some locations along the glass–matrix interface, suggesting a comparatively less continuous ITZ. Similar morphological observations around coarse-glass particles have been reported in previous studies. Similar observation was found by (Kuri et al., 2023; Saha et al., 2024). These qualitative observations are generally consistent with the reduction in mechanical performance recorded for the coarse-glass mixtures at higher replacement levels. However, the SEM images alone cannot determine the chemical nature or strength of the bonding between the glass particles and the cementitious matrix.
The SEM images of the GF mixture show smaller glass particles distributed within the cementitious matrix and a comparatively more uniform morphology in the examined regions. The glass-matrix interface appears more continuous, with fewer visible gaps than those observed around the coarse-glass particles. The smaller particles may have contributed to improved physical packing and void filling, as shown in Figure (26 A&B). Similar results were observed by (Ogrodnik et al., 2024) (Tong et al., 2024).
Fine glass particles distributed over the surface of lightweight Attapulgite aggregate treated with cement mortar. The particles appear as angular shapes with smooth surfaces, showing their non-porous and inert glassy nature. It can be observed that these particles are distributed on a cementitious matrix covered Attapulgite aggregate enriched with hydration products, without being embedded within it. However, the fine size of the glass particles contributes to filling surface voids and improving microstructural packing, resulting in a more homogeneous structure. Compared with coarse glass, no dispersed glass particles were observed on the surface of the aggregate, as coarse glass tends to remain embedded only within the matrix as shown in Figure (26 C).
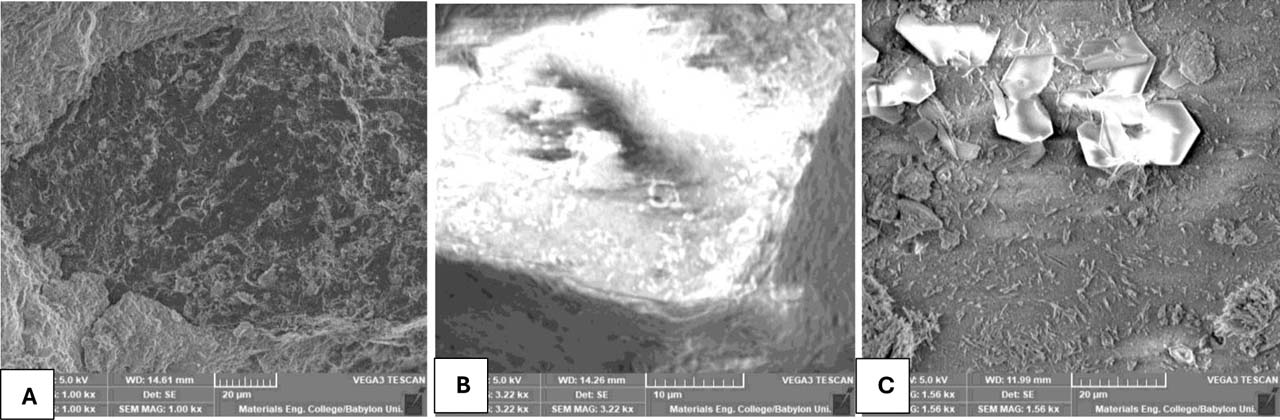
Figure 26:
SEM of LWSCC with fine glass (GF mixture)
8. Limitations
This study was limited to laboratory-scale evaluation of LWSCC incorporating recycled waste glass as a partial replacement for fine aggregate. Only two particle size ranges and replacement levels of 0–40% by mass of of natural fine aggregate were investigated using a single mix design and specific material sources. Long-term field performance, aggressive environmental exposure, and the structural behavior of reinforced concrete members were not considered and require further investigation.
9. Conclusions
All mixtures GC and GF satisfied EFNARC requirements, confirming that waste glass can be used without compromising self-compacting behavior. GC mixtures showing a low enhancement in slump flow at 20% (+0.7%) and a reduction at 40% (−4.3%), while GB mixtures exhibited a continuous decrease attaining (−5%) at 40%. The T500 and V-funnel results indicated increased viscosity for GF with 30% and 40% replacement levels, whereas GC showed relatively stable or slightly improved flow due to reduced internal friction. Moreover, the L-box ratio for all mixtures GC and GF remained within EFNARC limits. The T500 results showed that GC10 and GC20 had slightly faster initial flow than the control, whereas GC30 and particularly GC40 exhibited higher flow times. The GF mixtures showed a progressive increase in T500 with increasing fine-glass content, indicating increased apparent viscosity and slower flow.
The incorporation of waste glass reduced both fresh and equilibrium density, where the fresh density decreased from 1890 kg/m3 to 1852 kg/m3 (−2.01%) for GC and to 1846 kg/m3 (−2.33%) for GF at 40% replacement showing its effectiveness in producing structural lightweight concrete.
The compressive strength results show that GC mixtures decreased with increasing glass content, where the strength dropped from 25.11, 30.03, and 32.63 MPa for reference mixture to 22.51, 27.44, and 29.72 MPa at 7, 28, and 90 days, respectively. Also, GF mixtures showed improved performance at 20%, reaching 25.93, 32.21, and 33.18 MPa at 7, 28, and 90 days. However, at replacement levels 30% and 40%, observed a reduction in strength, indicating that the best replacement level was 10% for GC and 20% for GF mixtures.
Durability properties of GC and GF were greatly affected by glass particle size and replacement percentage. GC mixtures a continuous increase in water absorption was observed, at 40% replacement show increasing about +12.3% at 7 days and +15.3% at 28 days and +5.5% at 90 days, while sorptivity increased by approximately +27.9% compared with reference mixture, indicating a more porous structure. In contrast, GF mixtures improved durability at moderate levels, where water absorption decreased by about −3.8% at 7 days, −5.9% at 28 days, and −9.6% at 90 days at 20% replacement, while sorptivity decreased by approximately −11.5%. However, at 30% and 40%, both water absorption and sorptivity were increased.
GC mixture replacement levels (10%) and GF at 10–20% replacement levels exhibited the best-performing level among the investigated mixtures. At 30–40% replacement levels, GC and GF mixtures offer significant advantages, including reduced density, improved sustainability, and adequate fresh properties. These mixtures may have potential for lightweight applications; however, their suitability for reinforced structural elements requires further member-scale testing and long-term performance evaluation. For non-structural applications, such as blocks and panels, their use remains subject to the relevant performance and durability requirements.
Acknowledgements
The authors would like to thank the Civil Engineering Department, University of Babylon, for providing laboratory facilities.
Notes
[1] Contributed by Author Contributions
L.G.S. contributed to conceptualization, methodology, investigation, data curation, formal analysis, visualization, and writing-original draft. A.H.N. contributed to supervision, validation, writing—review and editing, and project administration. All authors critically reviewed and approved the final version of the manuscript and agreed to be accountable for all aspects of the work.