

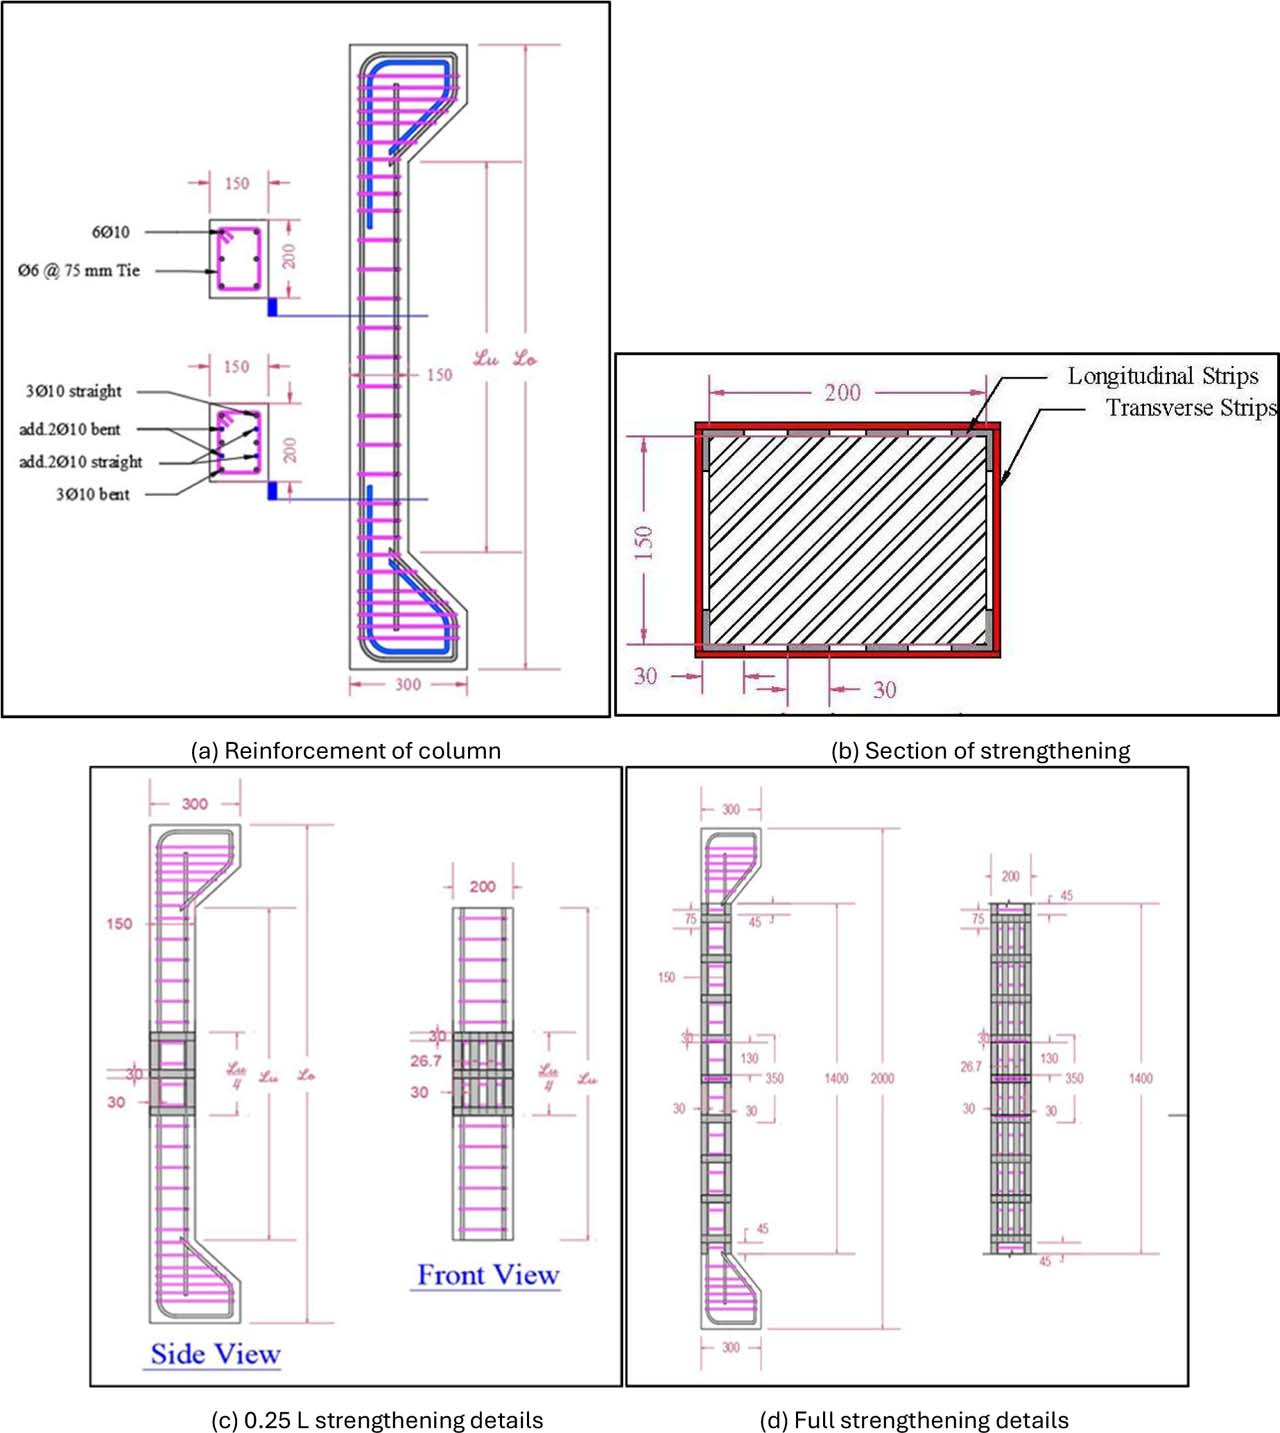
Figure 1:
Schematic details of column with strengthening
Table 1:
Details of column specimens
| Groups | Col. No. | Column designation | Length ℓu [m] | Eccentricity e [mm] | e / h |
|---|---|---|---|---|---|
| Without strength | 1 | C0E45L1.4 | 1.4 | 45 | 0.3 |
| 2 | C0E90L1.4 | 1.4 | 90 | 0.6 | |
| 0.25L strength | 3 | C0.25E45L1.4 | 1.4 | 45 | 0.3 |
| 4 | C0.25E90L1.4 | 1.4 | 90 | 0.6 | |
| Full strength | 5 | Cf E45L1.4 | 1.4 | 45 | 0.3 |
| 6 | Cf E90L1.4 | 1.4 | 90 | 0.6 |
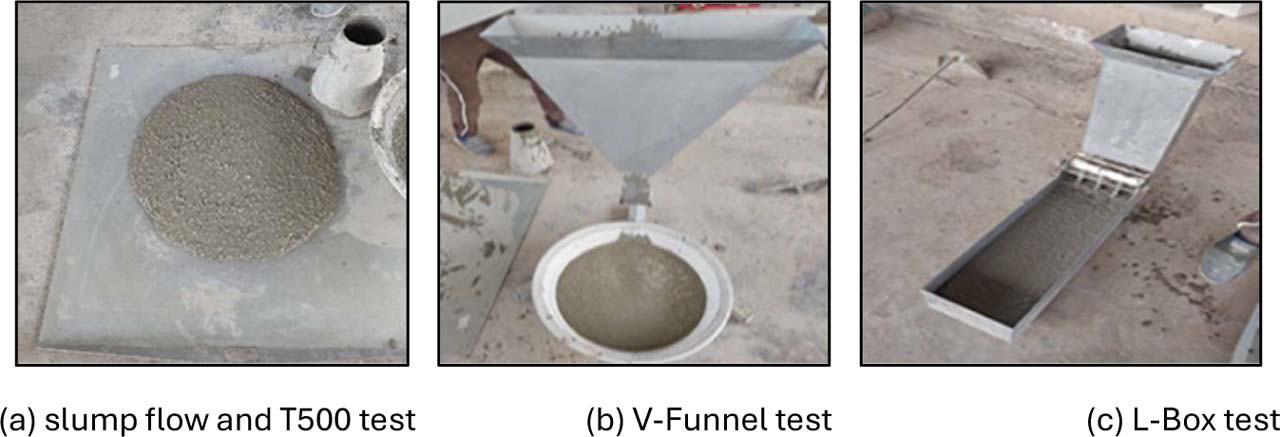
Figure 2:
Fresh concrete tests
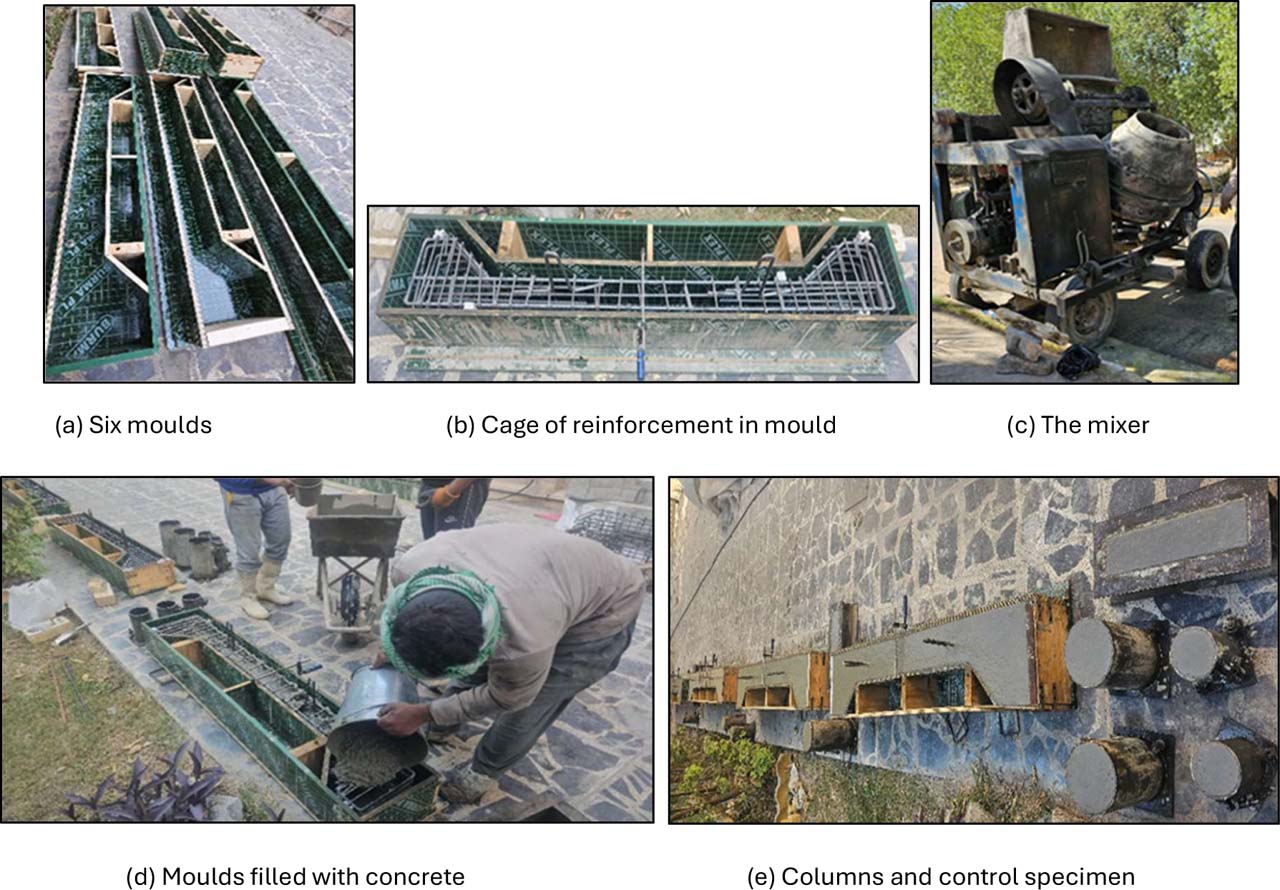
Figure 3:
Casting process of concrete
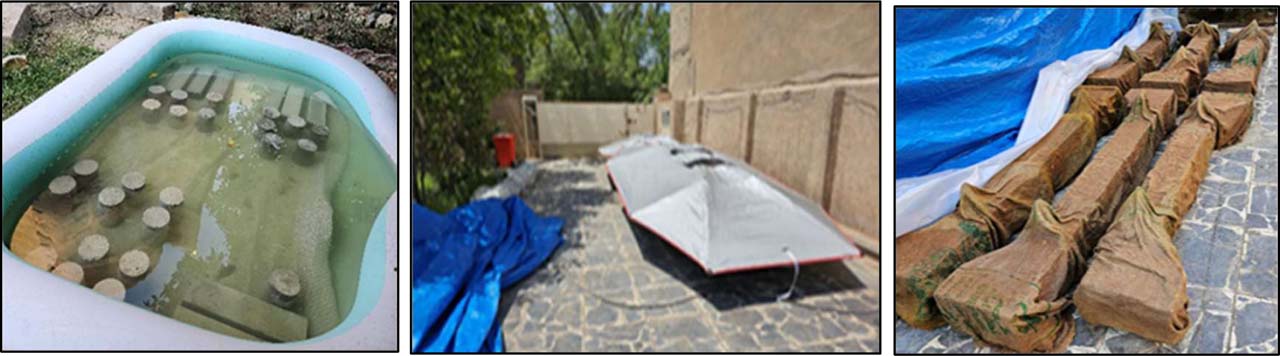
Figure 4:
Curing process

Figure 5:
Strengthening process
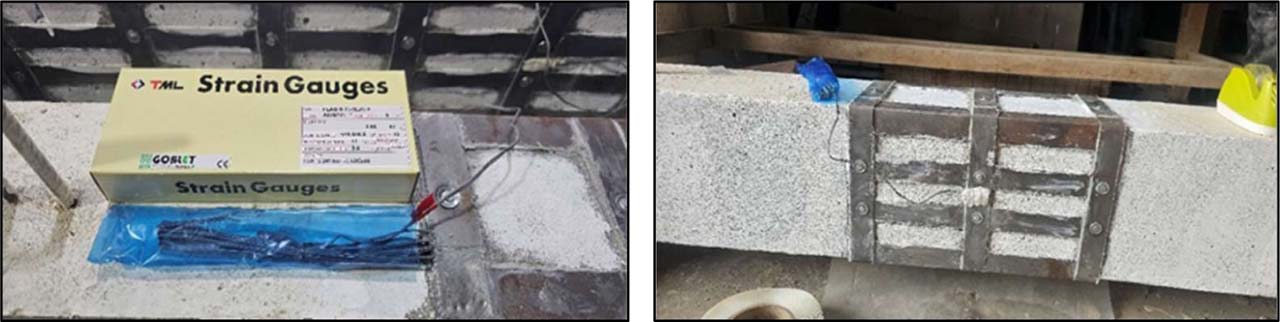
Figure 6:
Strain gage
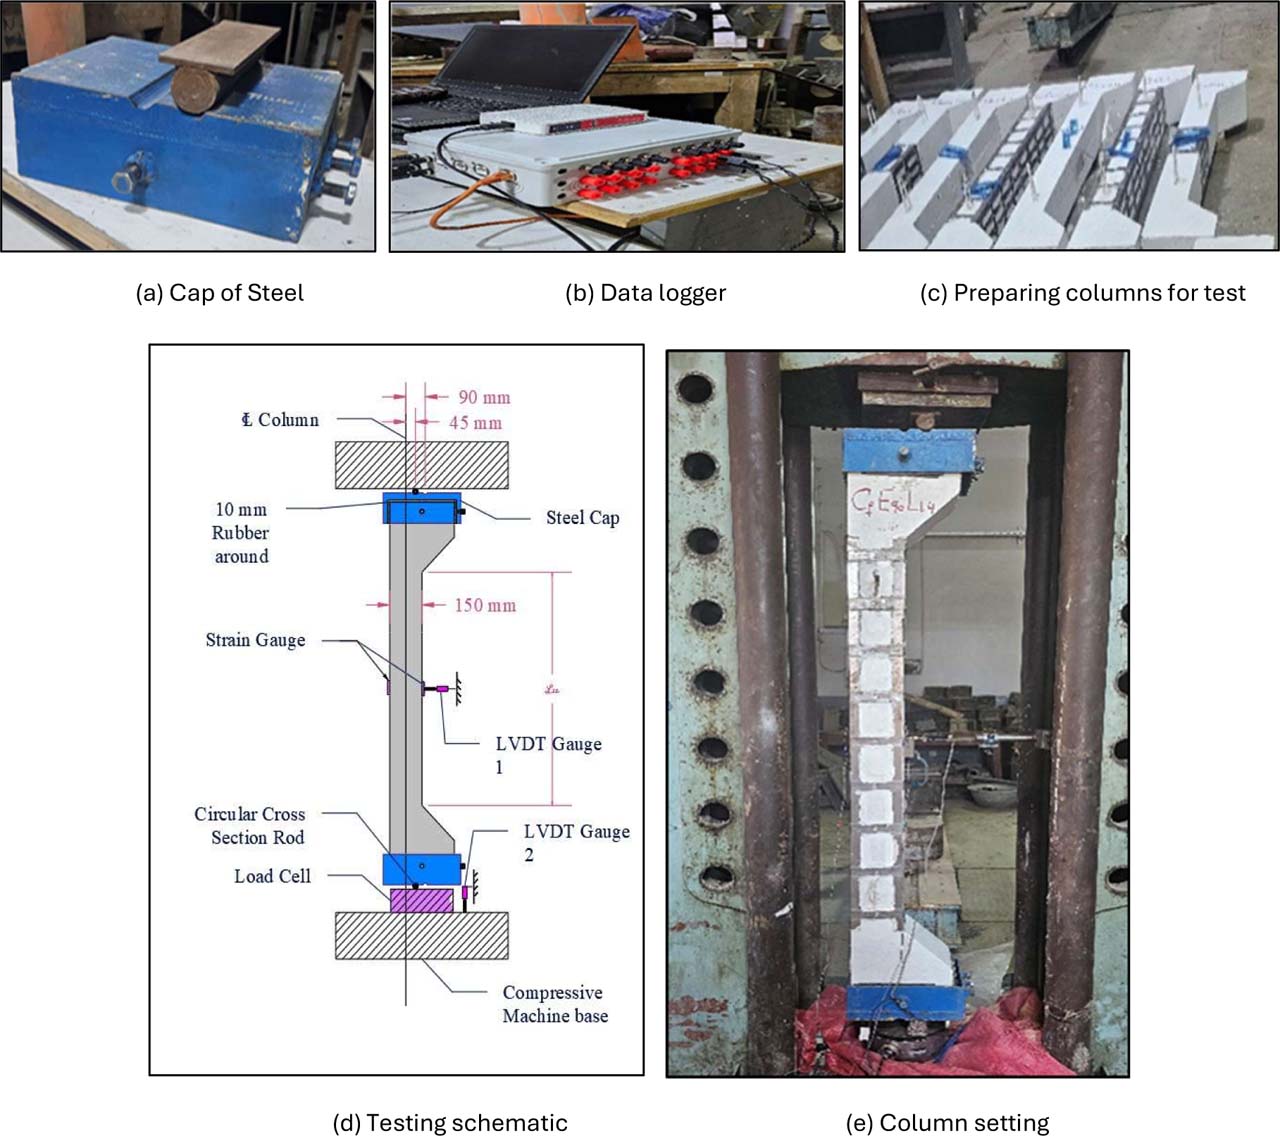
Figure 7:
Testing procedure and instrumentation
Table 2:
Test results of columns
| Groups | Col. No. | Column designation | First crack load Pcr [kN] | Ultimate load Pu test [kN] | Lateral displacement ∆L @ Pu [mm] | Energy absorption [EA] [kN.mm] | *Energy absorption capacity [EAC] [kN.mm/mm] |
|---|---|---|---|---|---|---|---|
| Without strength | 1 | C0E45L1.4 | 125 | 293.87 | 19.09 | 3836.81 | 201.00 |
| 2 | C0E90L1.4 | 60 | 136.02 | 19.25 | 1534.30 | 79.66 | |
| 0.25 L strength | 3 | C0.25E45L1.4 | 147 | 306.36 | 18.36 | 4045.90 | 220.40 |
| 4 | C0.25E90L1.4 | 65 | 151.68 | 18.606 | 1733.00 | 93.14 | |
| Full strength | 5 | Cf E45L1.4 | 165 | 360.04 | 18.09 | 4640.06 | 256.51 |
| 6 | Cf E90L1.4 | 160 | 185.75 | 18.28 | 2513.30 | 137.50 |
Table 3:
Results of testing hardened SCC
| Test | Compressive strength f′c [MPa] ASTM C39 / C39M | Splitting tensile strength ft [MPa] ASTM C496 | Flexural strength fr [MPa] ASTM C78 | Static modulus of elasticity Ec [GPa] ASTM C469 | |||
|---|---|---|---|---|---|---|---|
| Age (days) | 7 | 28 | 7 | 28 | 7 | 28 | 28 |
| Experimental results | 19.24 | 23.22 | 2.47 | 2.55 | 3.48 | 4.1 | 25.337 |
| Theoretical results calculated by ACI 318 M-19 formulas | 2.46 | 2.70 | 2.72 | 3.00 | 22.647 | ||
| Difference [%] | ---- | 94.4 | ---- | 137 | ---- | ||
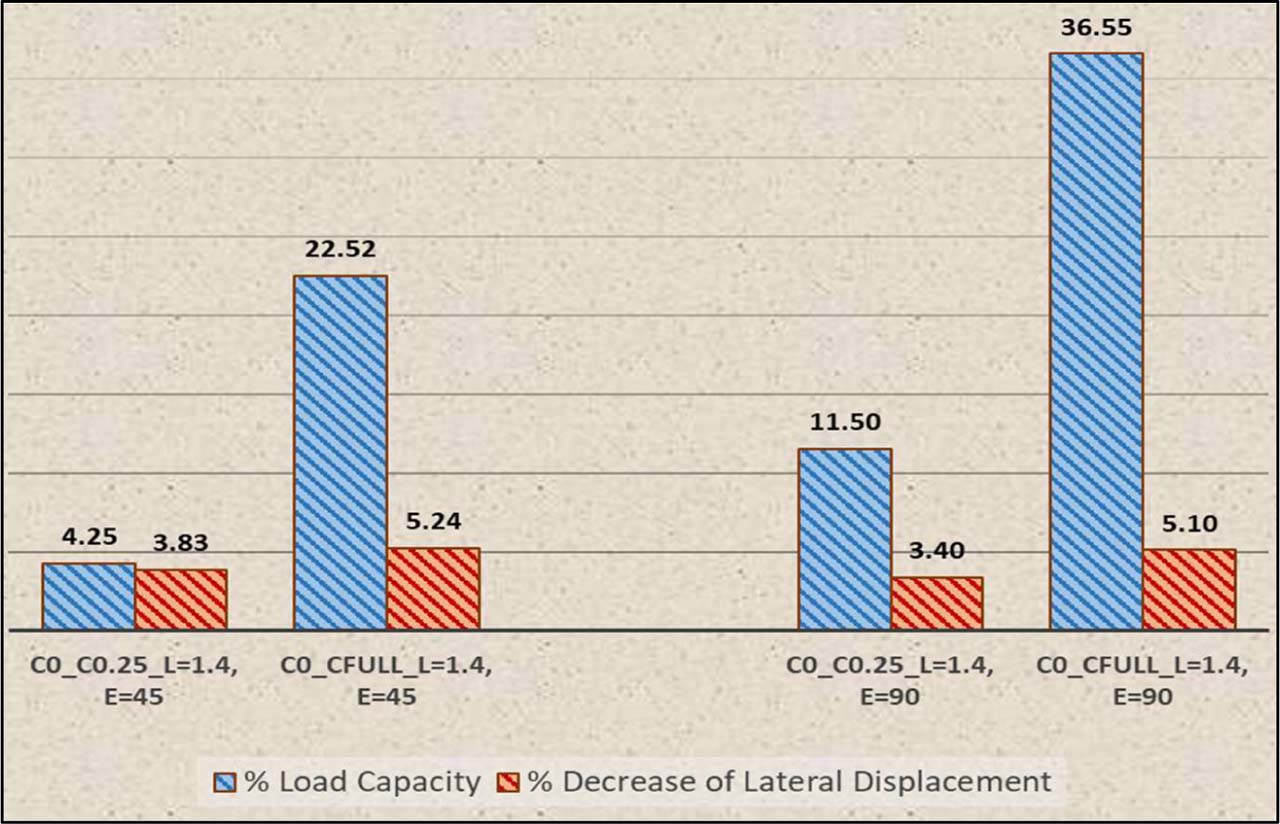
Figure 8:
Ratio between un-strengthened and strengthened columns for decrease of lateral displacement and load capacity (%)
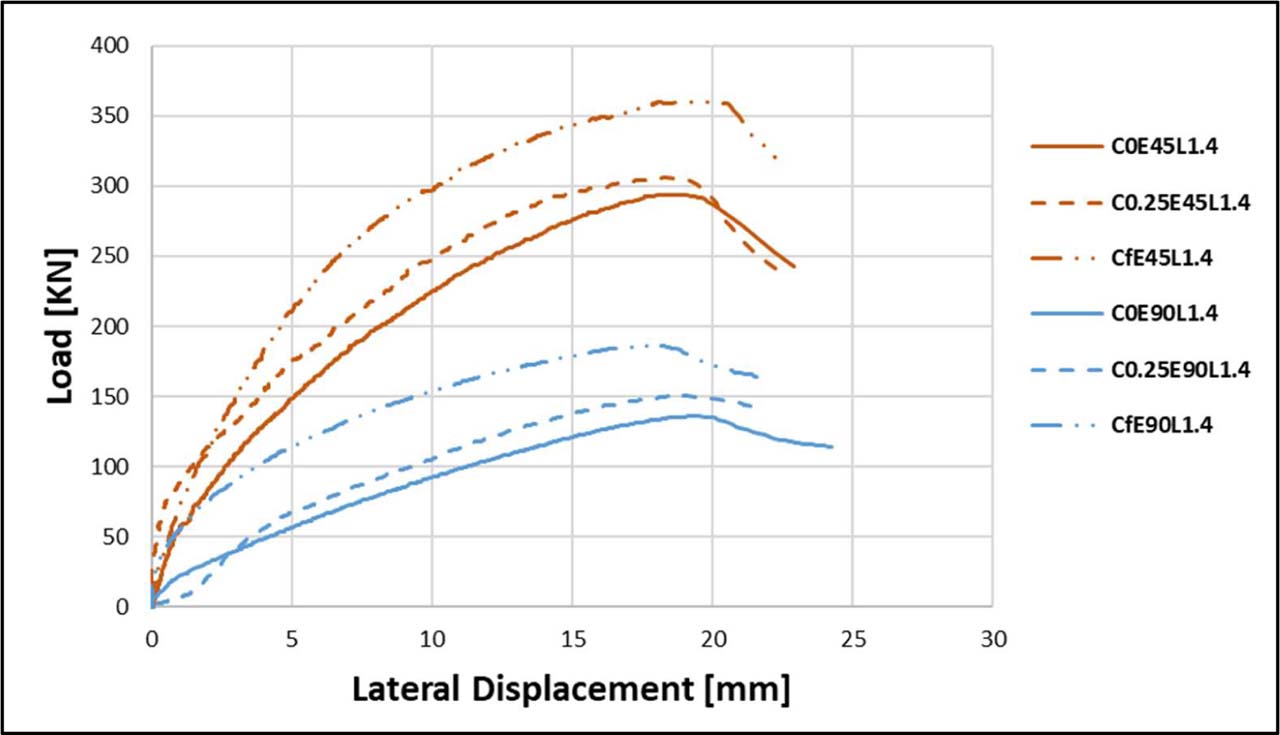
Figure 9:
Curve of load-lateral displacement at mid-height
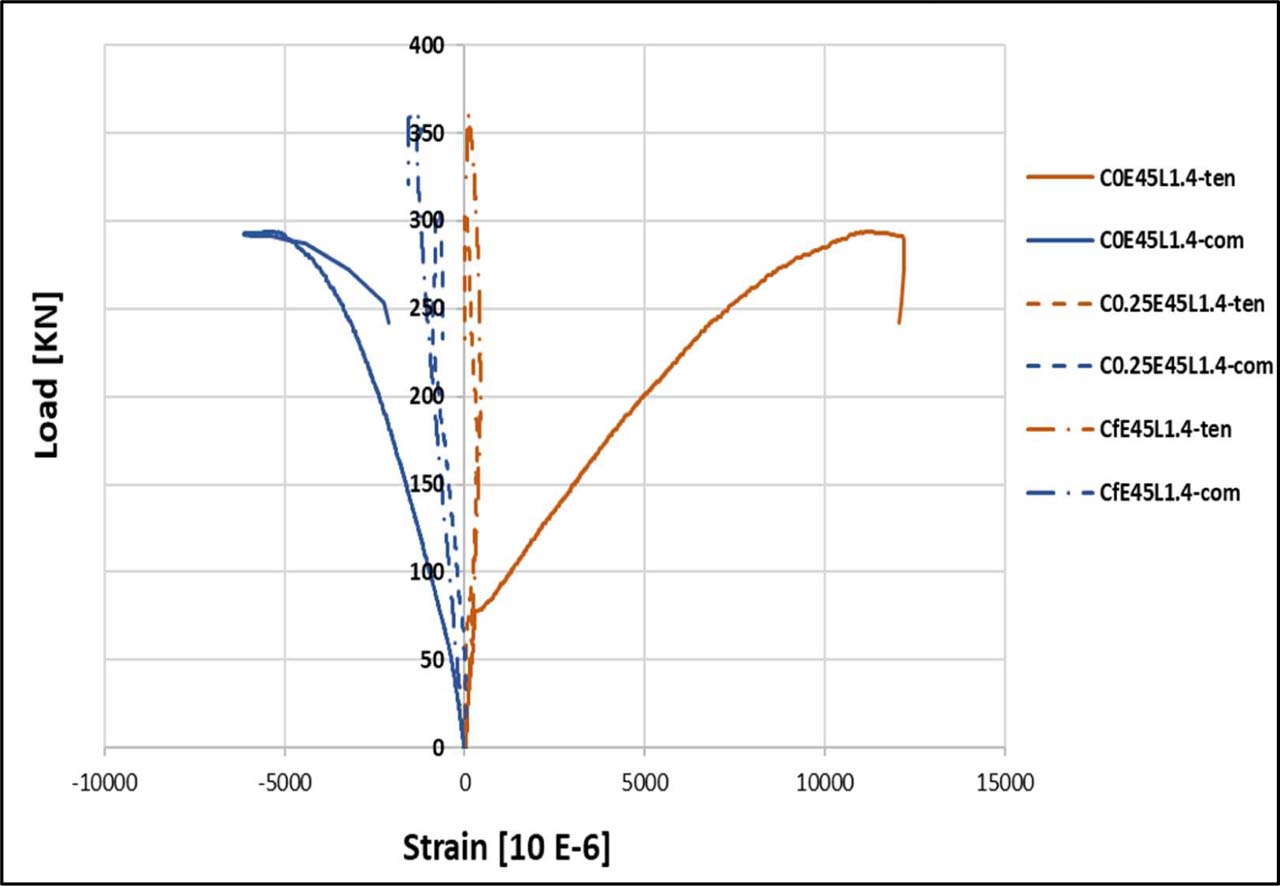
Figure 10:
Curve of load-strain at mid-height under - e (45)
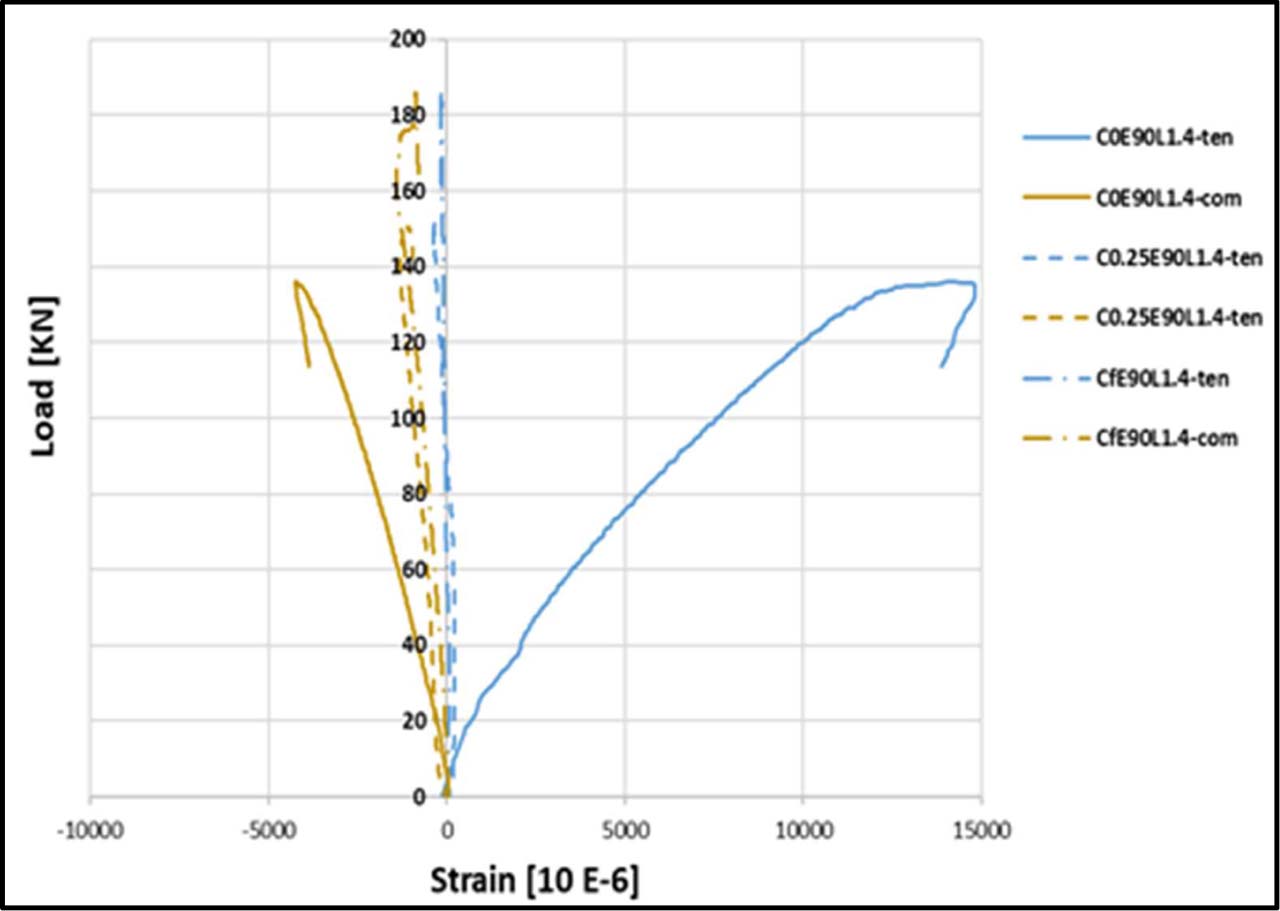
Figure 11:
Curve of load-strain at mid-height under - e (90)
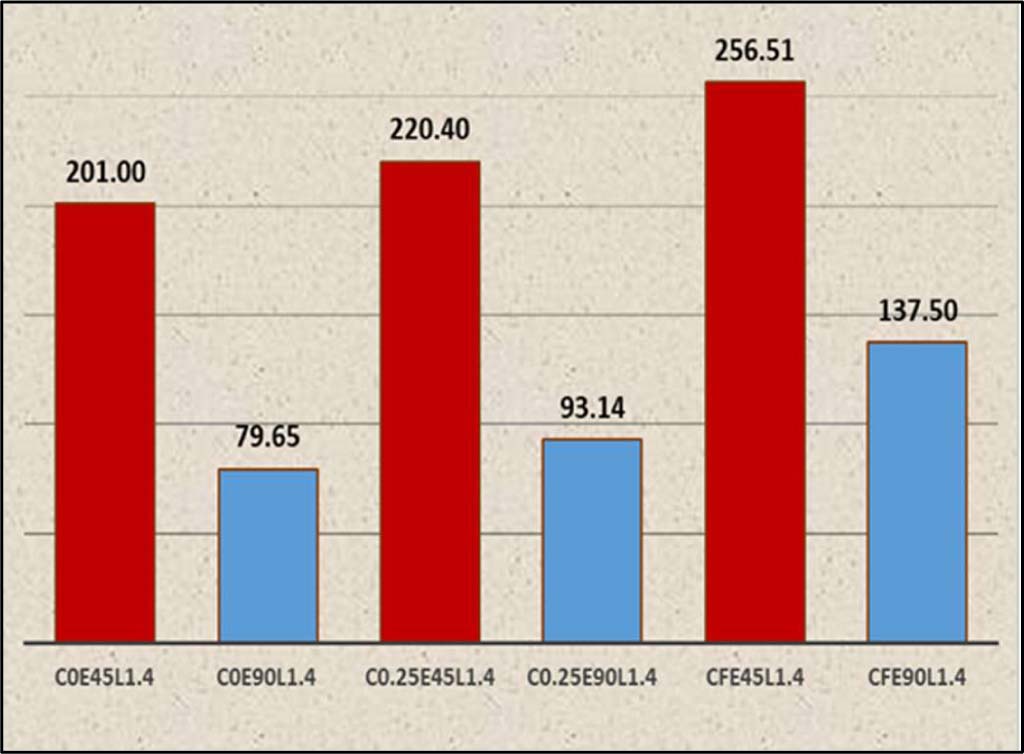
Figure 12:
Energy absorption capacity of tested columns (kN.mm/mm)
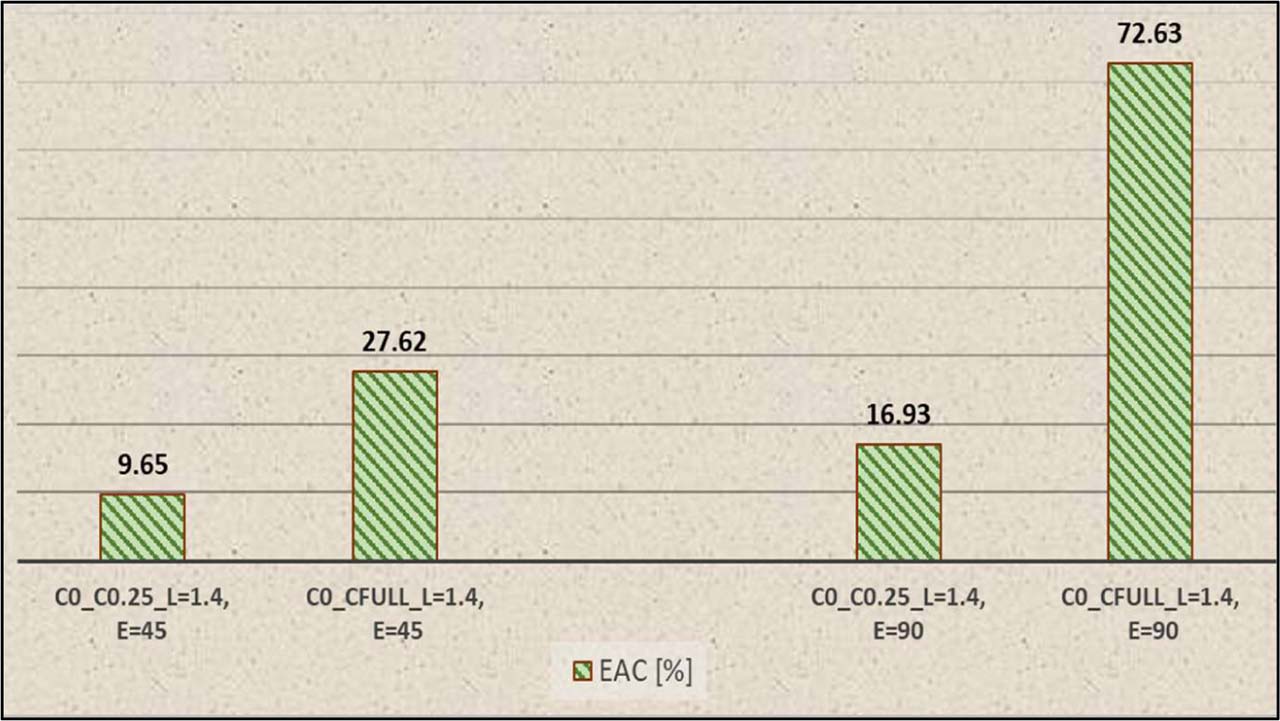
Figure 13:
Increase in energy absorption capacity of tested columns [%]
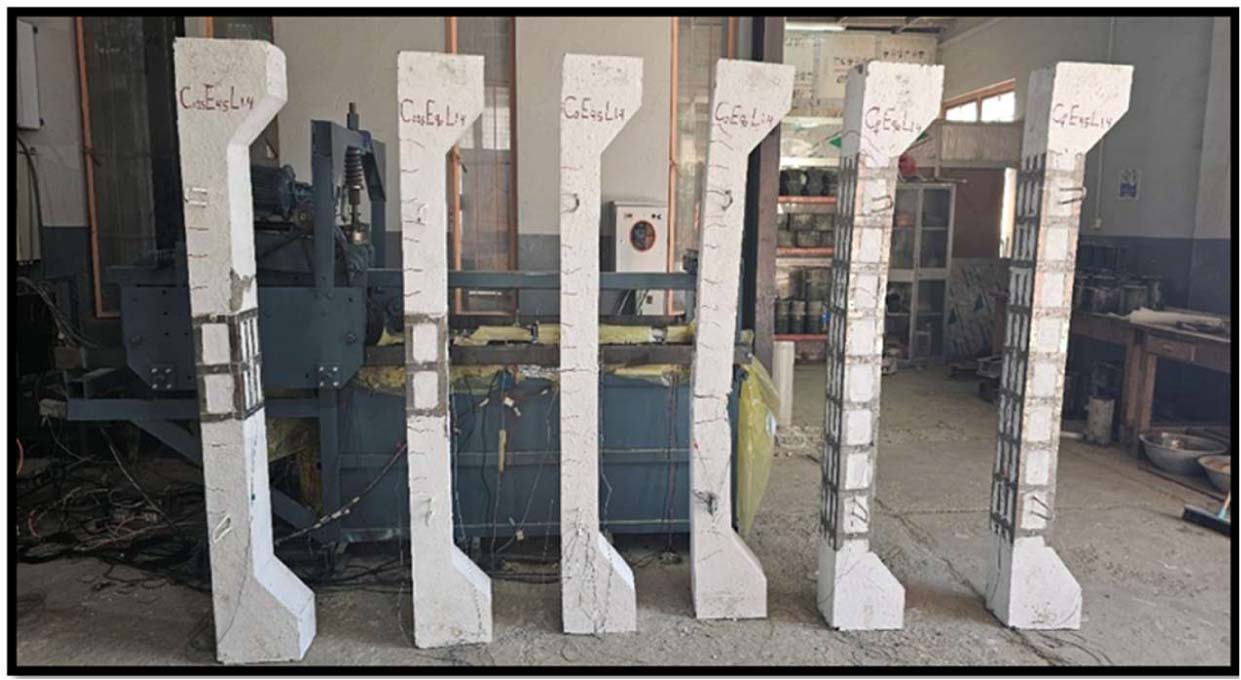
Figure 14:
Failure of all columns
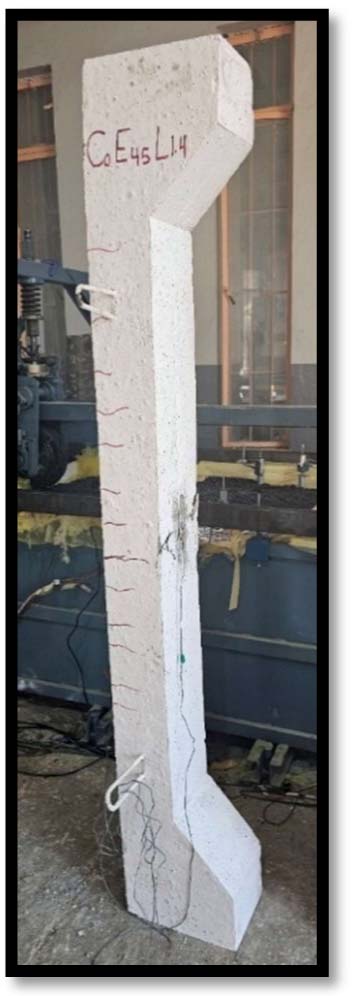
Figure 15:
C0E45L1.4
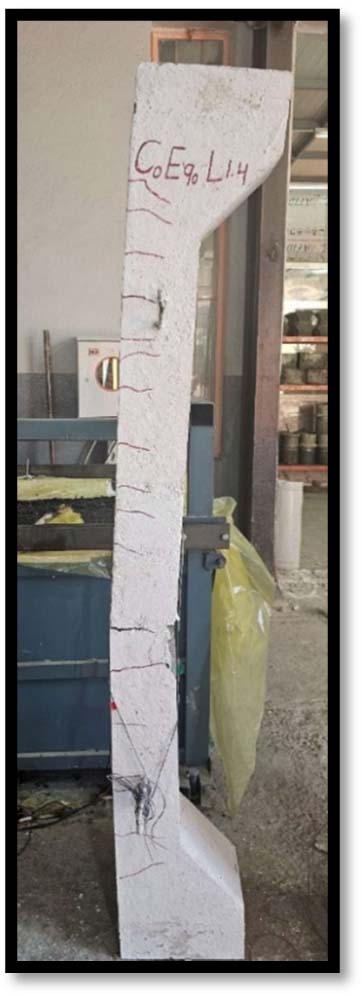
Figure 16:
C0E90L1.4
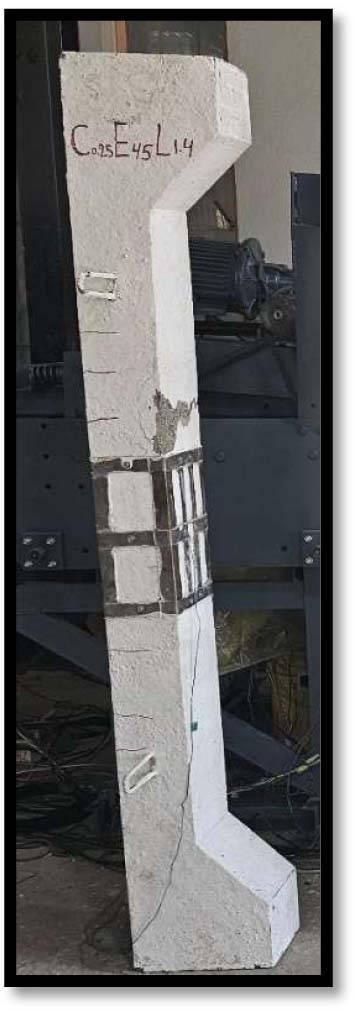
Figure 17:
C0.25E45L1.4
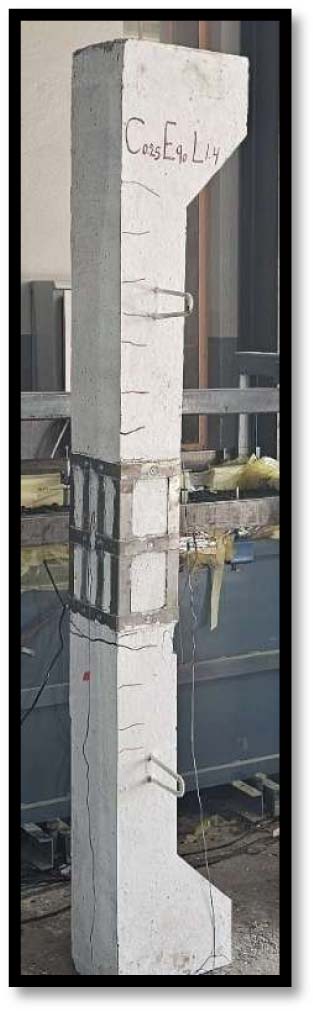
Figure 18:
C0.25E90L1.4
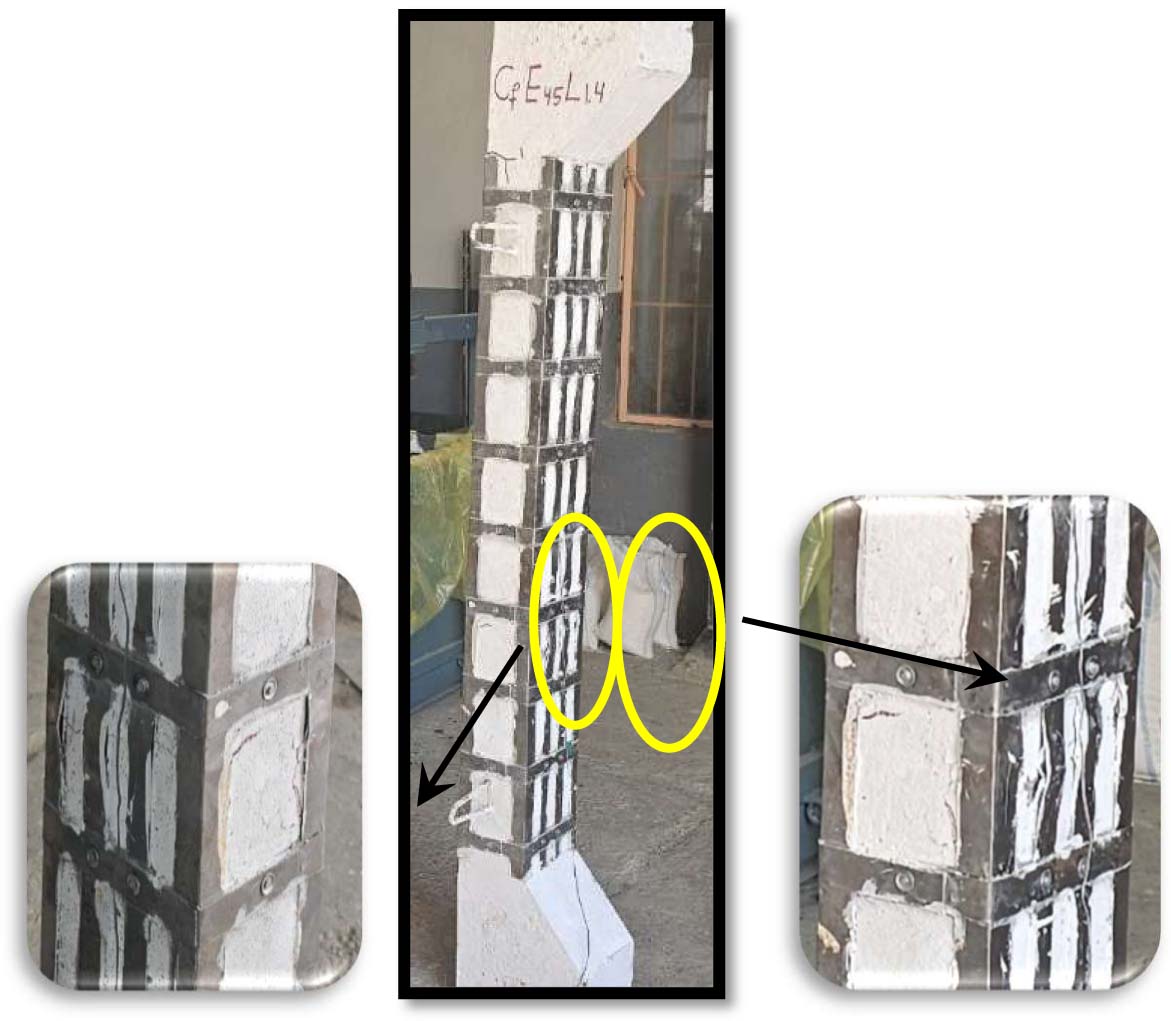
Figure 19:
Cf E45L1.4
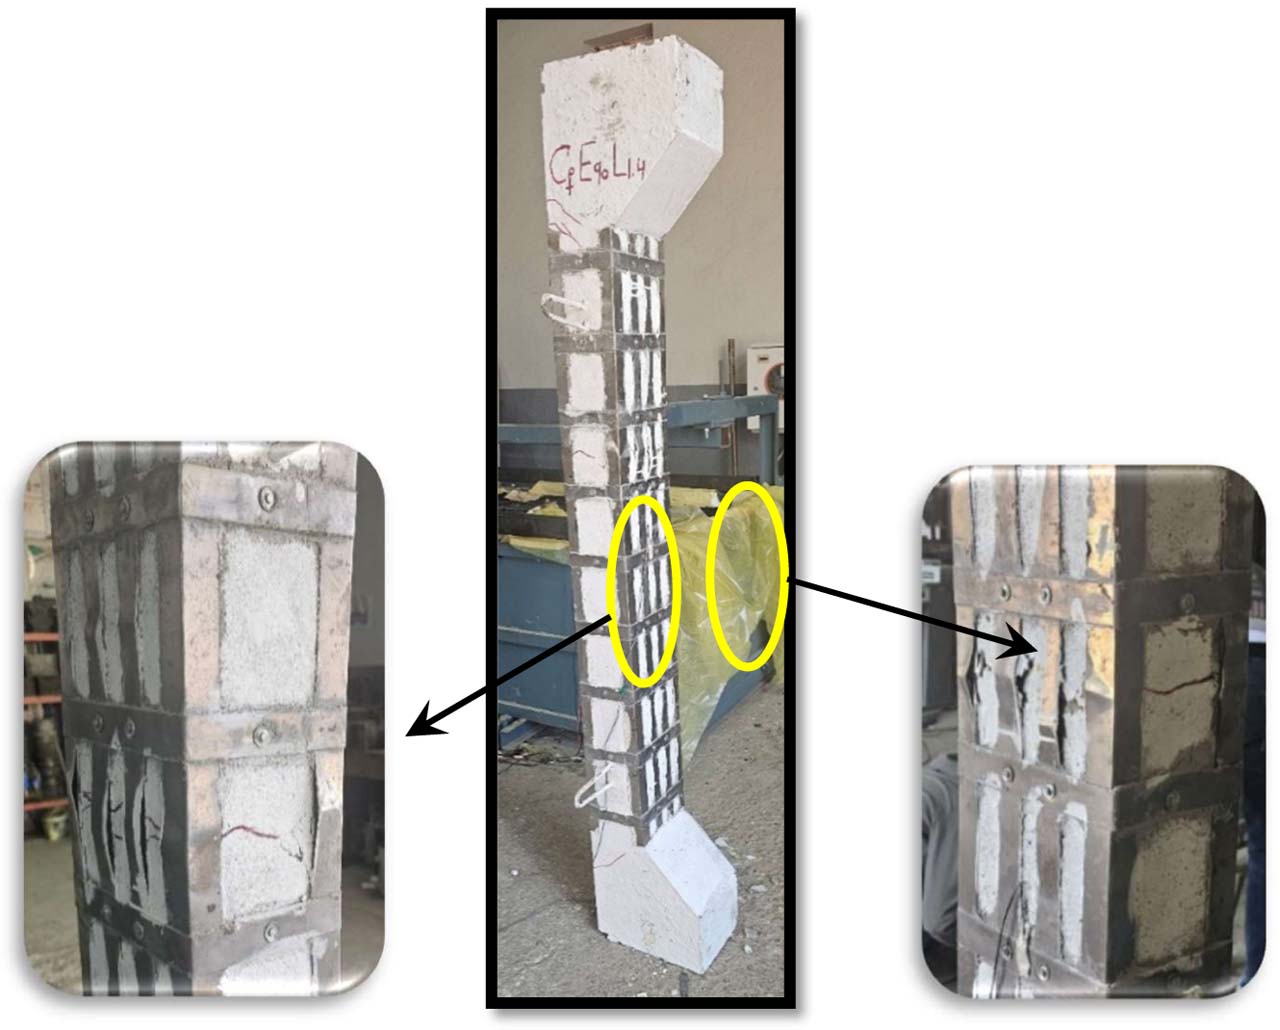
Figure 20:
Cf E90L1.4
Table 4:
Ratio between Ultimate Test Load to Volume of Steel Strengthening (Efficiency Percentage)
| e [e/h] | Col. No. | Column designation | Ultimate load Pu Test [N] | *∆ Pu Test [N] | Volume of strengthening vol. [mm3] | ∆Pu test / vol. [Efficiency %] [N/mm3] |
|---|---|---|---|---|---|---|
| 45 [0.3] | 1 | C0E45L1.4 | 293.87×10³ | ---- | ---- | ---- |
| 2 | C0.25E45L1.4 | 306.36×10³ | 12490 | 94500 | 13.22 | |
| 3 | Cf E45L1.4 | 360.04×10³ | 66170 | 346500 | 19.10 | |
| 90 [0.6] | 4 | C0E90L1.4 | 136.03×10³ | ---- | ---- | ---- |
| 5 | C0.25E90L1.4 | 151.68×10³ | 15650 | 94500 | 16.56 | |
| 6 | Cf E90L1.4 | 185.75×10³ | 49720 | 346500 | 14.35 |