

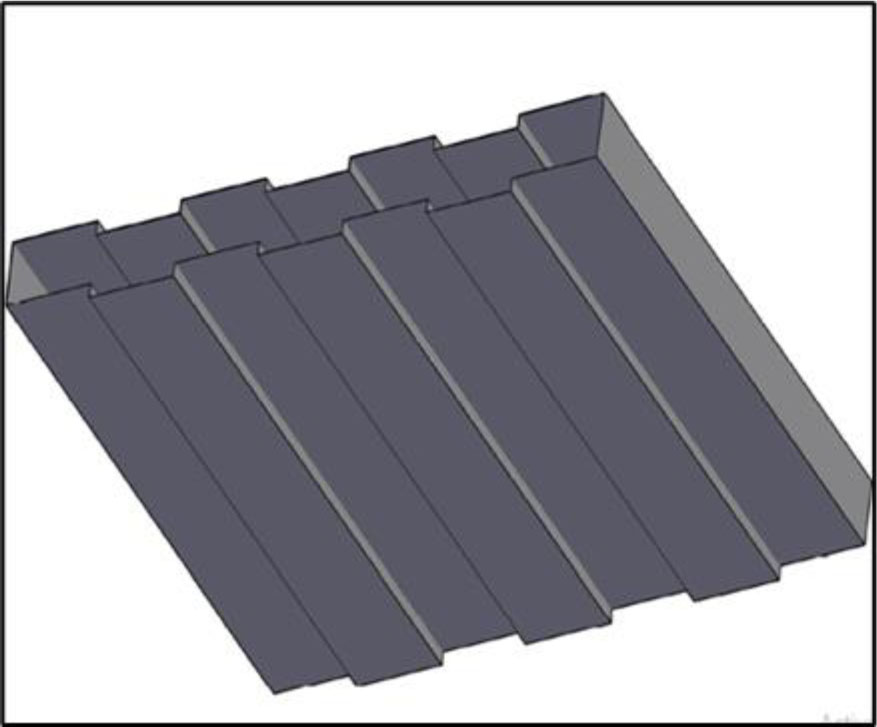
Figure 1:
Representative Schematic view of the ribbed steel face-sheet geometry used in the sandwich panels
Table 1:
Mix proportion of the adopted foamed concrete mixes
| Mix ID | ||
|---|---|---|
| M1 by weight | M2 by weight | |
| Cement [kg/m3] | 180 | 450 |
| Water [kg] | 125 | 183.2 |
| Sand [kg/m3] | 200 | 292.5 |
| Silica fume [kg/m3] | 20 | - |
| Fibers [kg/m3] | 0.9 [glass fibre] | 0.9 [polypropylene fibre] |
| Foam [kg/m3] | 44 | 44 |
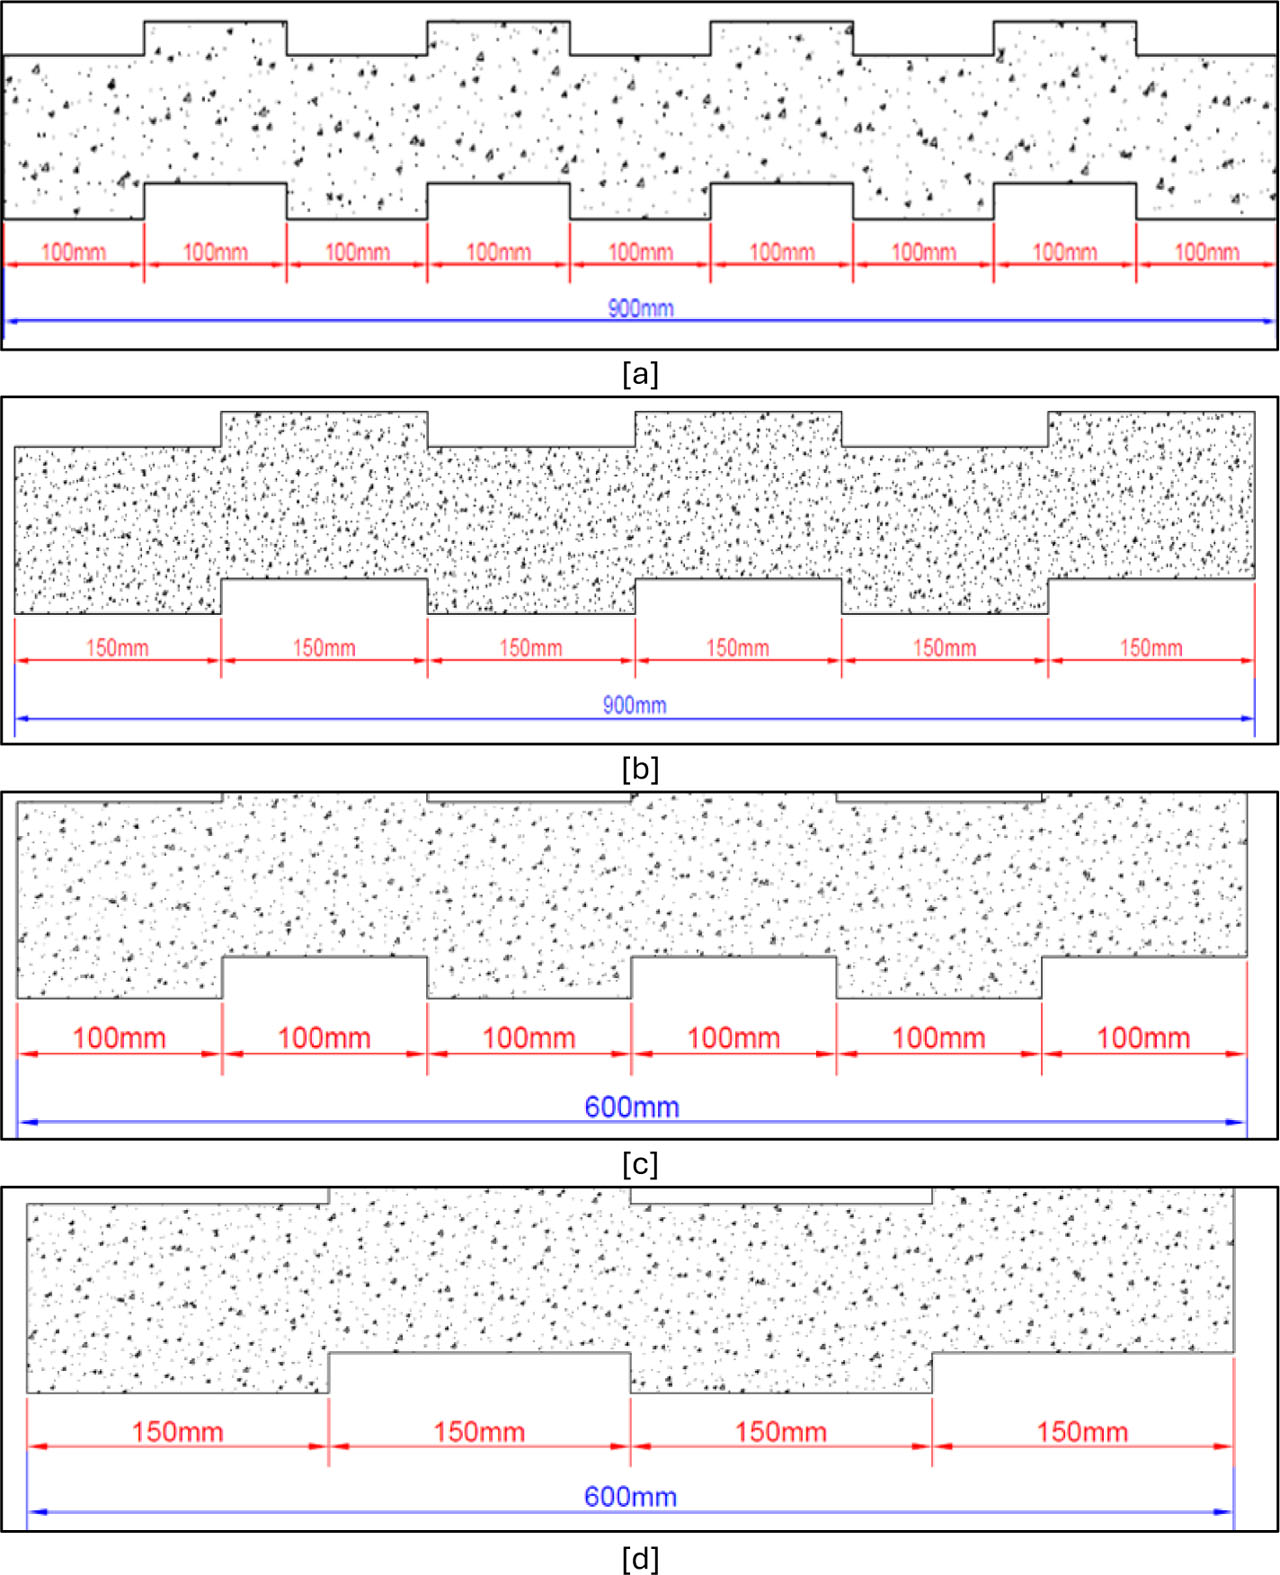
Figure 2:
Ribbed sandwich panel specimen [a] Cross-section of the ribbed sandwich panel specimen (R10) [900*900 mm], [b] Cross-section of the ribbed sandwich panel specimen (R15) [900*900 mm], [c] Cross-section of the ribbed sandwich panel specimen (R10) [600*600 mm], [d] Cross-section of the ribbed sandwich panel specimen (R15) [600*600 mm]
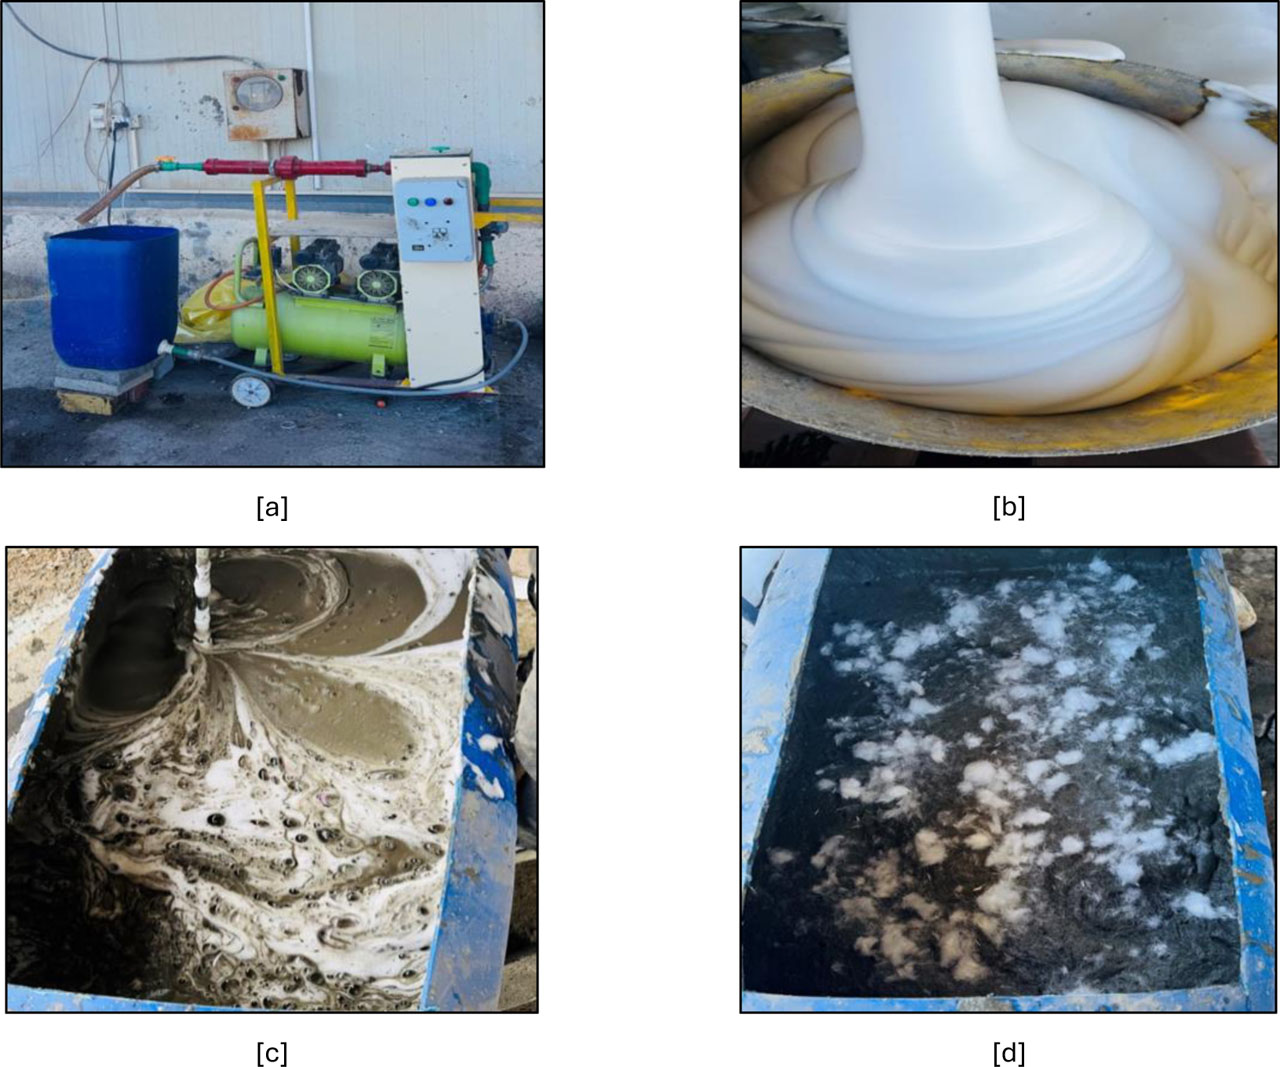
Figure 3:
Foam preparation process [a] foam generation device, [b] pre-formed foam used in the production of foamed concrete, [c] foam addition into the cementitious slurry, fibre addition to the concrete mixture
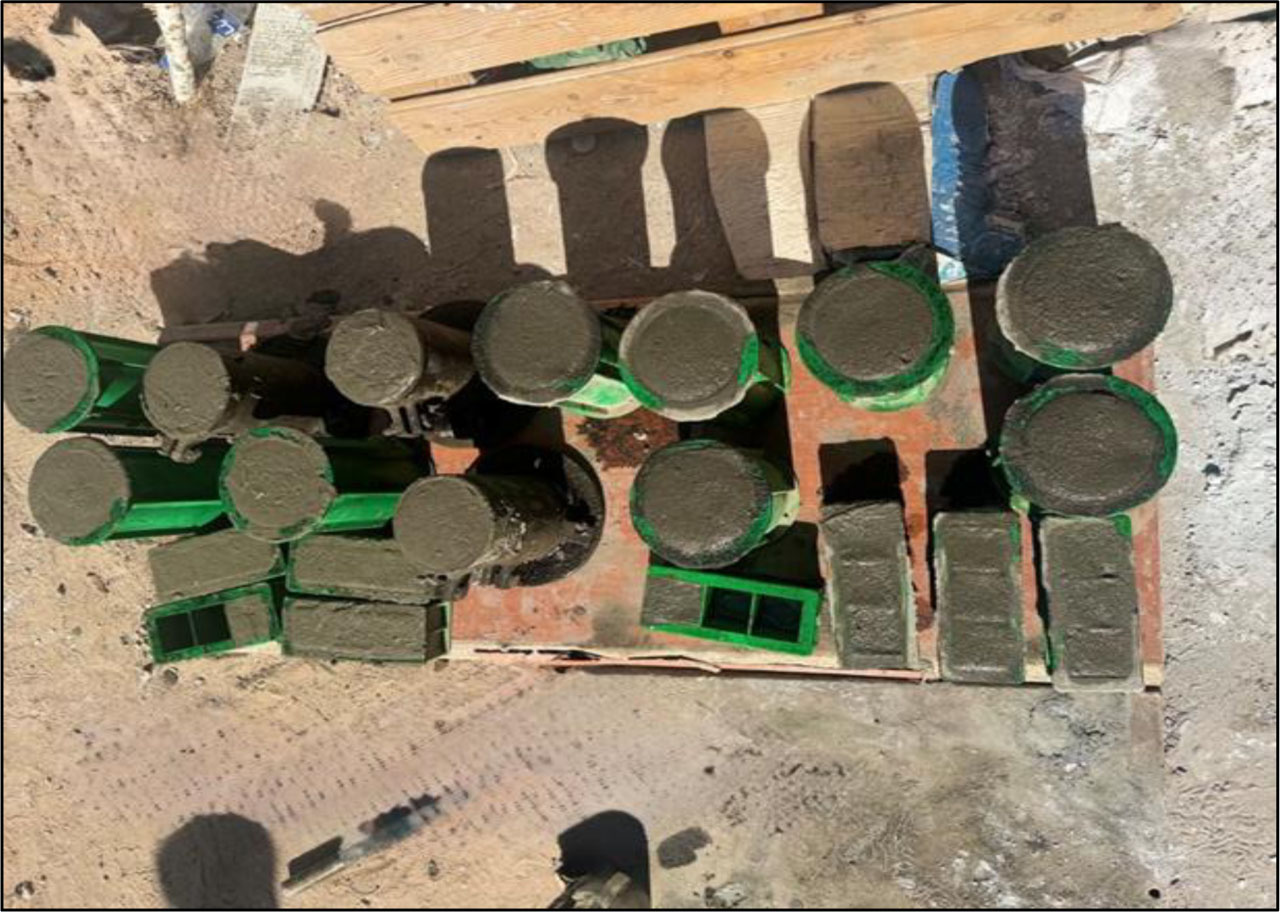
Figure 4:
Small foamed concrete specimen cast for laboratory testing
Table 2:
Average physical and mechanical properties of foamed concrete mixes at 7, 28, 56 days
| Mix | ||||||
|---|---|---|---|---|---|---|
| M1 | M1 | M1 | M2 | M2 | M2 | |
| Age [days] | 7 | 28 | 56 | 7 | 28 | 56 |
| Dry density [kg/m3] | 895.65 | 841.00 | - | 1125.75 | 1336.00 | - |
| Water Absorption [%] | 24.00 | 20.65 | - | 18.50 | 16.80 | - |
| Porosity [%] | 60.06 | 61.11 | - | 47.66 | 41.21 | - |
| Compressive strength [MPa] | 1.16 | 2.00 | 2.77 | 1.88 | 2.97 | 4.43 |
| Splitting tensile strength [MPa] | 0.115 | 0.123 | 0.86 | 0.445 | 0.676 | 1.024 |
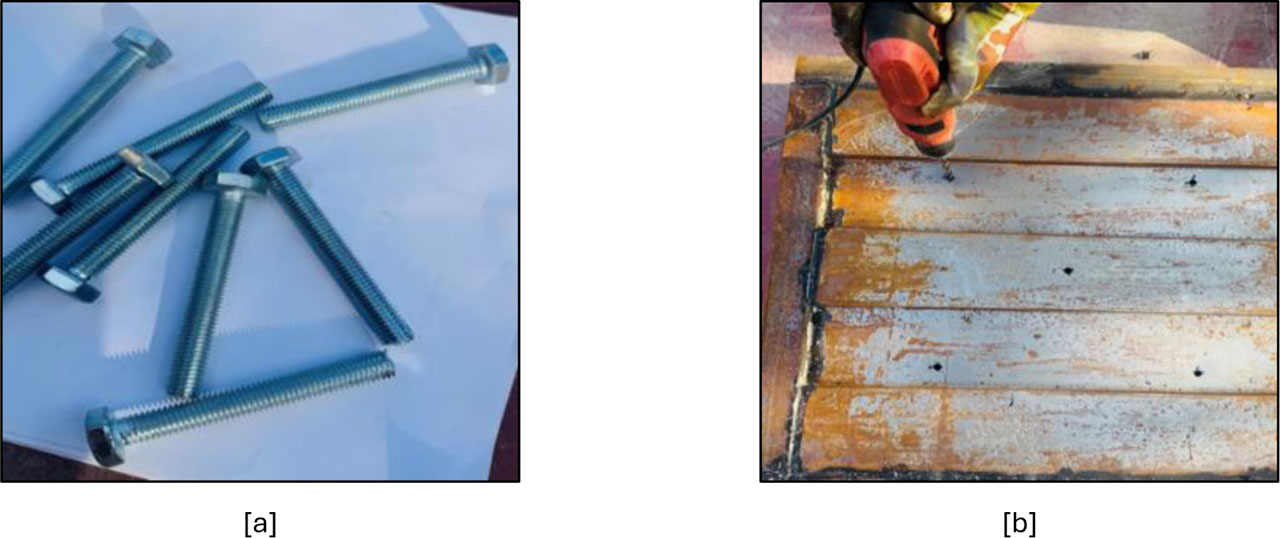
Figure 5:
Shear connectors used in the sandwich panel specimens [a] M10 bolt connectors [grade 8.8], [b] installation layout of the connectors in the panel
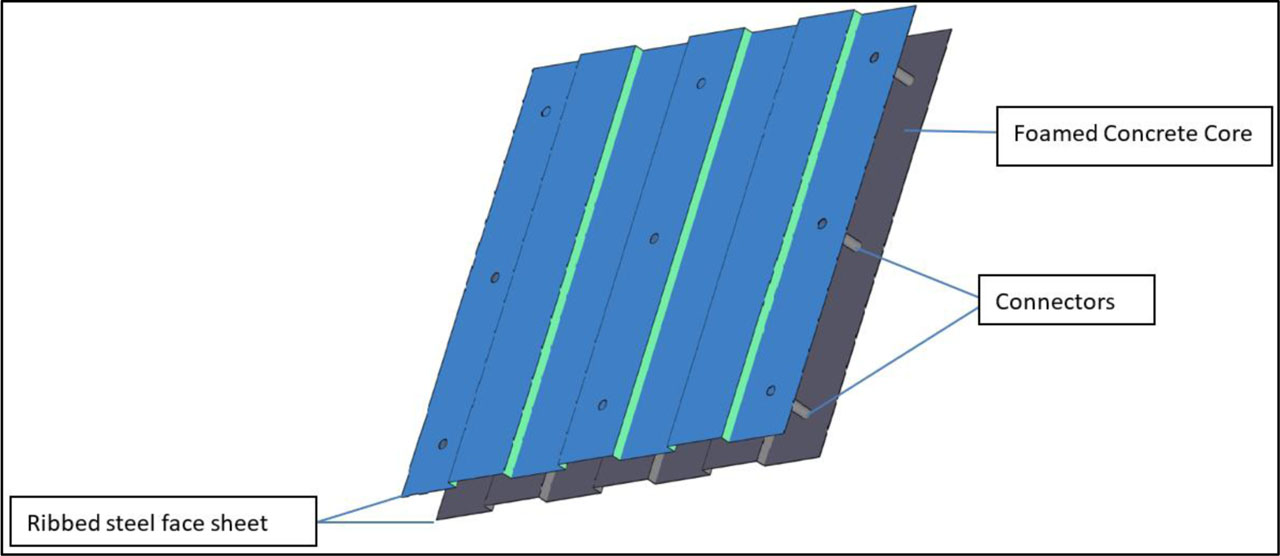
Figure 6:
Schematic drawing of a sandwich panel
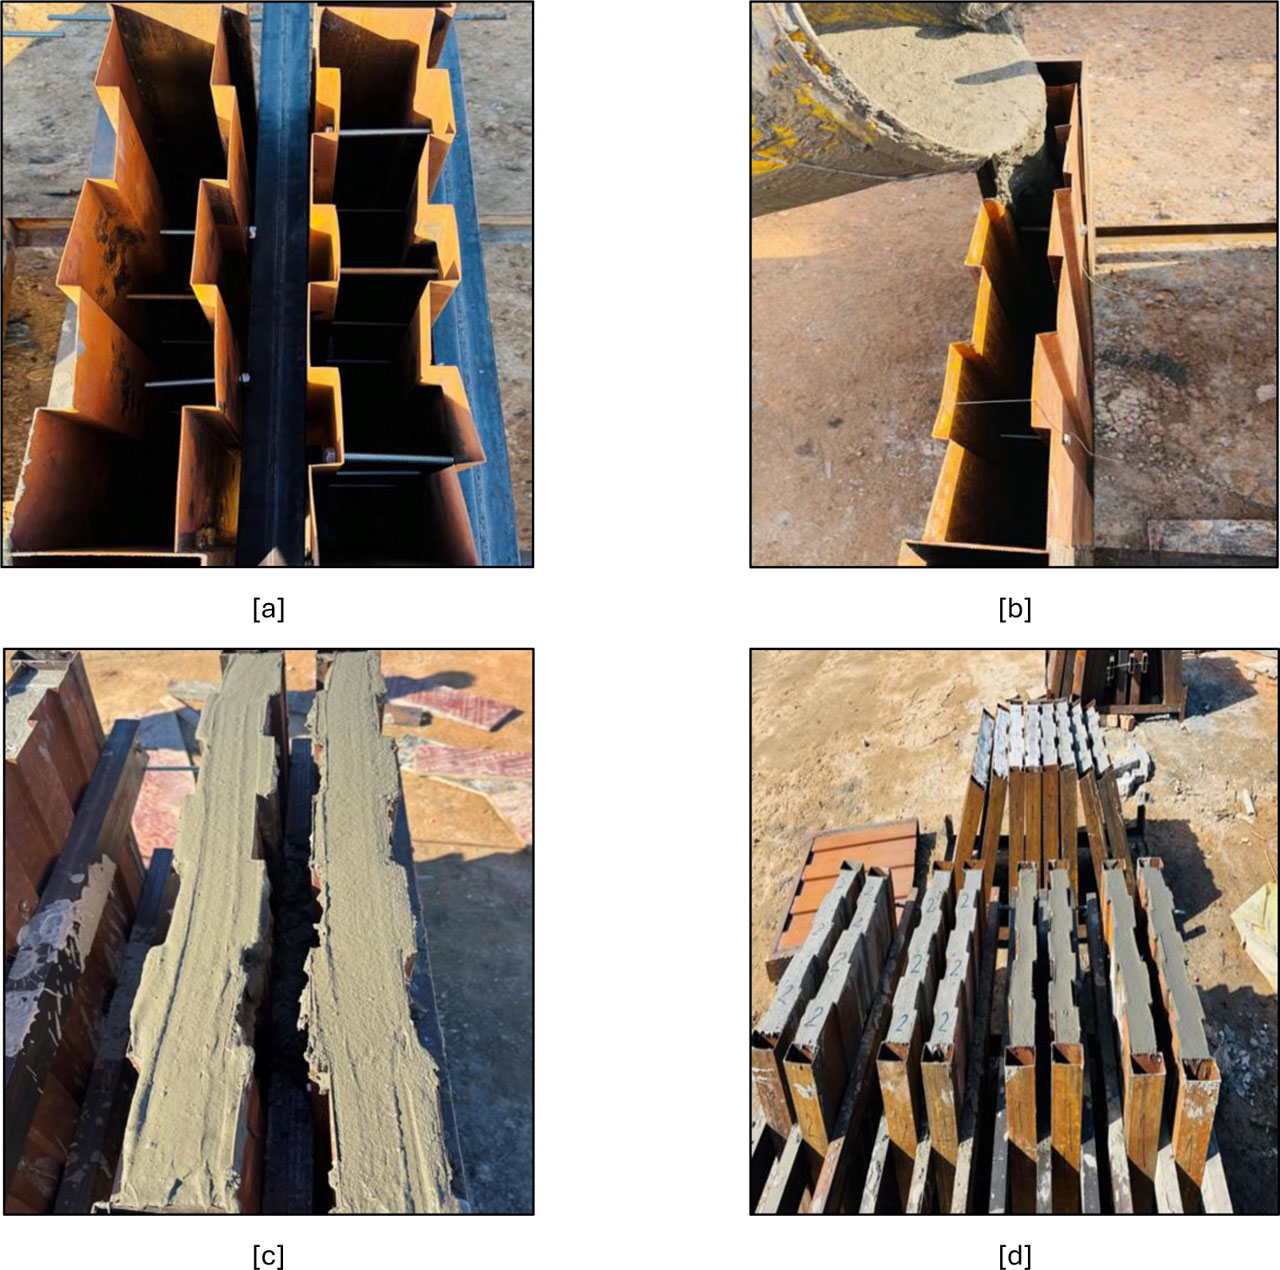
Figure 7:
Fabrication process of sandwich panel specimens, [a] ribbed steel face sheets and connectors, [b] casting of foamed concrete core, [c] casting of core, [d] splicing of sandwich panel specimens
Table 3:
Details of specimens tested under four-point bending
| Specimen ID | Mix Type | Rib Spacing [mm] | No. of Connectors | Face sheet thickness [mm] | Core thickness [mm] |
|---|---|---|---|---|---|
| M1-R10-C6 | M1 | 10 | 6 | 10 | 75 |
| M1-R10-C9 | M1 | 10 | 9 | 10 | 75 |
| M1-R15-C6 | M1 | 15 | 6 | 10 | 75 |
| M1-R15-C9 | M1 | 15 | 9 | 10 | 75 |
| M2-R10-C6 | M2 | 10 | 6 | 10 | 75 |
| M2-R10-C9 | M2 | 10 | 9 | 10 | 75 |
| M2-R15-C6 | M2 | 15 | 6 | 10 | 75 |
| M2-R15-C9 | M2 | 15 | 9 | 10 | 75 |
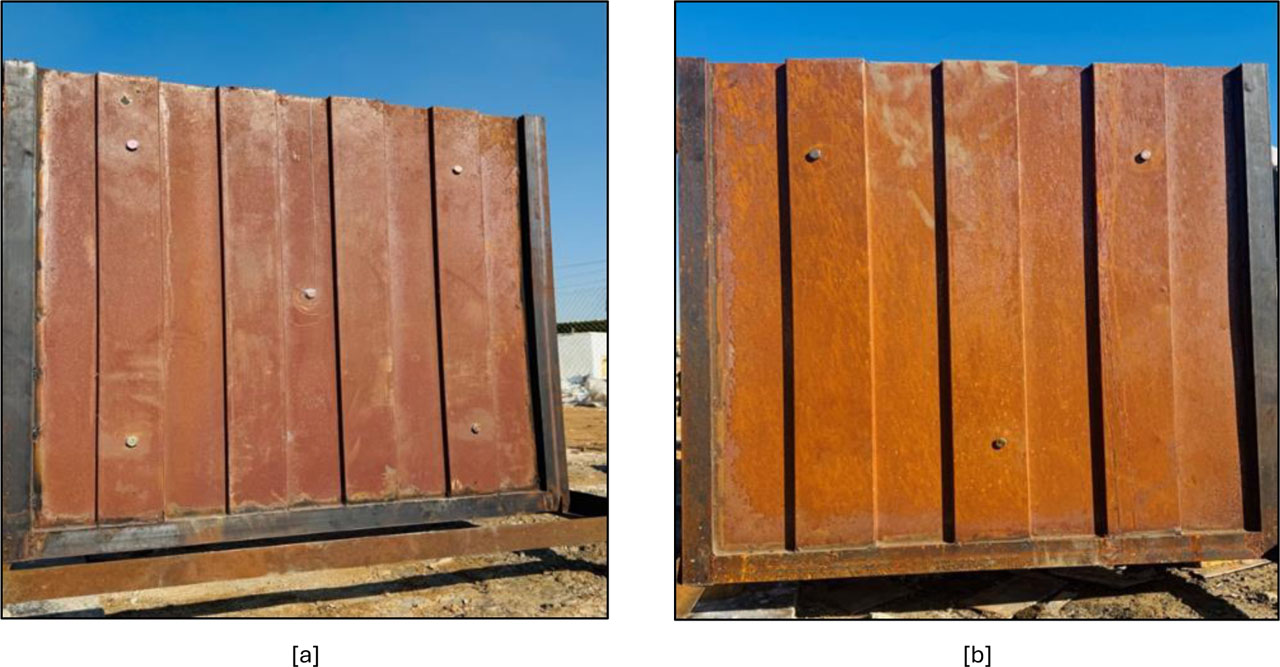
Figure 8:
Typical steel-faced foamed concrete sandwich panel specimens
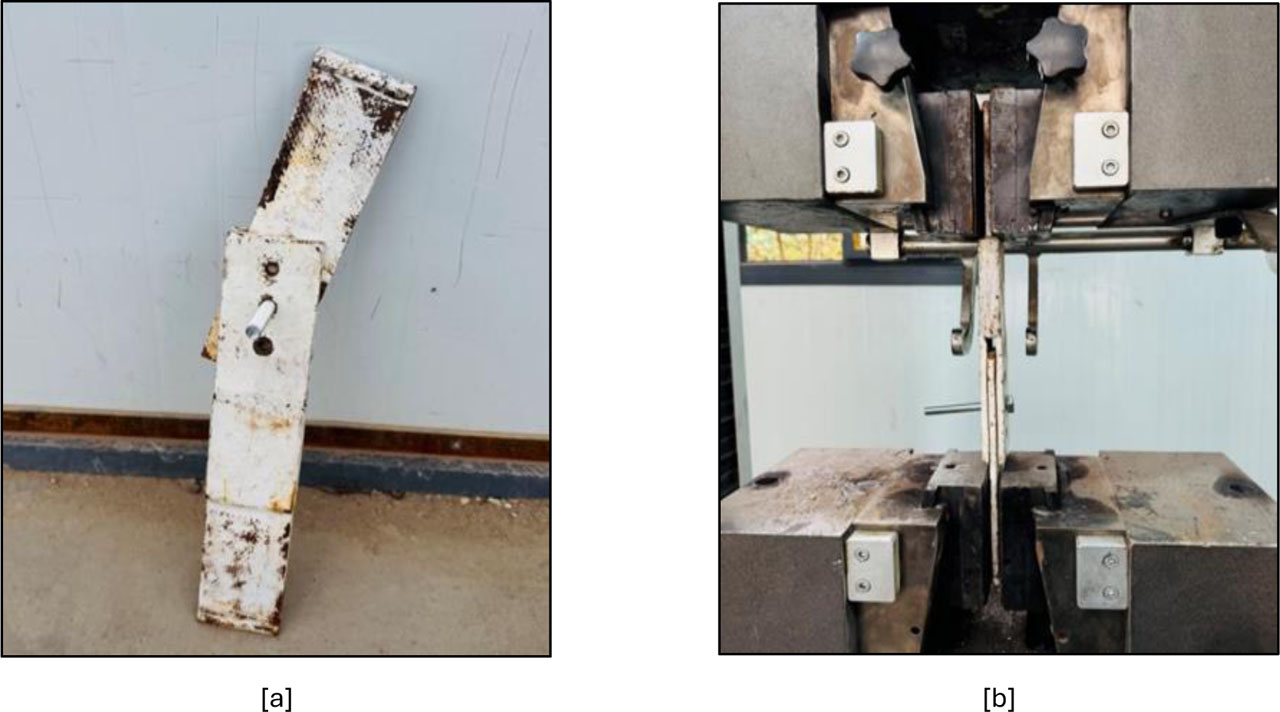
Figure 9:
Single shear test arrangement, [a] connector specimen, [b] loading setup in the universal testing machine
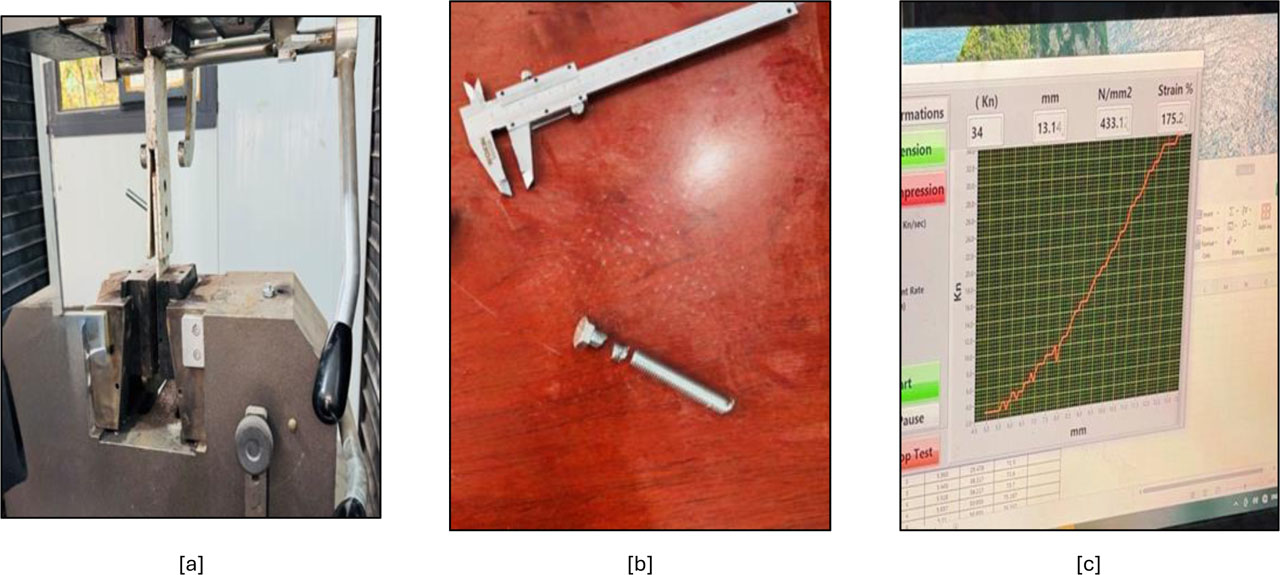
Figure 10:
Single shear test of the M10 connector [a] connector failure during testing, [b] tested connector after deformation, [c] load–displacement response
Table 4:
Shear connector test result
| Nominal diameter [mm] | Measured diameter [mm] | Ultimate load Pu [kN] | Displacement at Pu [mm] | Nominal shear stress τu [MPa] |
|---|---|---|---|---|
| 10 | 10 | 34 | 13.14 | 433.12 |
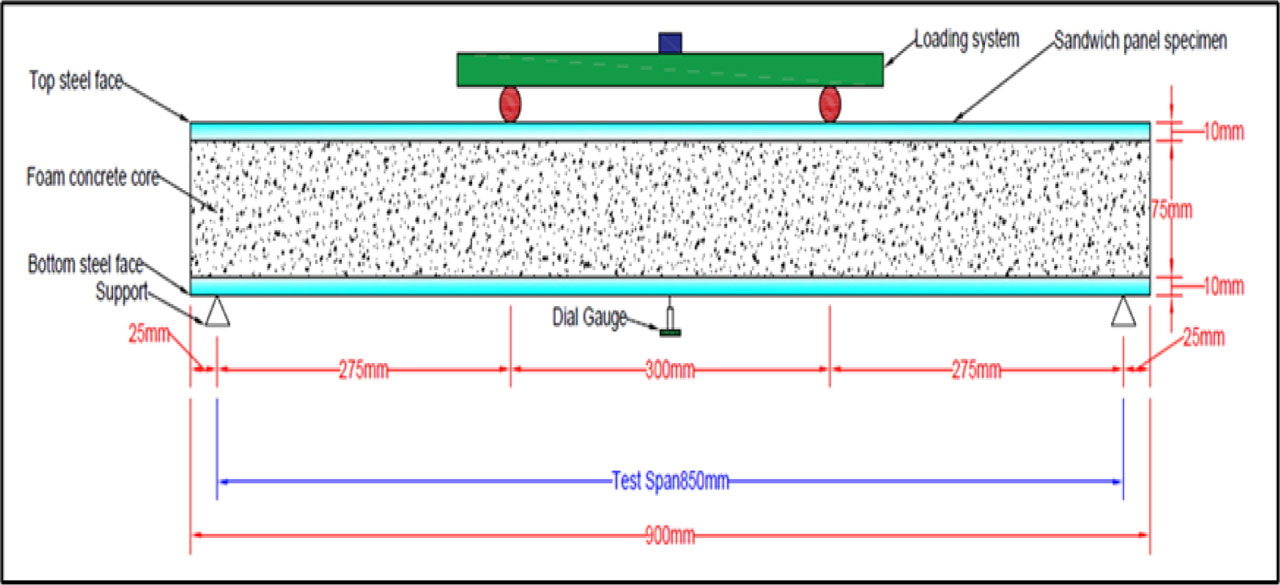
Figure 11:
Schematic diagram of the four-point bending test setup for the sandwich panel specimen
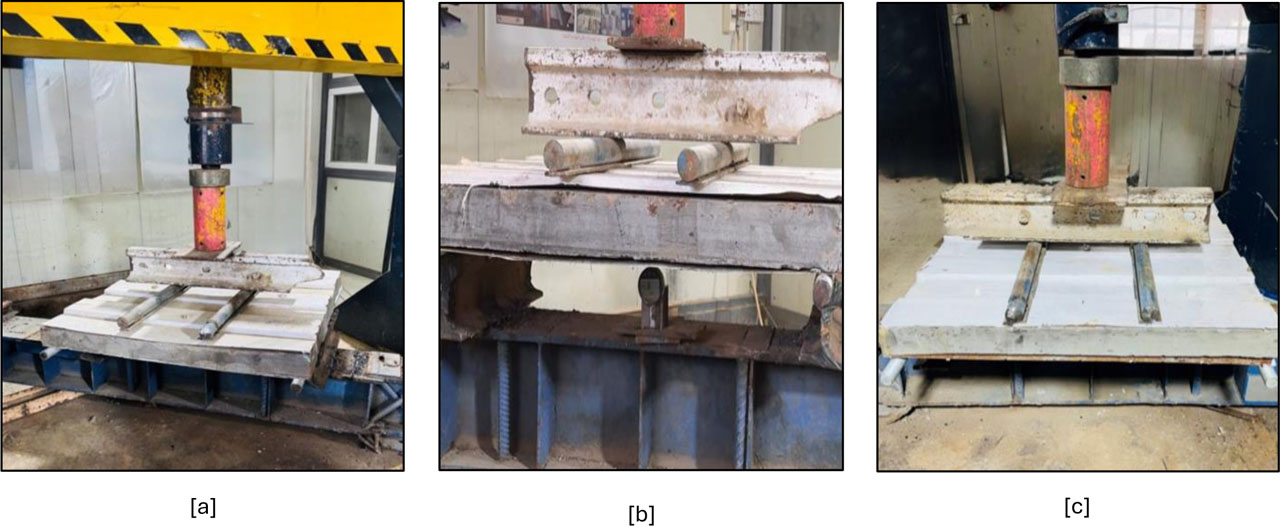
Figure 12:
Four-point bending test configuration used to evaluate the flexural behaviour of the sandwich panel specimens [a] overall experimental setup, [b] loading and support arrangement, [c] measurement of mid-span displacement using a digital dial gauge
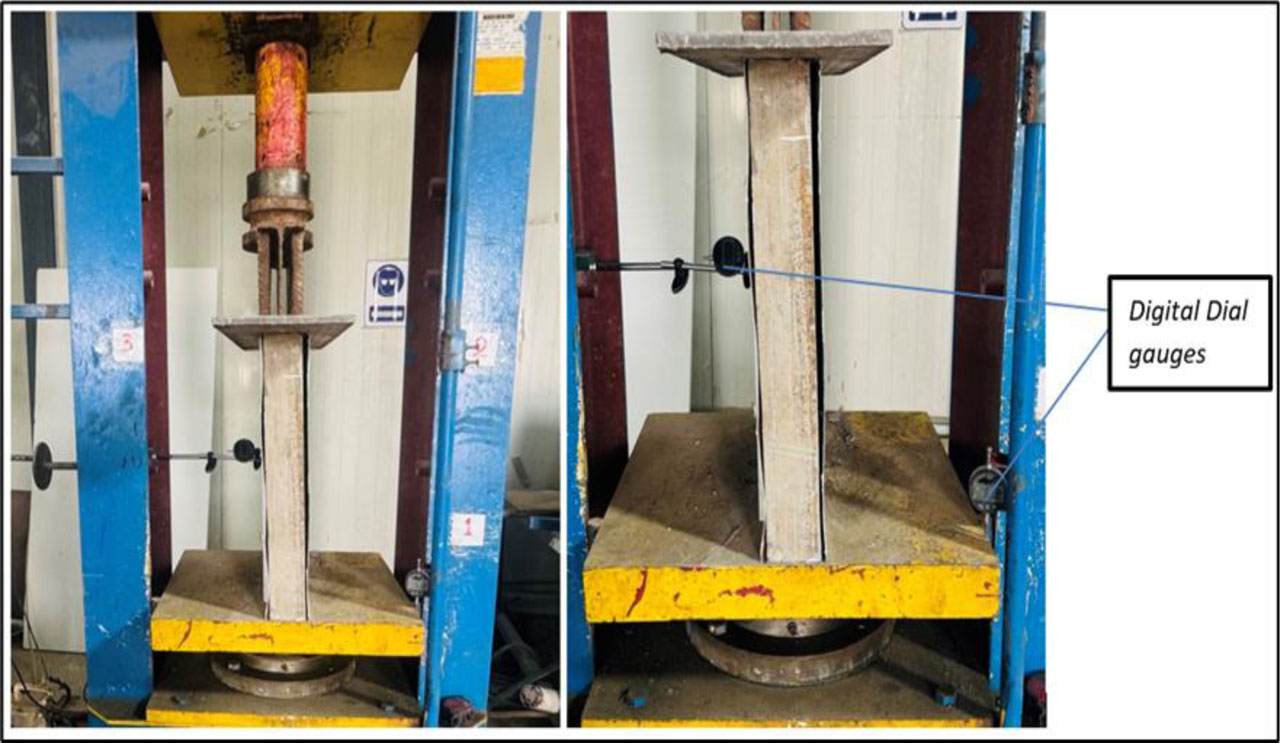
Figure 13:
Configuration of axial compression test, sandwich panel is loaded between two rigid steel plates, and the lateral displacement of the sandwich panel is measured by a dial gauge
Table 5:
Four-point flexural strength test results
| Specimen ID | Ultimate load Pu [kN] | Ultimate flexural strength Mu [kN.m] | Deflection at ultimate load ∆u [mm] | First crack load Pcr [kN] | First Crack moment Mcr [kN.m] | Deflection at first crack ∆cr [mm] | Failure mode |
|---|---|---|---|---|---|---|---|
| M1-R10-C6 | 22 | 3.025 | 9.28 | 20 | 2.75 | 7.50 | Local outward bulging |
| M1-R10-C9 | 33 | 4.537 | 12.47 | 20 | 2.75 | 3.08 | Core cracking |
| M1-R15-C6 | 17 | 2.33 | 13.90 | 15 | 2.062 | 6.36 | Face-core debonding |
| M1-R15-C9 | 25 | 3.43 | 13.71 | 20 | 2.75 | 3.84 | Core cracking |
| M2-R10-C6 | 28 | 3.85 | 13.35 | 20 | 2.75 | 4.61 | local outward bulging |
| M2-R10-C9 | 35 | 4.81 | 12.3 | 25 | 3.43 | 4.09 | Core cracking |
| M2-R15-C6 | 20 | 2.75 | 12.3 | 10 | 1.375 | 3.33 | Core cracking |
| M2-R15-C9 | 25 | 3.43 | 6.80 | 10 | 1.375 | 1.24 | Face-core debonding |
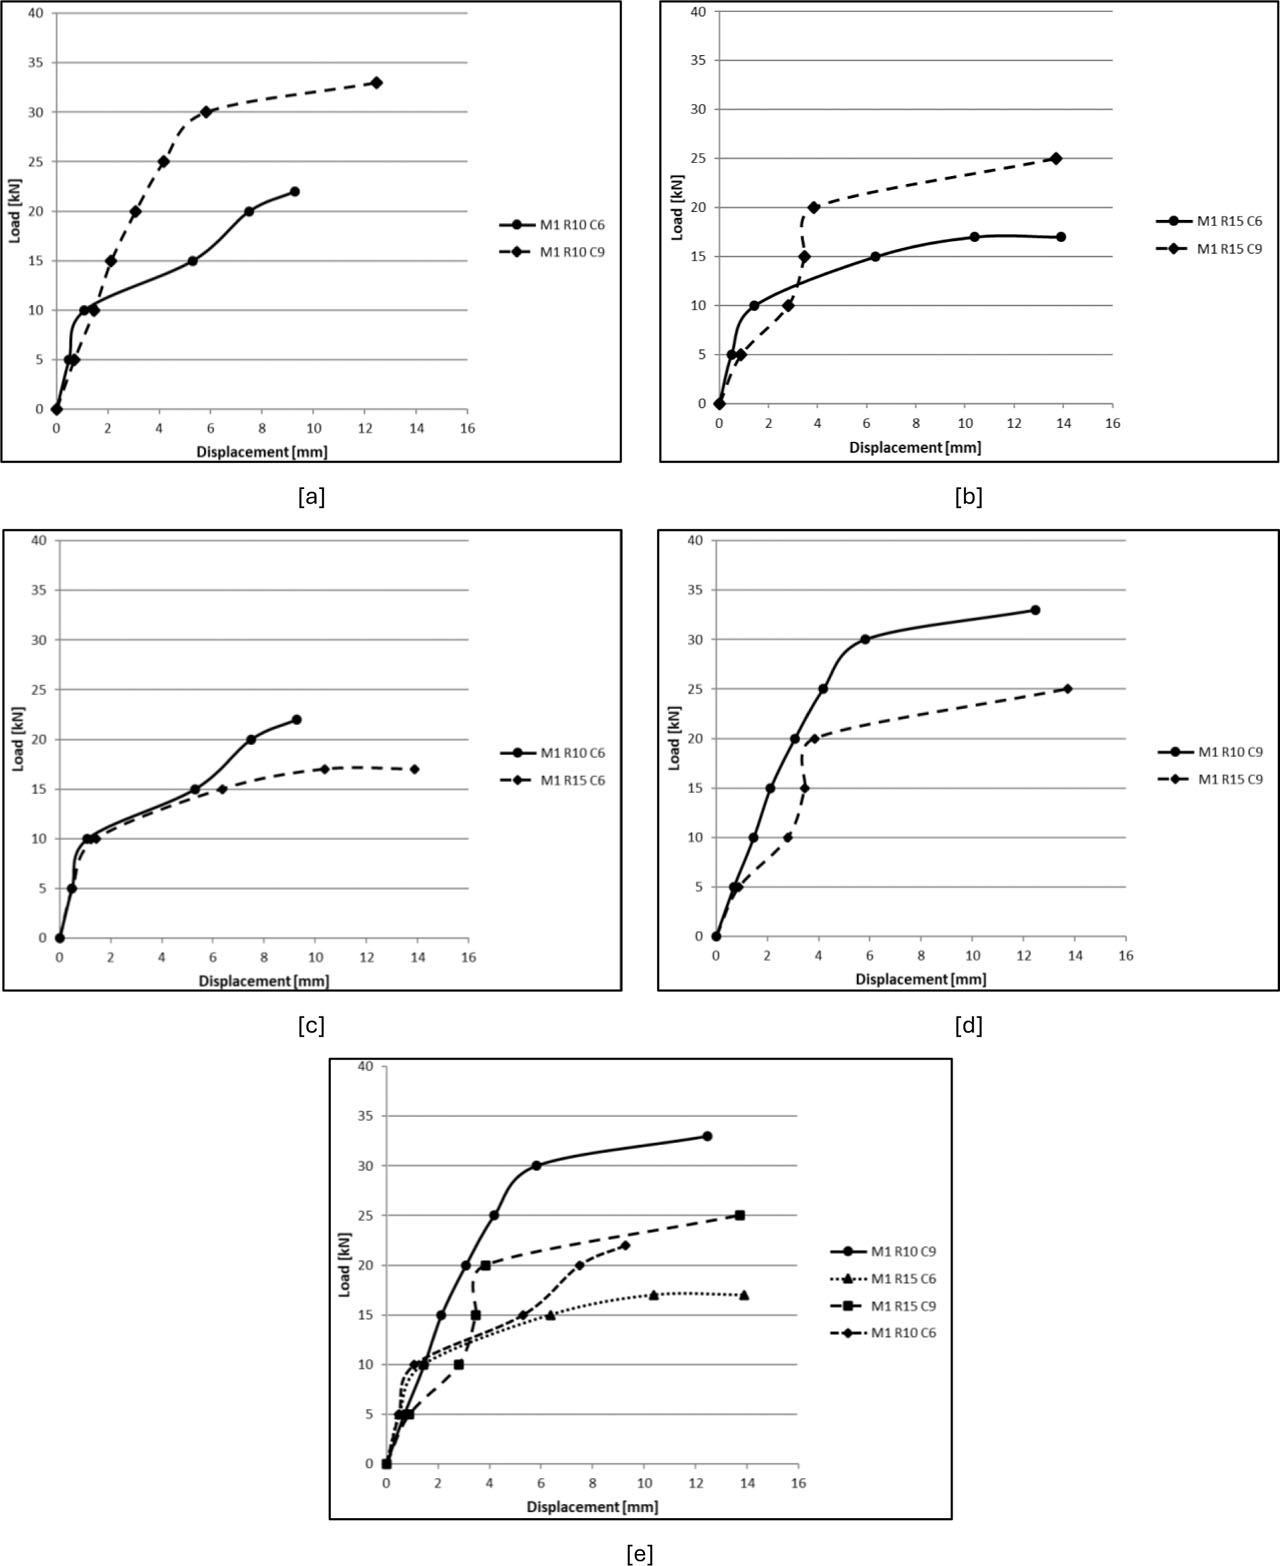
Figure 14:
Load–displacement curves for sandwich panel specimens [a] M1-R10-C6 and M1-R10-C9, [b] M1-R15-C6 and M1-R15-C9, [c]M1-R10-C6 and M1-R15-C6, [d] M1-R10-C9 and M1-R15-C9, [e] M1-R10-C9, M1-R15-C6, M1-R15-C9, and M1-R10-C6.
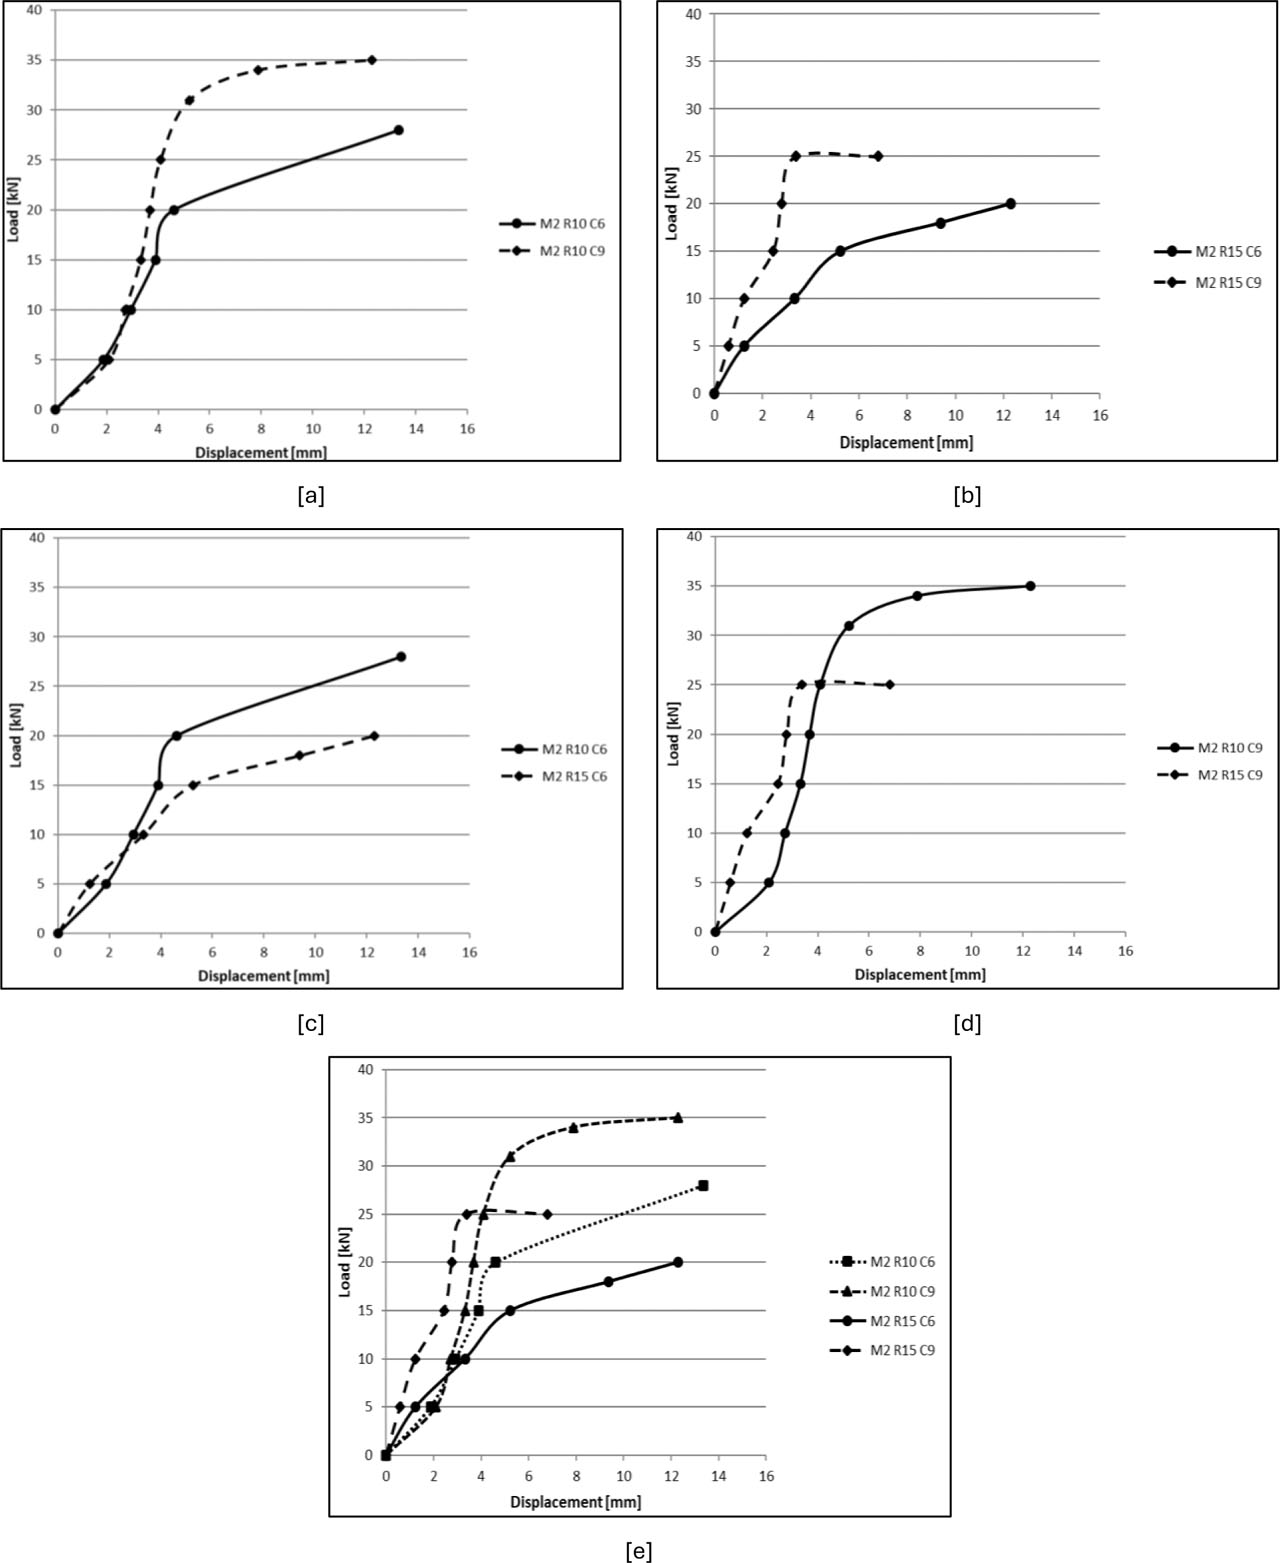
Figure 15:
Load–displacement curves for sandwich panel specimens [a] M2-R10-C6 and M2-R10-C9, [b] M2-R15-C6 and M2-R15-C9, [c] M2-R10-C6 and M2-R15-C6, [d] M2-R10-C9 and M2-R15-C9, [e] M2-R15-C6, M2-R15-C9, M2-R10-C9, and M2-R10-C6
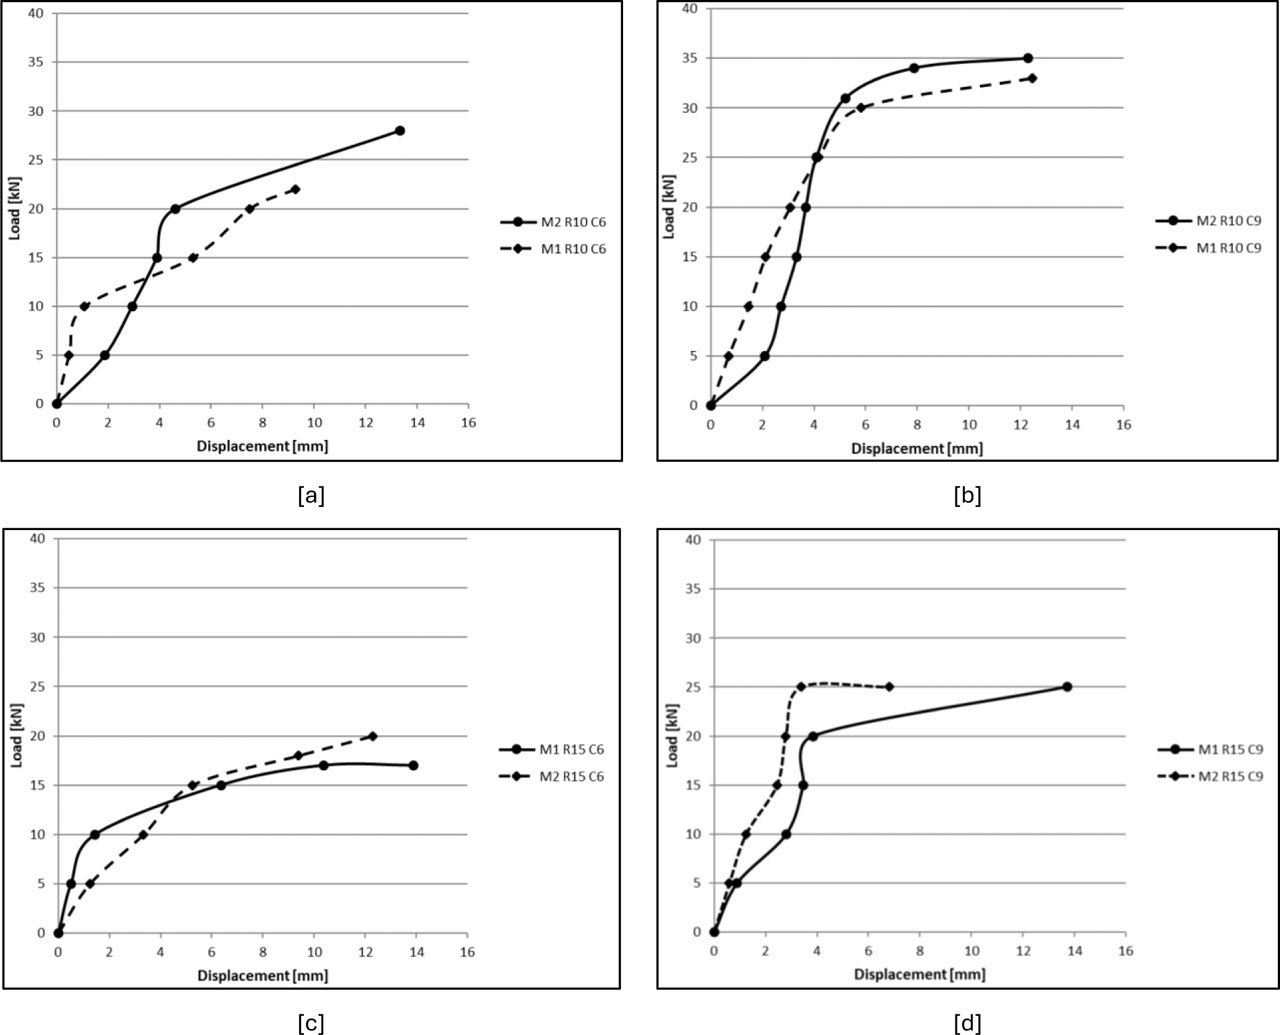
Figure 16:
Load–displacement curves for sandwich panel specimens for all specimens Mix 1 and Mix 2
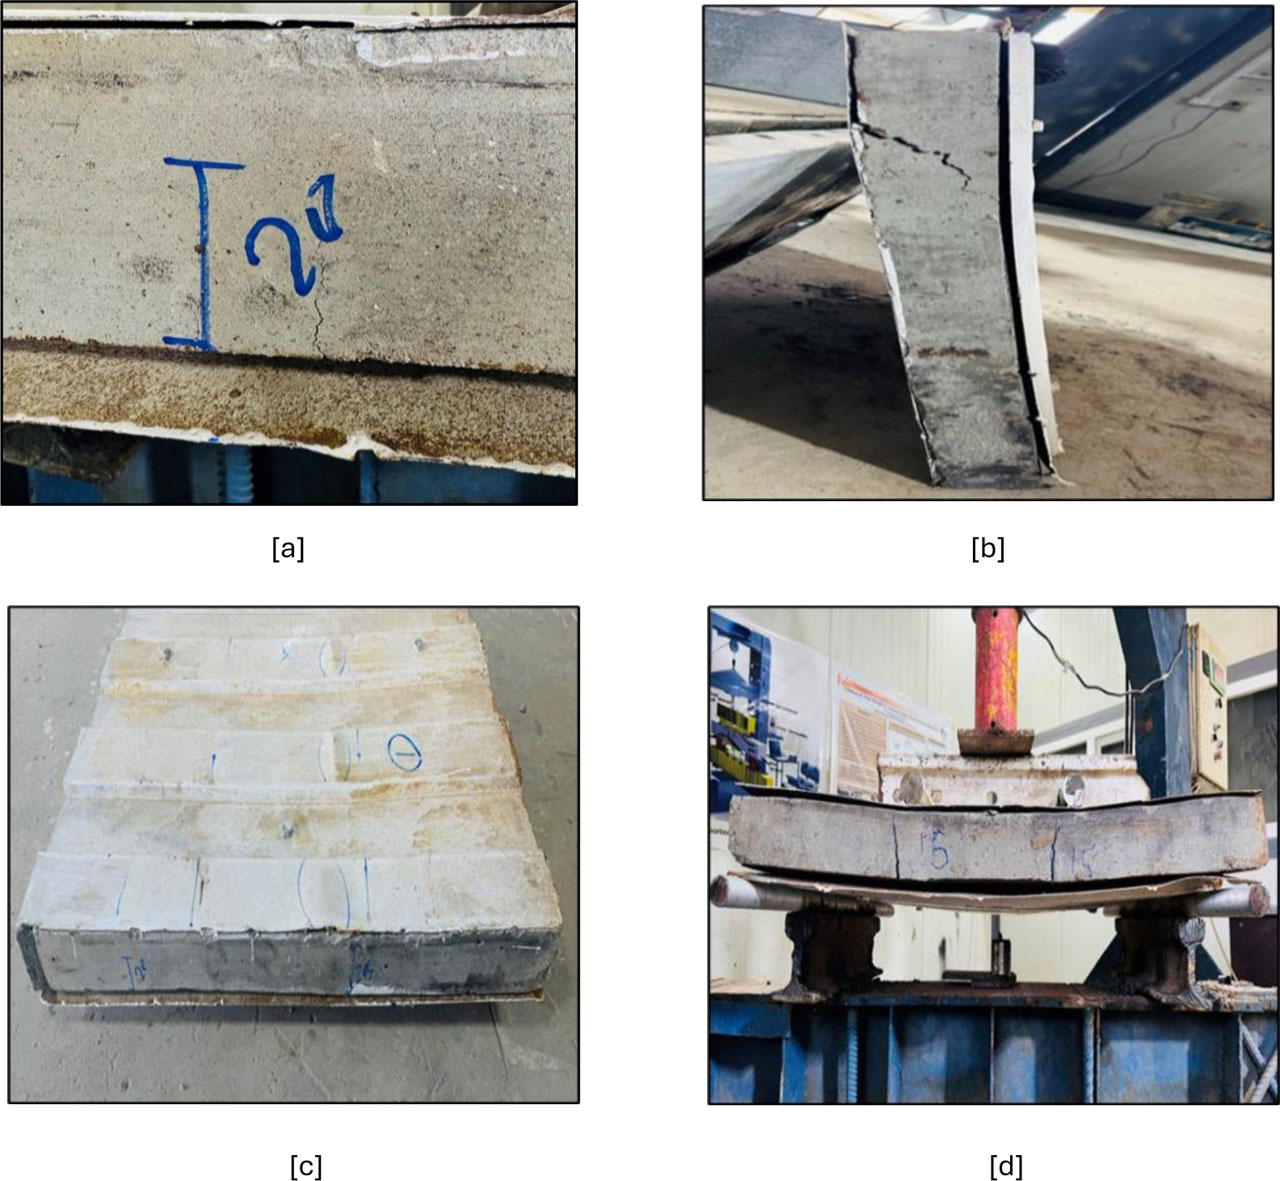
Figure 17:
Flexural failure characteristics of the tested sandwich panels, [a] initiation of flexural cracks in the foamed concrete core, [b] face-core debonding between the steel face sheet and foamed concrete core, [c] outward bulging of steel face sheet, [d] flexural bending of the sandwich panel specimen during testing
Table 6:
Axial compression test results
| Specimen ID | Ultimate load Pmax [kN] | Ultimate compressive stress σmax [MPa] | Vertical displacement Δv [mm] | Lateral displacement Δh [mm] | Failure mode |
|---|---|---|---|---|---|
| M1-R10-C6 | 156.24 | 0.434 | 9.50 | 0.76 | CC-DB |
| M1-R10-C9 | 265.61 | 0.739 | 13.64 | −7.7 | CR-DB |
| M1-R15-C6 | 429.66 | 1.19 | 11.87 | −3.77 | CC-SB-PDB |
| M1-R15-C9 | 429.66 | 1.19 | 9.40 | −3.39 | CC |
| M2-R10-C6 | 546.84 | 1.52 | 12.79 | 6.24 | CC-DB |
| M2-R10-C9 | 468.72 | 1.302 | 10.38 | −10.91 | GB |
| M2-R15-C6 | 156.24 | 0.434 | 9.50 | 0.76 | CC |
| M2-R15-C9 | 429.66 | 1.19 | 9.13 | 1.17 | SB |
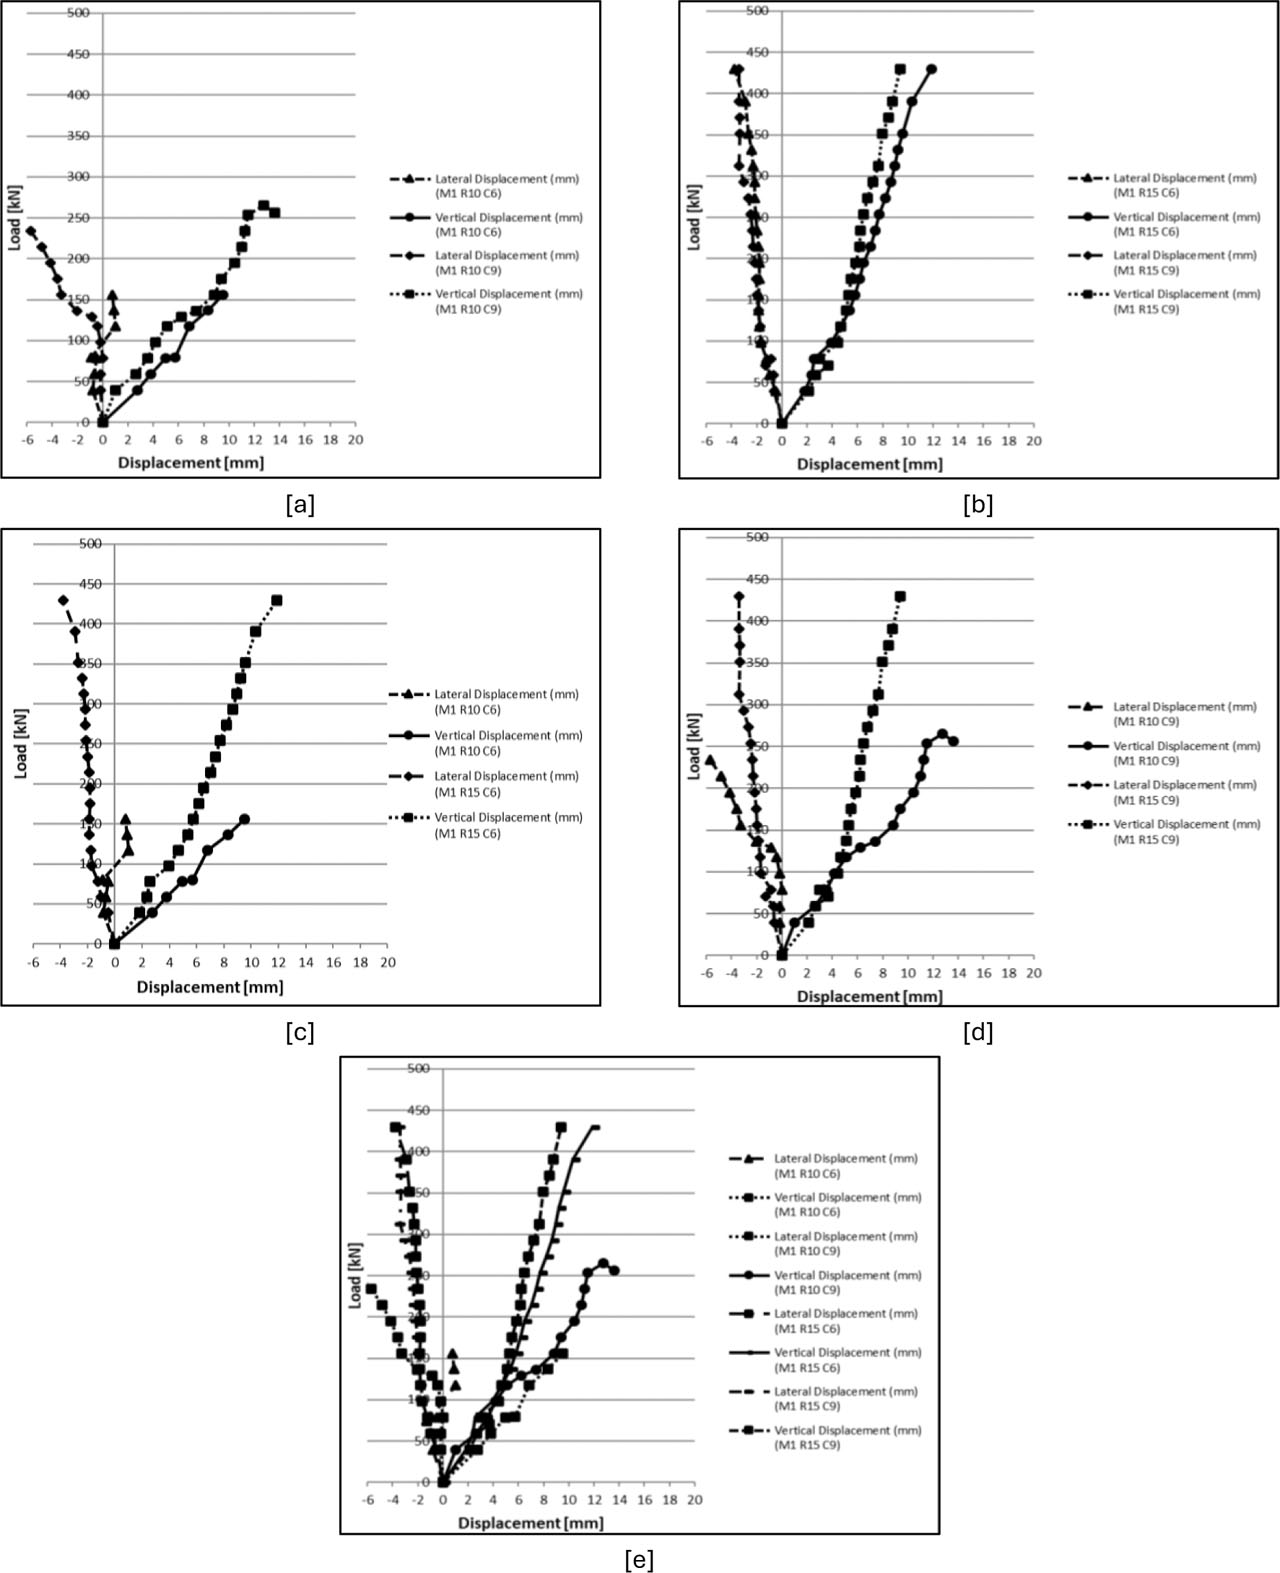
Figure 18:
Vertical and lateral load–displacement curves for axial compression specimens [a] M1-R10-C6 and M1-R10-C9, [b] M1-R15-C6 and M1-R15-C9, [c] M1-R10-C6 and M1-R15-C6, [d] M1-R10-C9 and M1-R15-C9, [e] M1-R10-C9, M1-R15-C6, M1-R15-C9, and M1-R10-C6
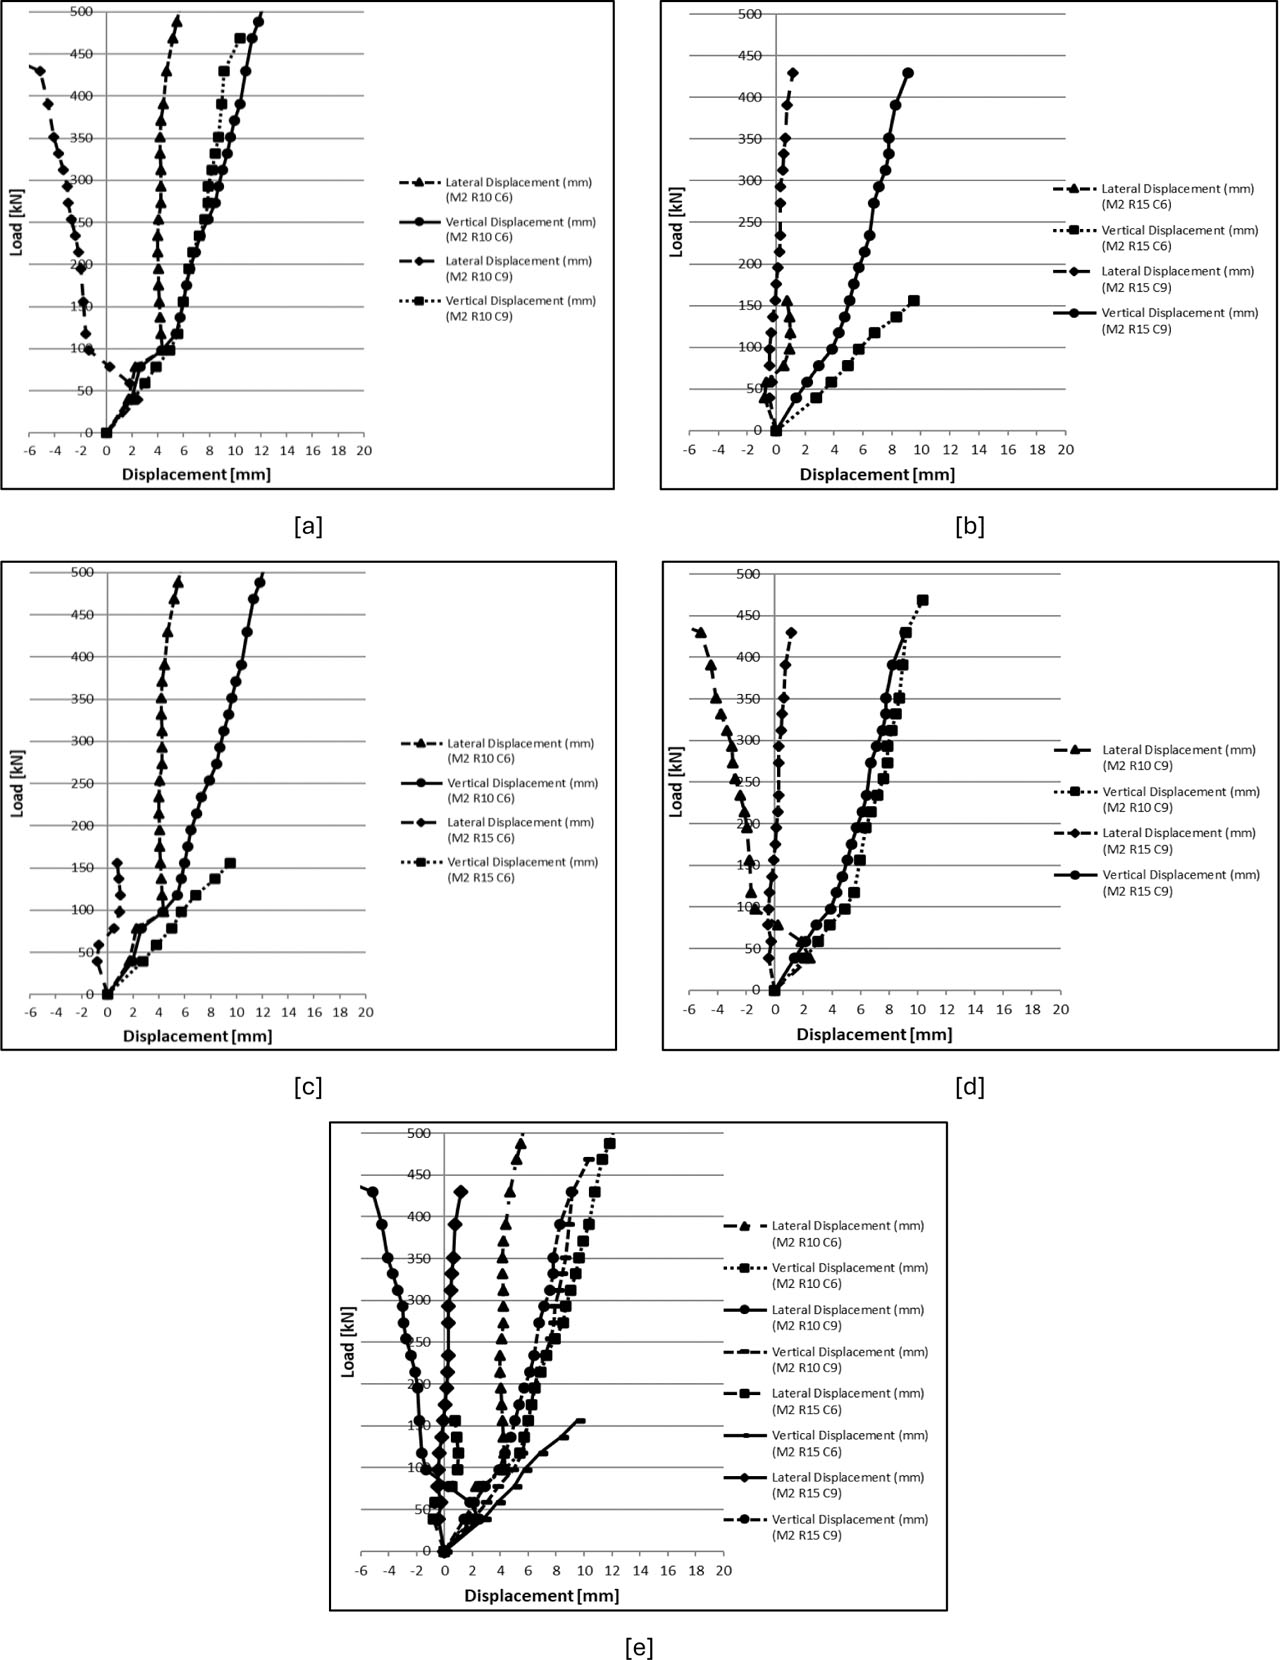
Figure 19:
Vertical and lateral load–displacement curves for axial compression specimens, [a] M2-R10-C6 and M2-R10-C9, [b] M2-R15-C6 and M2-R15-C9, [c] M2-R10-C6 and M2-R15-C6, [d] M2-R10-C9 and M2-R15-C9, [e] M2-R10-C6, M2-R15-C9, M2-R10-C9, and M2-R15-C6
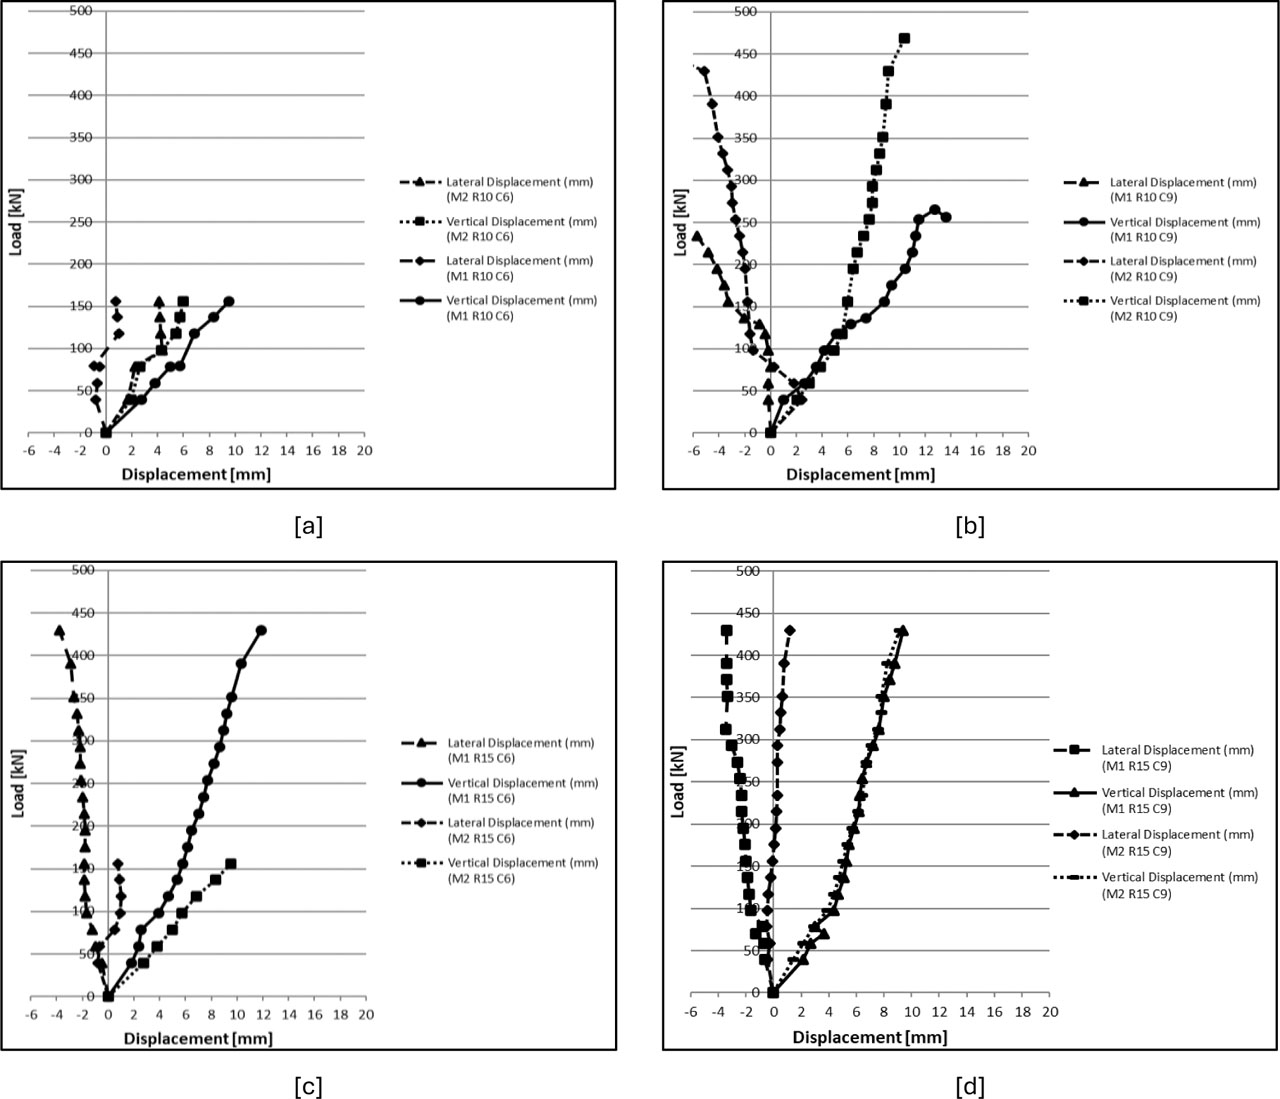
Figure 20:
Vertical and lateral load–displacement curves for axial compression for all specimens, Mix 1 and Mix 2
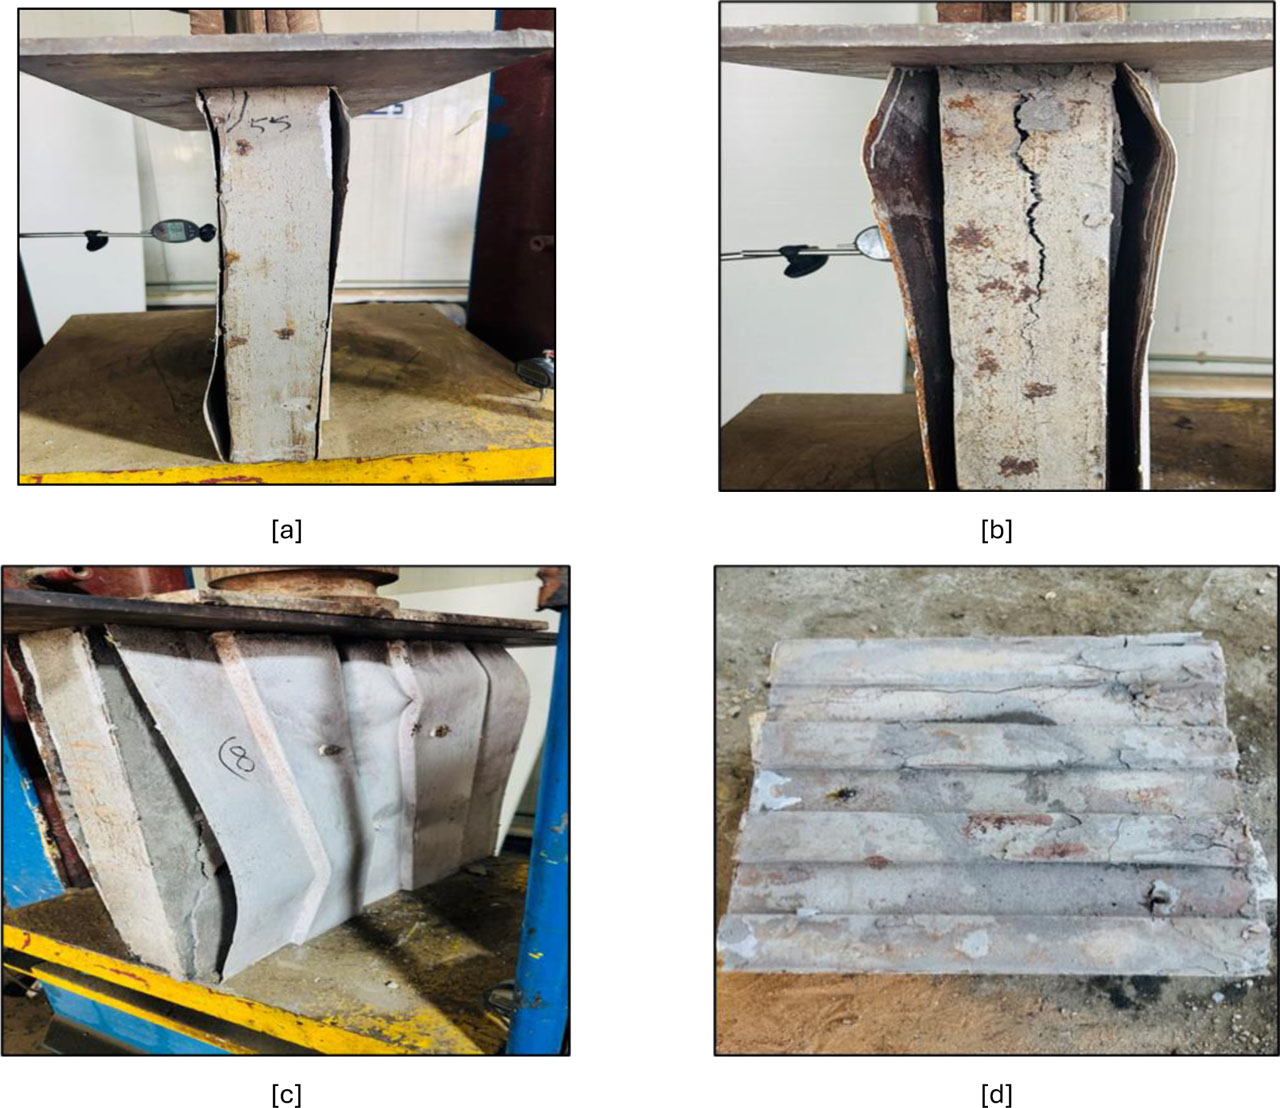
Figure 21:
Failure modes of the tested sandwich panels under axial compression, [a] core cracking, [b] face–core debonding, [c] local buckling of the steel face sheet, [d] internal core damage after removing the steel face sheets