

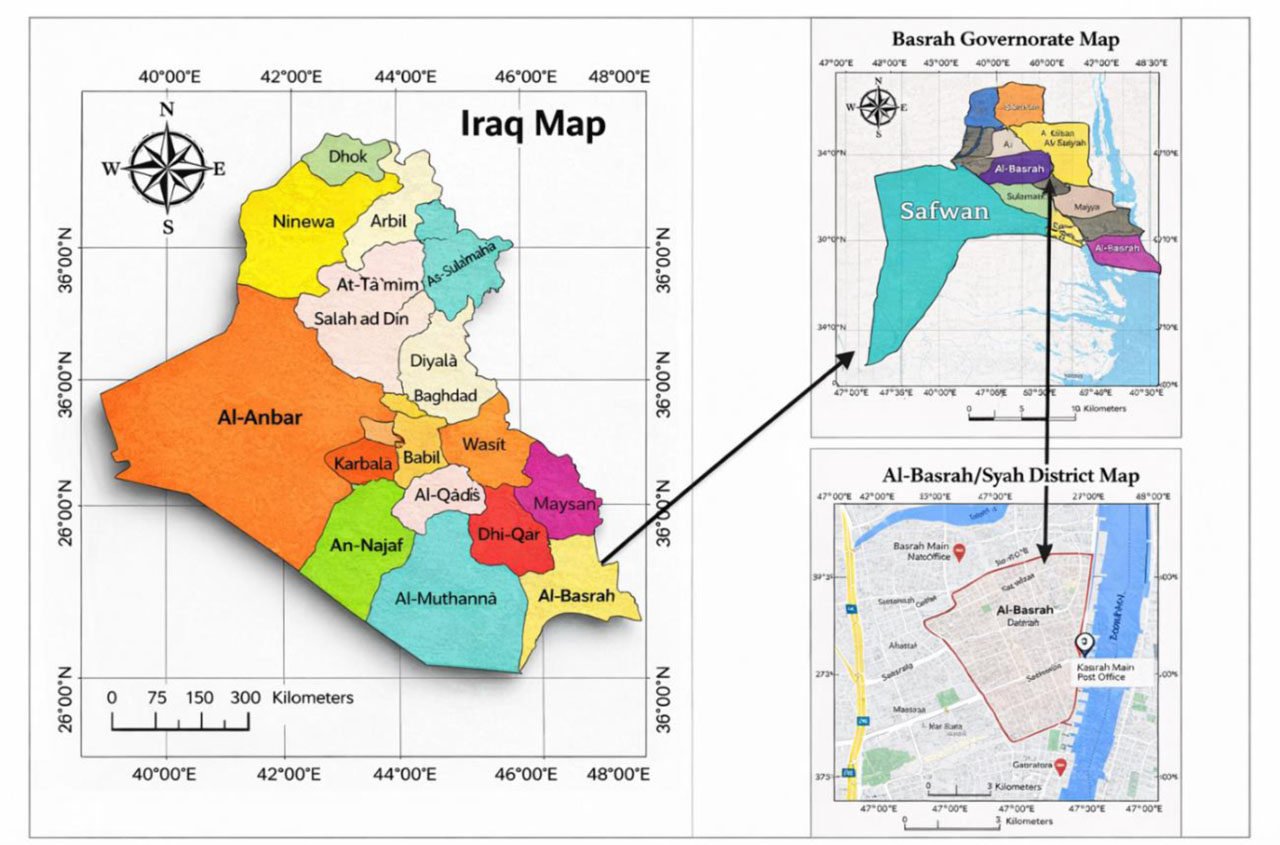
Figure 1:
Location map of Al-Baradiyah water treatment plant in Basra, southern Iraq
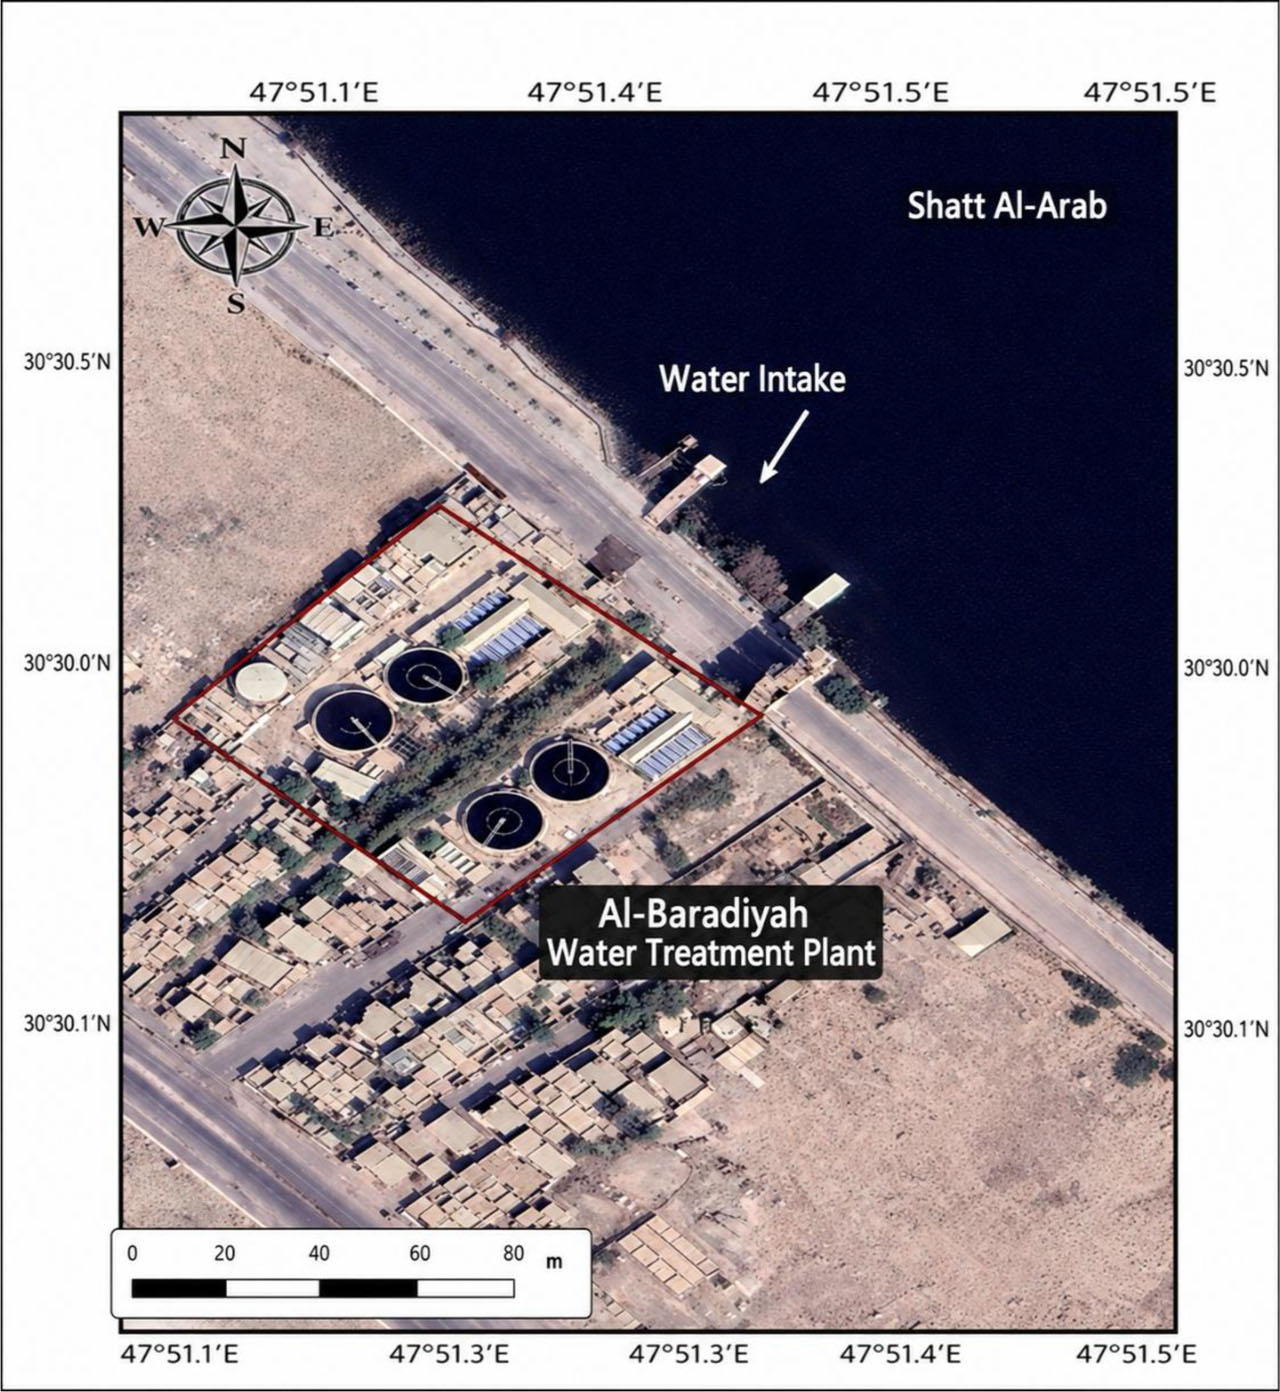
Figure 2:
Google Earth (2026). Satellite image of Al-Baradiyah Water treatment plant
Table 1:
Water quality classification based on WQI values
| WQI level [-] | Ratings of water quality |
|---|---|
| 91–100 | Excellent |
| 71–90 | Good |
| 51–70 | Medium |
| 26–50 | Bad |
| 0–25 | Very bad |
Table 1:
Relative weight of selected physicochemical parameters to determine the water quality index (WQI) in the effluent water of the Al-Baradiyah treatment plant
| Parameters | Permissible value (si) WHO | IQS 417 (si) [mg/L] | Observed values (ci) | qi (ci/si)*100 | W(1/si) | Wi = w/sumw | Sli=wi*qi | Exceeds IQS 417 |
|---|---|---|---|---|---|---|---|---|
| TDS | 500 | 500 | 1906.20 | 381 | 0.002 | 0.01 | 2.10 | Yes |
| Turb | 5 | 5 | 4.02 | 80.4 | 0.2 | 0.55 | 44.36 | No |
| E.C | 1000 | 2786.54 | 279 | 0.001 | 0.00 | 0.77 | N/A | |
| Ca | 200 | 75* | 132.9 | 66.5 | 0.005 | 0.01 | 0.92 | Yes |
| Mg | 150 | 50* | 81 | 54 | 0.0067 | 0.02 | 1.00 | Yes |
| TH | 500 | - | 670.2 | 134 | 0.002 | 0.01 | 0.74 | N/A |
| pH | 8.5 | 7.0–8.5 | 7.7 | 91 | 0.1178 | 0.32 | 29.57 | Within |
| Cl | 250 | 200* | 620.5 | 248 | 0.004 | 0.01 | 2.74 | Yes |
| SO4 | 250 | 200* | 481.8 | 193 | 0.004 | 0.01 | 2.13 | Yes |
| Alk | 150 | - | 177.5 | 118 | 0.02 | 0.06 | 6.51 | N/A |
| Sum | - | 0.3625 | 1 | 90.83 |
- = No guideline value specified in IQS 417 (ICOSQC, 2009). Exceeds IQS 417 column based on the acceptable limit. Ca and Mg mean values in treated water (132.9 and 81 mg/L) exceed IQS 417 acceptable limits (75 and 50 mg/L respectively) but remain within the maximum allowable limits.
Table 2:
Monthly Water Quality Index (WQI) values for treated water at Al-Baradiyah water treatment plant (2024–2025)
| Month | WQI Value | Classification | Salinity period |
|---|---|---|---|
| Jan–2024 | 94.19 | Excellent | Normal |
| Feb–2024 | 98.26 | Excellent | Normal |
| Mar–2024 | 108.72 | Excellent | Normal |
| Apr–2024 | 91.63 | Excellent | Normal |
| May–2024 | 101.47 | Excellent | Normal |
| Jun–2024 | 86.43 | Good | Moderate salinity |
| Jul–2024 | 68.31 | Medium | Moderate salinity |
| Aug–2024 | 81.37 | Good | Moderate Salinity |
| Sep–2024 | 105.92 | Excellent | Moderate Salinity |
| Oct–2024 | 103.36 | Excellent | Moderate Salinity |
| Nov–2024 | 106.18 | Excellent | Moderate Salinity |
| Dec–2024 | 104.37 | Excellent | Moderate Salinity |
| Jan–2025 | 104.16 | Excellent | Normal |
| Feb–2025 | 85.15 | Good | Normal |
| Mar–2025 | 97.43 | Excellent | Normal |
| Apr–2025 | 92.59 | Excellent | Normal |
| May–2025 | 107.36 | Excellent | Moderate Salinity |
| Jun–2025 | 58.66 | Medium | High Salinity Intrusion |
| Jul–2025 | 96.08 | Excellent | High Salinity Intrusion |
| Aug–2025 | 65.07 | Medium | High Salinity Intrusion |
| Sep–2025 | 61.02 | Medium | High Salinity Intrusion |
| Oct–2025 | 68.01 | Medium | High Salinity Intrusion |
| Nov–2025 | 81.89 | Good | Normal |
| Dec–2025 | 73.86 | Good | Normal |
Table 3:
Descriptive statistics for raw water parameters
| Descriptive | N | Minimum | Maximum | Mean | Std. deviation | IQS 417 [mg/L] |
|---|---|---|---|---|---|---|
| Turb | 24 | 3.83 | 14.9 | 8.3 | 3.58 | 5 / 25* |
| pH | 24 | 7.5 | 8 | 7.74 | 0.145 | 7.0–8.5 / 6.5–9.2* |
| E.C | 24 | 3,386 | 48253 | 15316.96 | 16647.70 | - |
| Alk | 24 | 160 | 200 | 177.5 | 12.68 | - |
| TH | 24 | 752 | 6240 | 2134.90 | 1965.30 | - |
| Ca | 24 | 152 | 1254 | 429.8 | 394.7 | 75 / 200* |
| Mg | 24 | 91 | 758 | 258.8 | 238.9 | 50 / 150* |
| Cl | 24 | 675 | 14300 | 4310.6 | 5093.1 | 200 / 600* |
| SO4 | 24 | 553 | 6043 | 1936.10 | 1962.60 | 200 / 400* |
| TSS | 24 | 14 | 60 | 39.75 | 13.15 | - |
| TDS | 24 | 2,122 | 32,038 | 9947.8 | 11052.5 | 500 / 1500* |
| K+ | 24 | 6.2 | 18 | 11.22 | 2.88 | - |
* IQS 417 format: Acceptable limit / Maximum allowable limit when no better source is available (ICOSQC, 2009).
- = No guideline value specified in IQS 417 for this parameter; evaluation conducted against WHO (2017) guidelines only.
Table 4:
Descriptive statistics for treated water parameters
| Descriptive | N | Minimum | Maximum | Mean | Std. deviation | IQS 417 [mg/L] |
|---|---|---|---|---|---|---|
| Turb | 24 | 1.84 | 5 | 4.02 | 1.19 | 5 / 25* |
| pH | 24 | 7.1 | 8.19 | 7.69 | 0.27 | 7.0–8.5 / 6.5–9.2* |
| E.C | 24 | 1,022 | 6,037 | 2,786.54 | 1,707.01 | - |
| Alk | 24 | 160 | 200 | 177.5 | 12.68 | - |
| TH | 24 | 352 | 1,072 | 670.2 | 229.9 | - |
| Ca | 24 | 72 | 216 | 132.9 | 48.9 | 75 / 200* |
| Mg | 24 | 42 | 130 | 81 | 28.6 | 50 / 150* |
| Cl | 24 | 150 | 1,490 | 620.5 | 453.5 | 200 / 600* |
| SO4 | 24 | 183 | 855 | 481.8 | 213 | 200 / 400* |
| TSS | 24 | 4 | 35 | 22 | 9.7 | - |
| TDS | 24 | 317 | 4,646 | 1,906.20 | 1,247.30 | 500 / 1500* |
| K+ | 24 | 3.5 | 13 | 6.81 | 2.33 | - |
* IQS 417 format: Acceptable limit / Maximum allowable limit when no better source is available (ICOSQC, 2009).
- = No guideline value specified in IQS 417 for this parameter; evaluation conducted against WHO (2017) guidelines only.
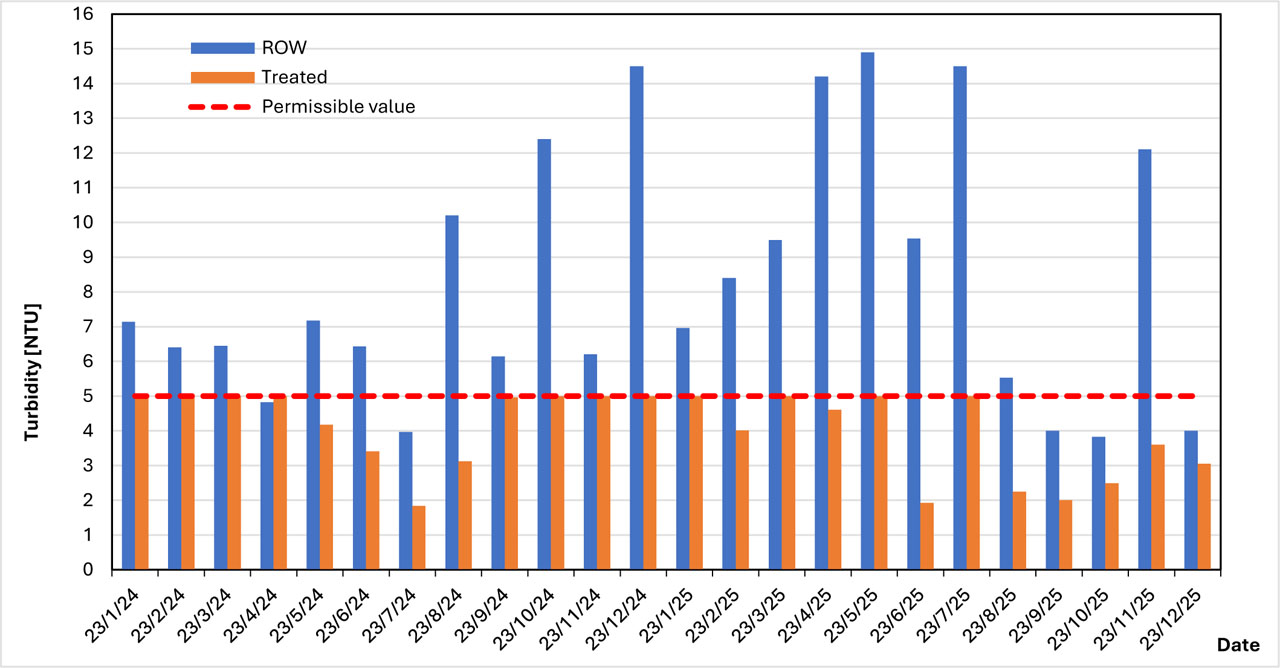
Figure 3:
Monthly variation of turbidity in raw and treated water compared to WHO drinking water limits at Al-Baradiyah water project (2024–2025)
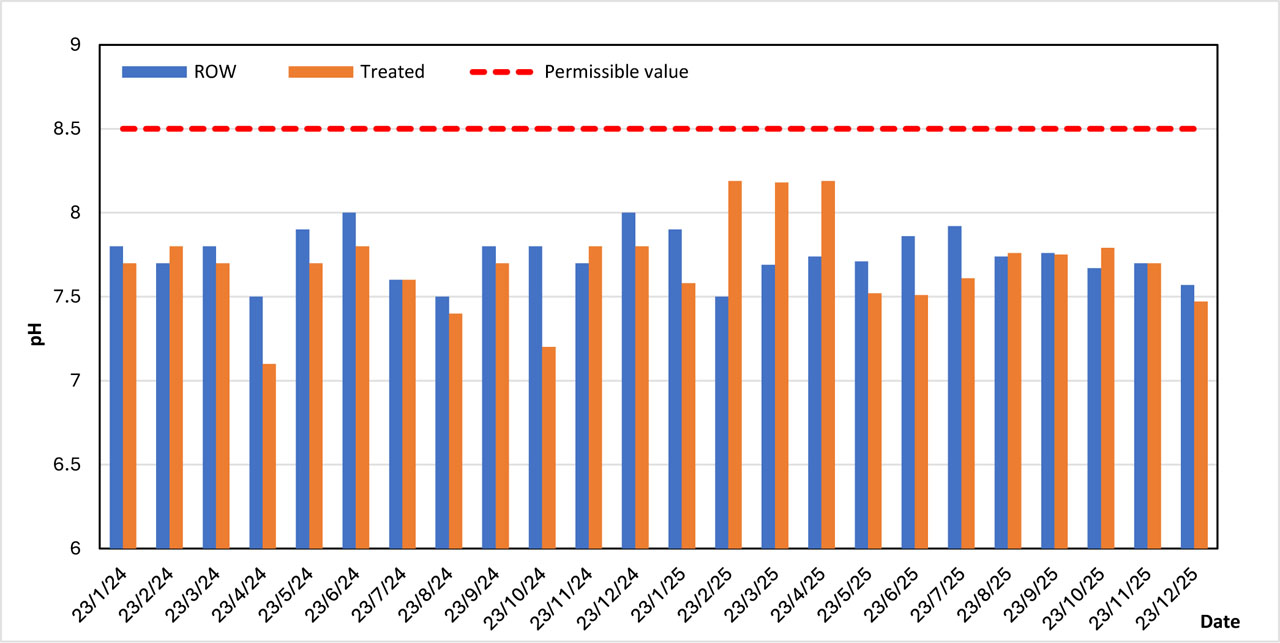
Figure 4:
Monthly variation of pH in raw and treated water compared with WHO drinking water limits at Al-Baradiyah Water Project (2024–2025)
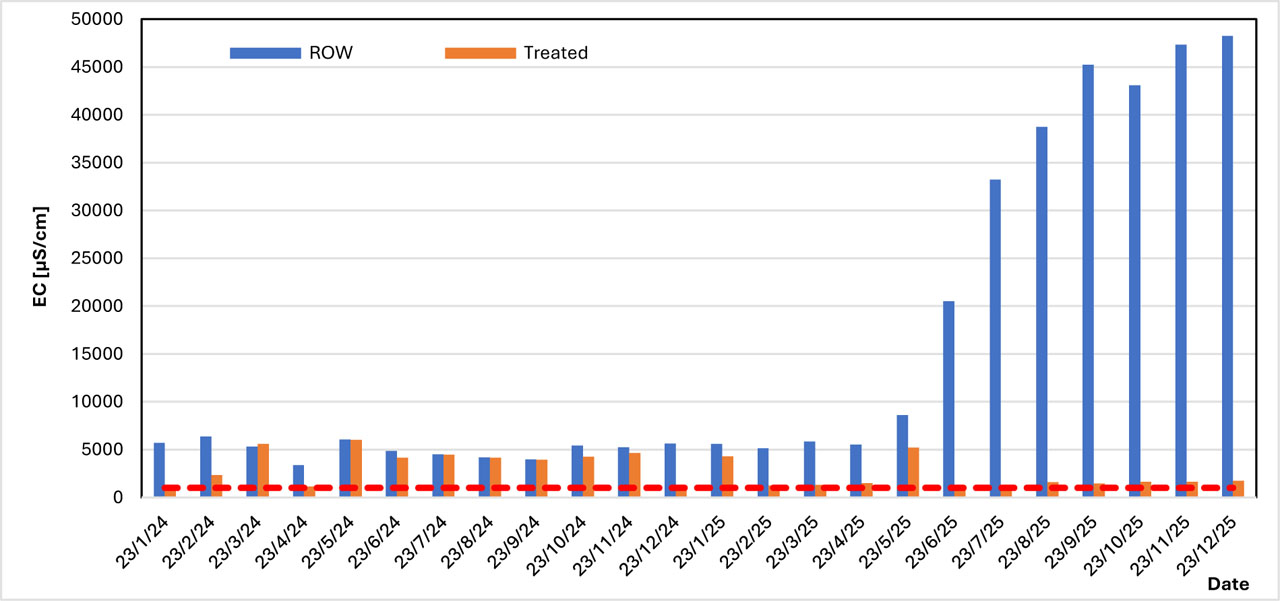
Figure 5:
Monthly variation of (EC) in raw and treated water compared with WHO drinking water limits at Al-Baradiyah Water project (2024–2025)
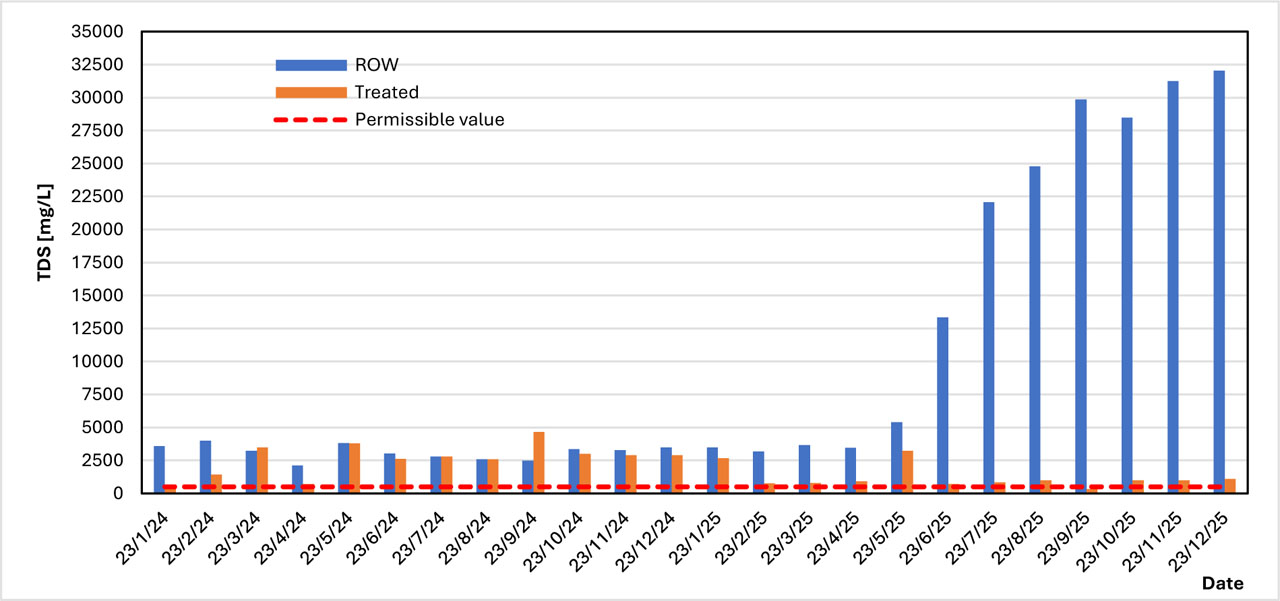
Figure 6:
Monthly variation of (TDS) in raw and treated water compared with WHO drinking water limits at Al-Baradiyah water project (2024–2025)
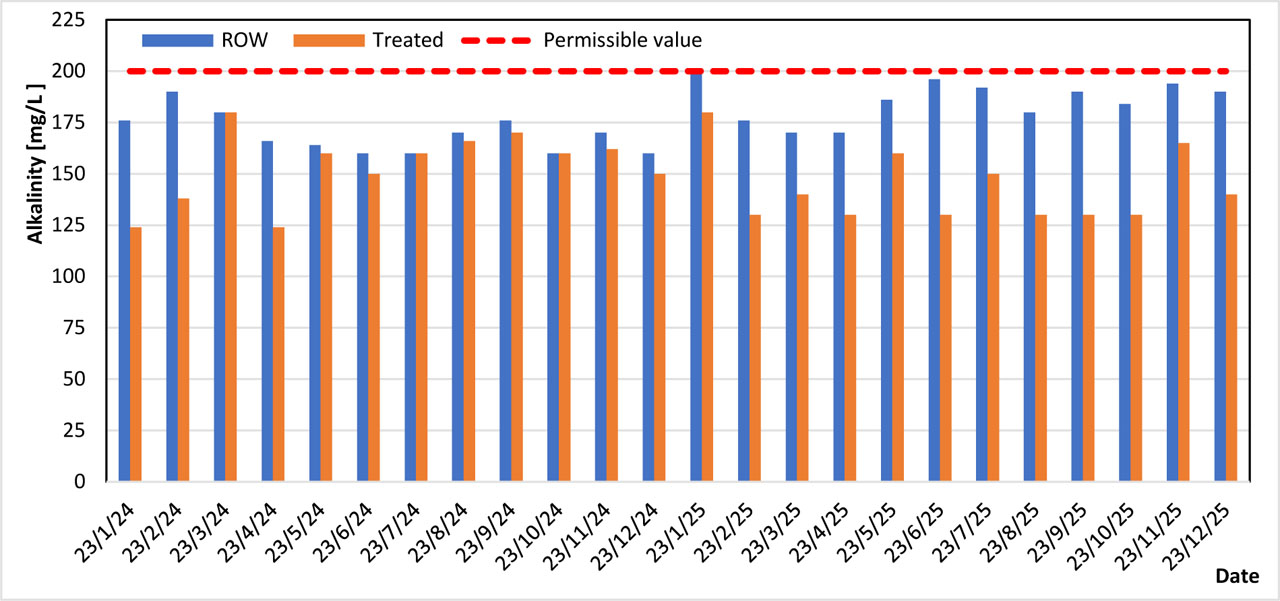
Figure 7:
Monthly variation of (Alkalinity) in raw and treated water compared with WHO drinking water limits at Al-Baradiyah water project (2024–2025)
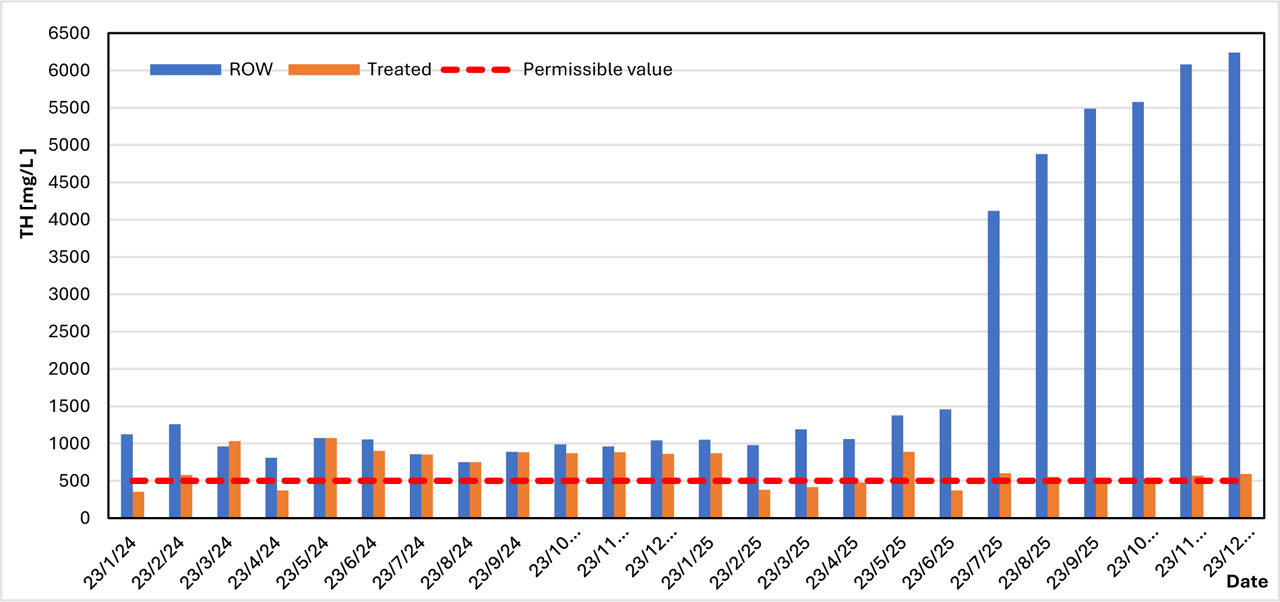
Figure 8:
Monthly variation in Total Hardness (TH) of raw and treated water compared with the WHO guideline limit at Al-Baradiyah water treatment plant (2024–2025)
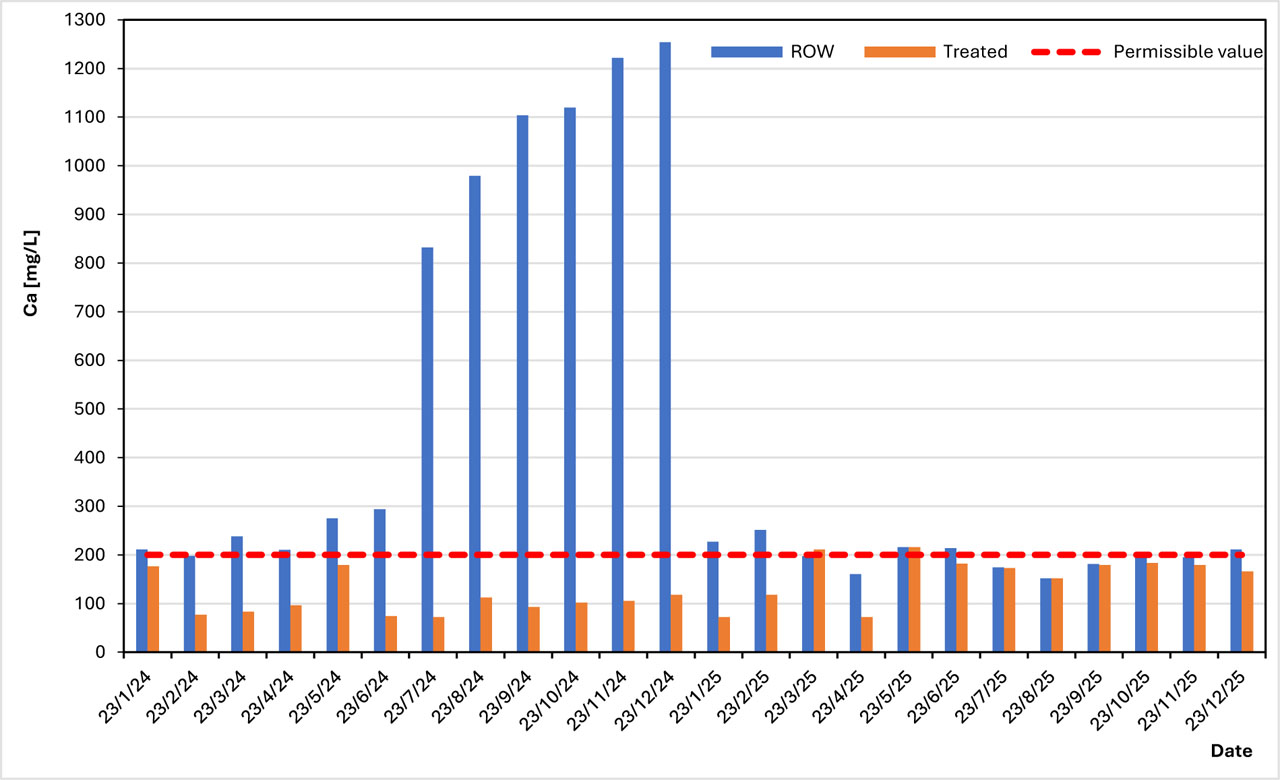
Figure 9:
Monthly variation in calcium concentration in raw and treated water at Al-Baradiyah water treatment plant (2024–2025)
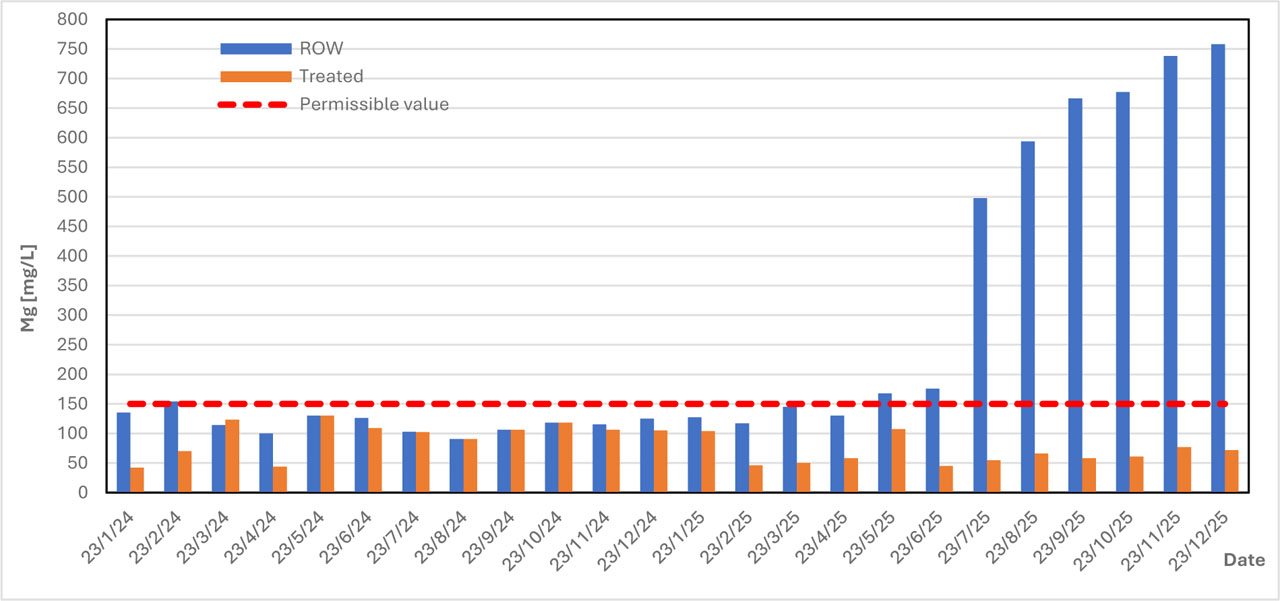
Figure 10:
Monthly variation in magnesium concentration in raw and treated water at Al-Baradiyah Water Treatment Plant (2024–2025)
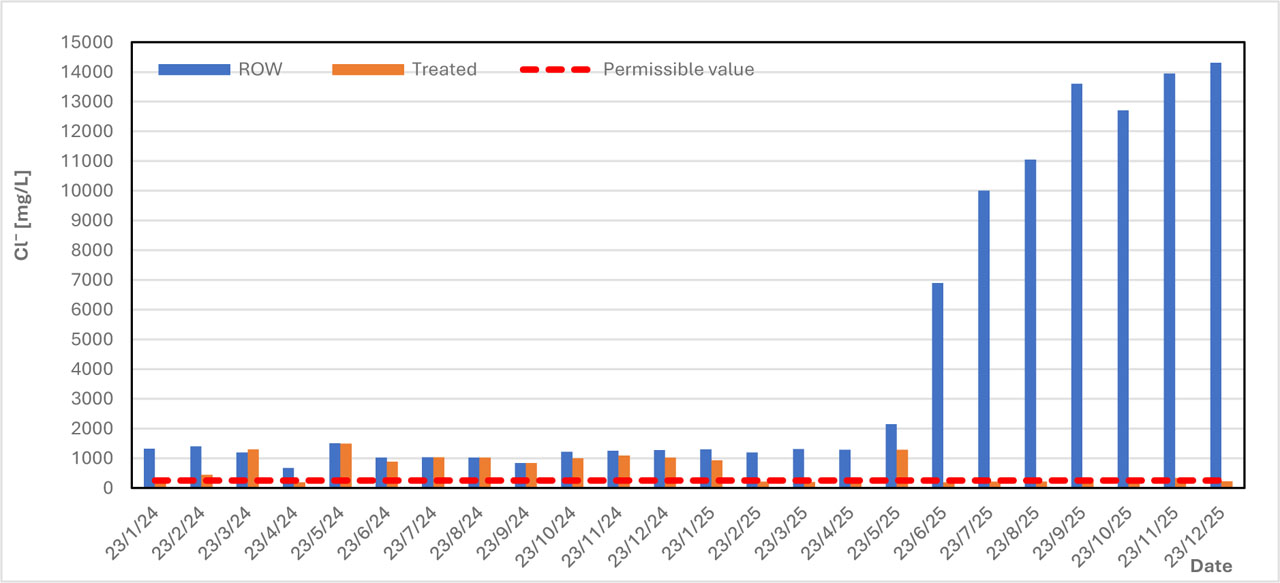
Figure 11:
Monthly variation in chloride concentration of raw and treated water compared with the WHO guideline value at Al-Baradiyah water treatment plant (2024–2025)
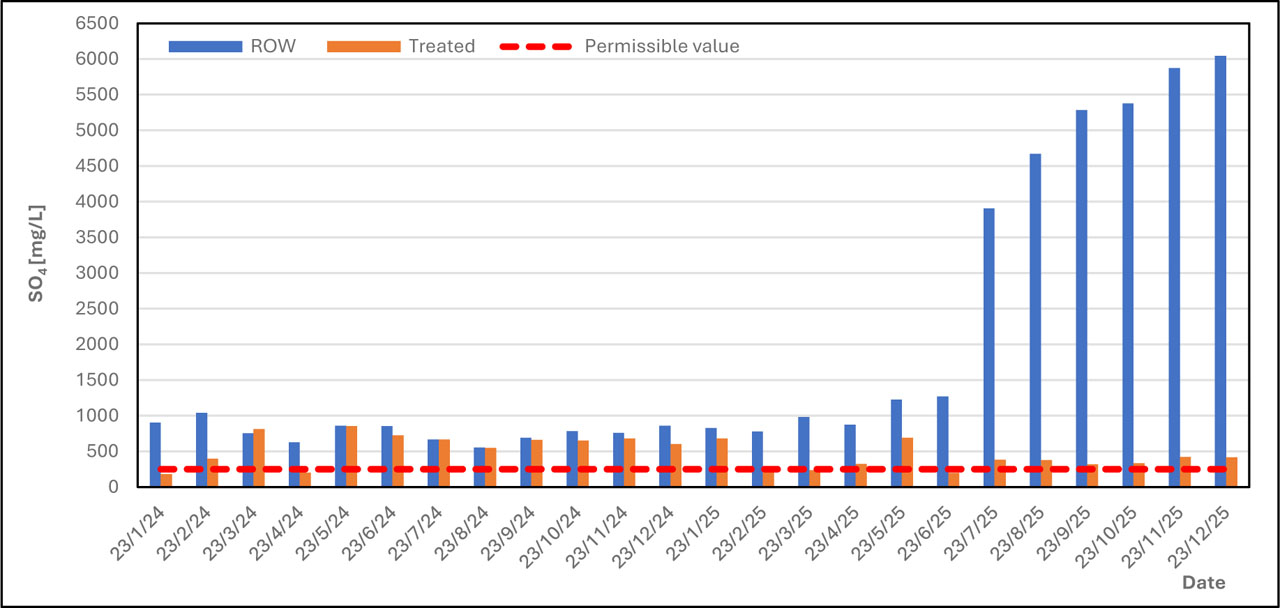
Figure 12:
Monthly variation in sulphate concentration of raw and treated water compared with the WHO guideline value at Al-Baradiyah Water Treatment Plant (2024–2025)
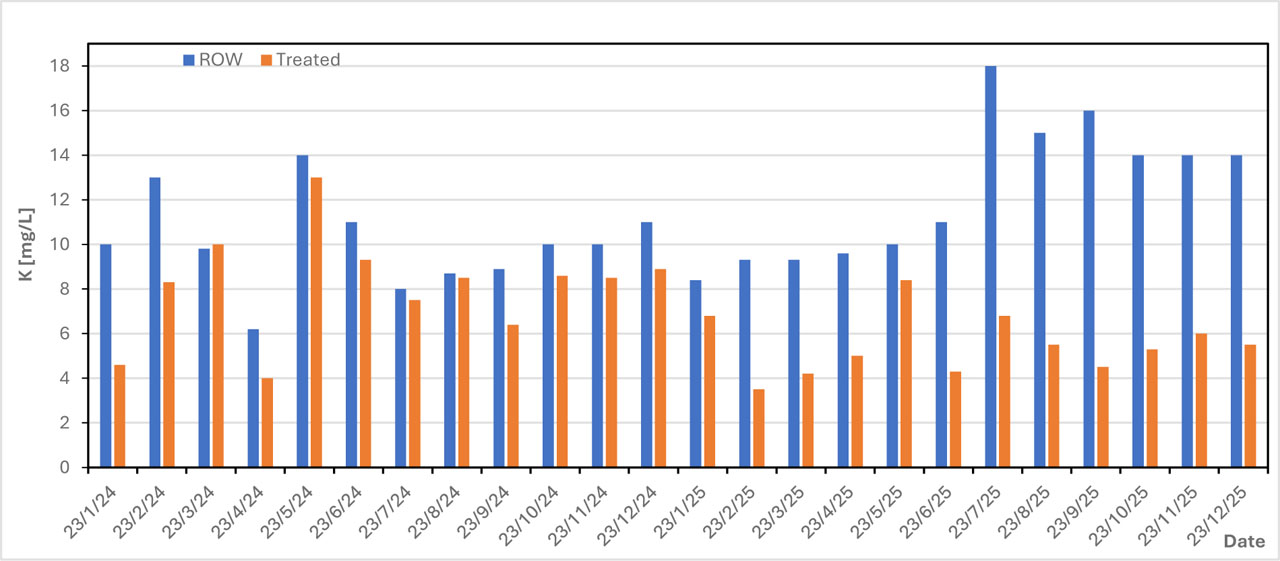
Figure 13:
Monthly variation in potassium concentration of raw and treated water at Al-Baradiyah Water Treatment Plant during 2024–2025
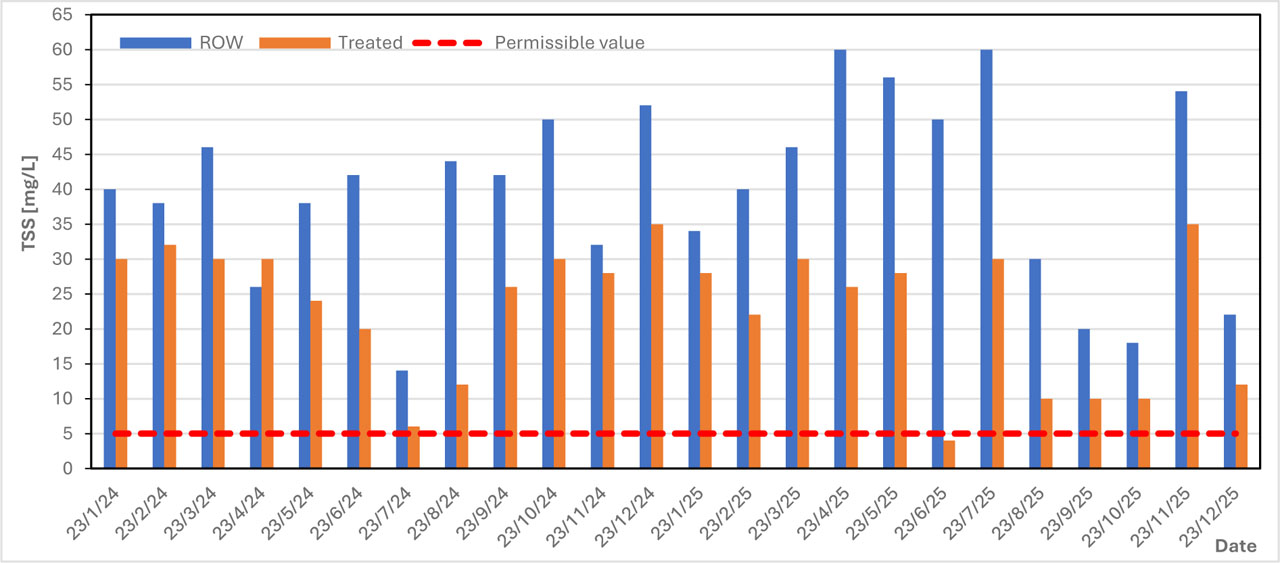
Figure 14:
Monthly variation in Total Suspended Solids concentration of raw and treated water at Al-Baradiyah Water Treatment Plant during 2024–2025
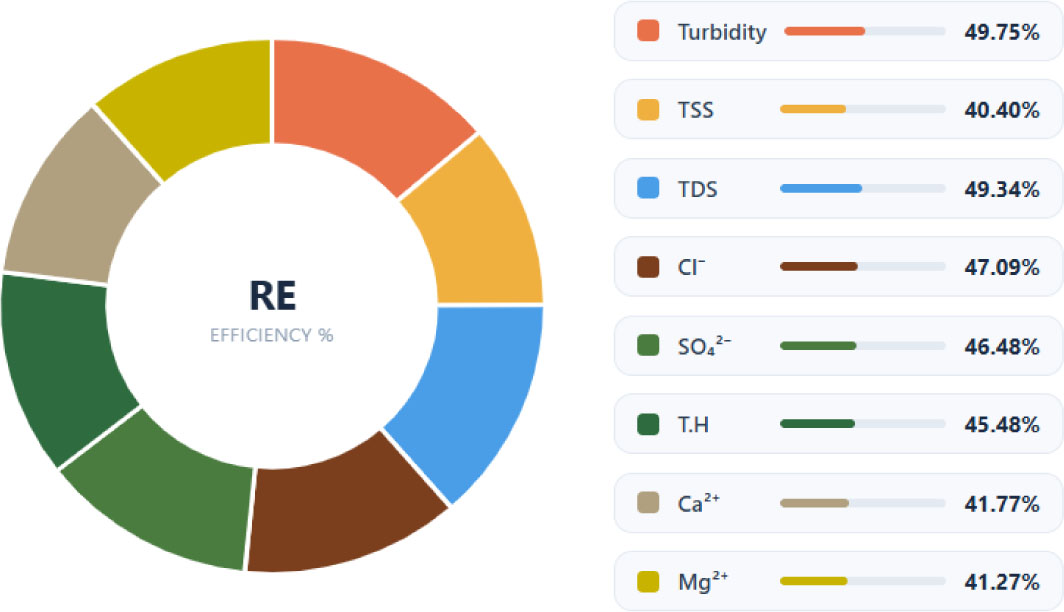
Figure 15:
Mean removal efficiency (%) with minimum–maximum variation for selected water quality parameters at Al-Baradiyah Water Project
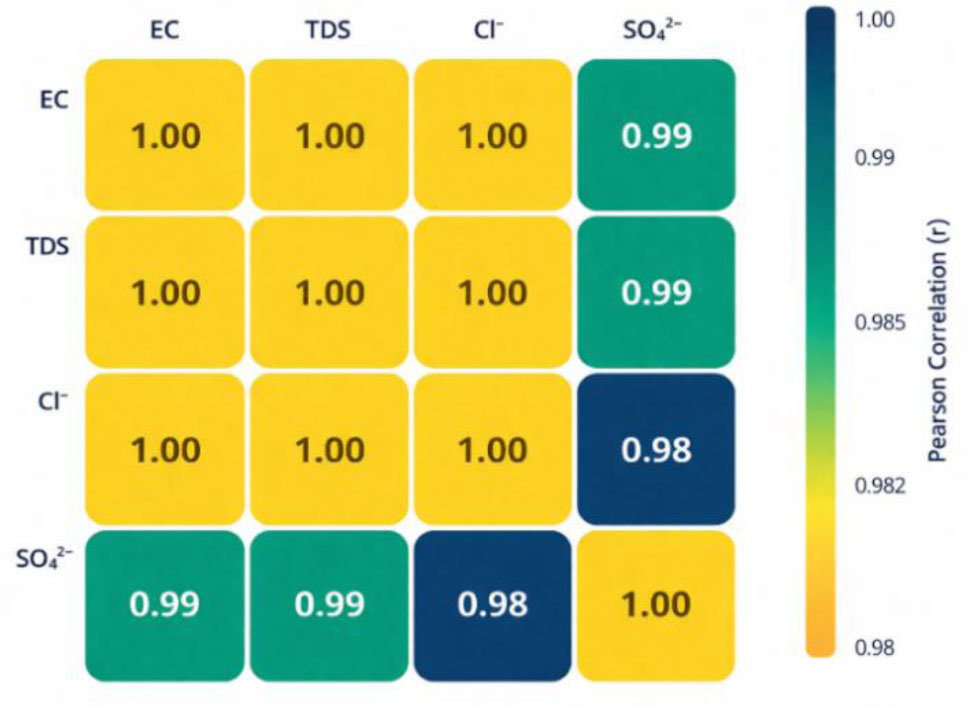
Figure 16:
Correlation matrix of the major salinity indicators in raw water at Al-Baradiyah water project during the 2024–2025 monitoring period
Table 5:
Spatial variation of major salinity-related parameters along the Shatt Al-Arab River, with percentage change relative to the upstream reference station (SH1), 2024
| Impacted river reaches | Chlorides [mg/L] | Sulphates [mg/L] | Total hardness [mg/L] | Total dissolved solids [mg/L] | Increase/decrease in TDS concentration |
|---|---|---|---|---|---|
| SH1: Karma Ali River Monitoring Station, Shatt Al-Arab River | 1036.17 | 427.5 | 968.18 | 2750.83 | An advanced zone affecting the waters of the Shatt Al-Arab |
| SH2: Al-Maqal area | 1069.25 | 441.67 | 952.25 | 2771 | Increase by 0.73% compared with SH1 |
| 3.19% | 3.31% | −1.65% | 0.73% | ||
| SH3: Al-Subiya area near the Saihan Water Project | 1119.5 | 450 | 890.5 | 2797 | Increase by 0.94% compared with SH2 |
| 8.04% | 5.27% | −8.02% | 1.68% | ||
| SH4: Al-Faw area / Boat Marina | 6,370 | 1,750 | 4,995 | 16,566 | Increase by 492.28% compared with SH3 |
| 514.76% | 309.36% | 415.92% | 502.22% |
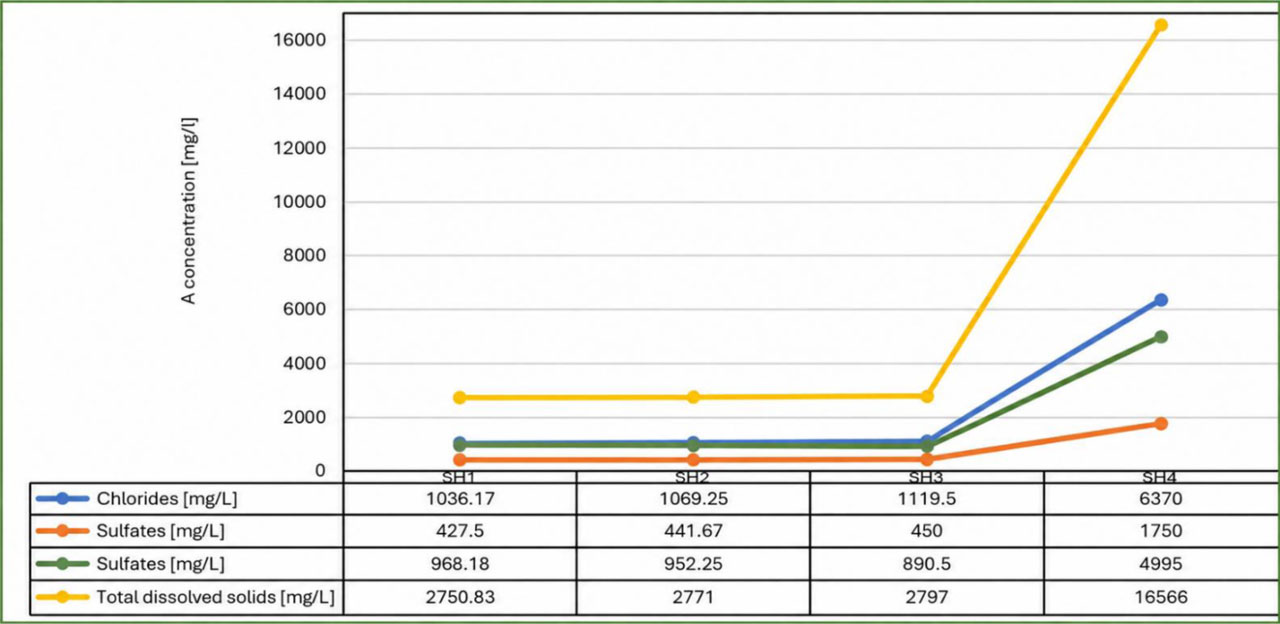
Figure 17:
Percentage increase of major salinity-related parameters along monitoring points (SH1–SH4) in the Shatt Al-Arab River
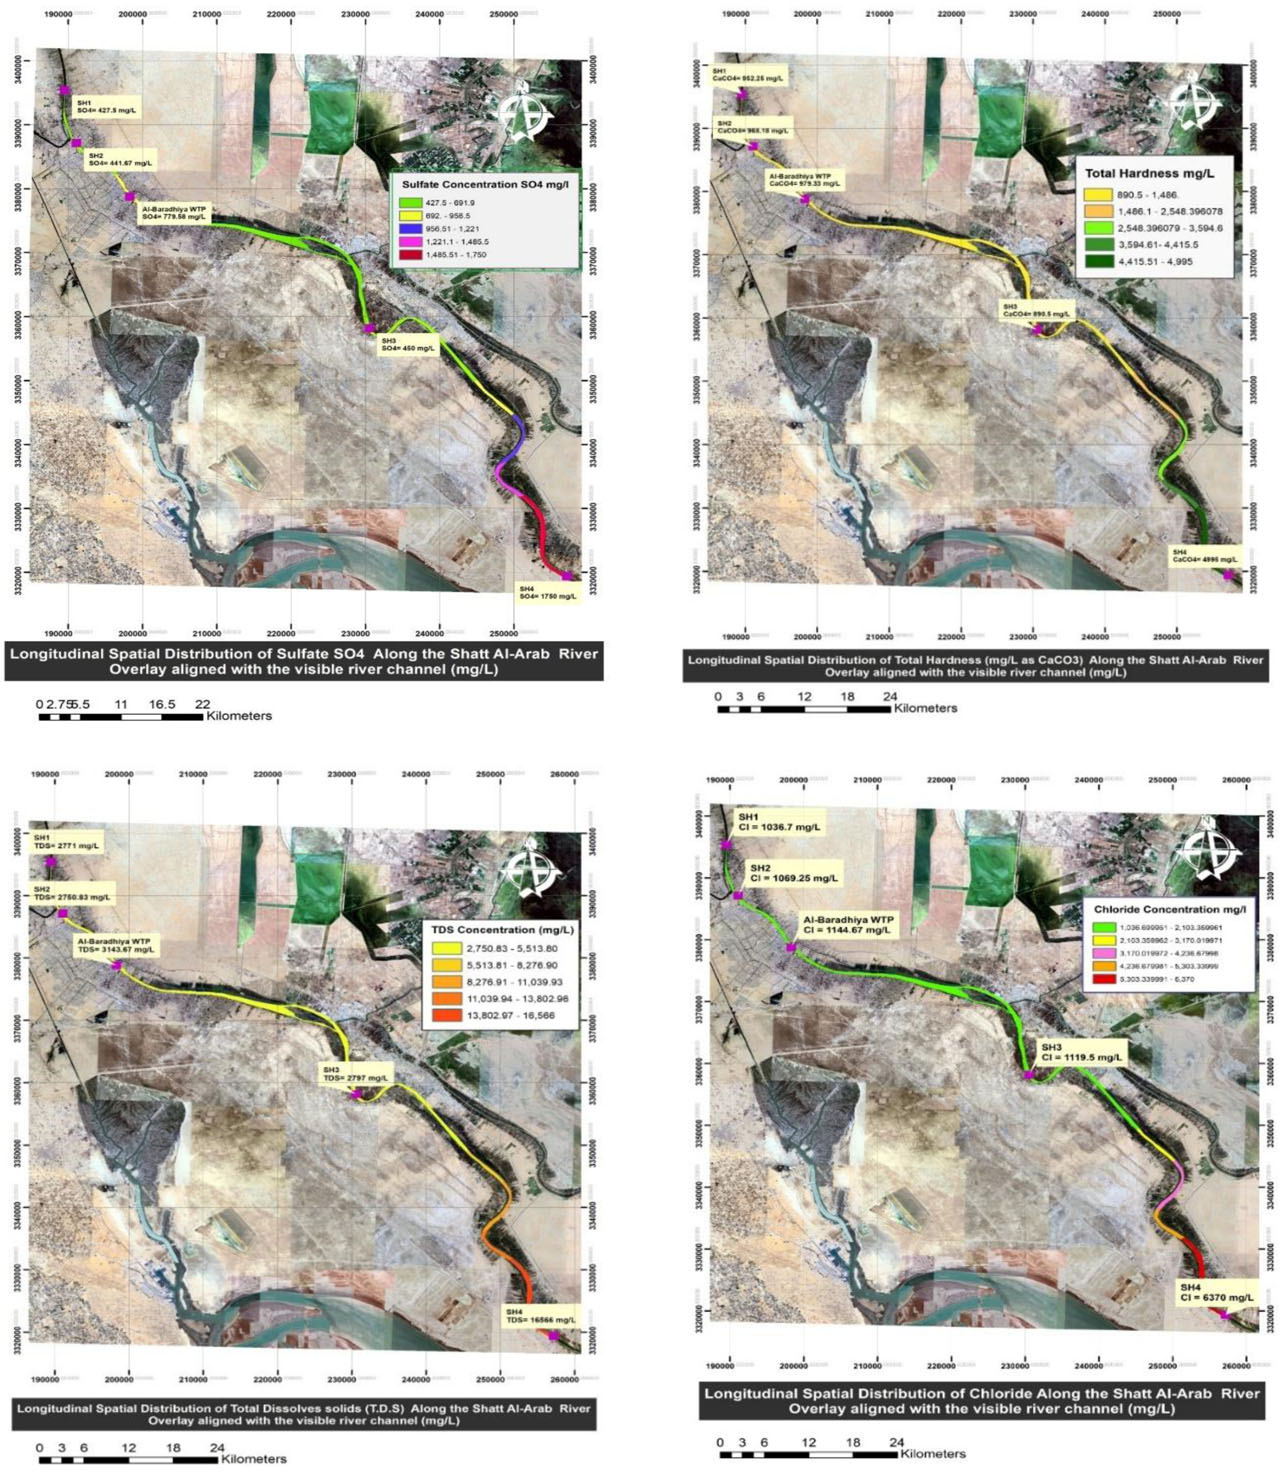
Figure 18:
Longitudinal spatial distribution of major salinity-related parameters along the Shatt Al-Arab River at selected monitoring points in Basra, Iraq (2024): chloride, sulphate, total hardness, and total dissolved solids
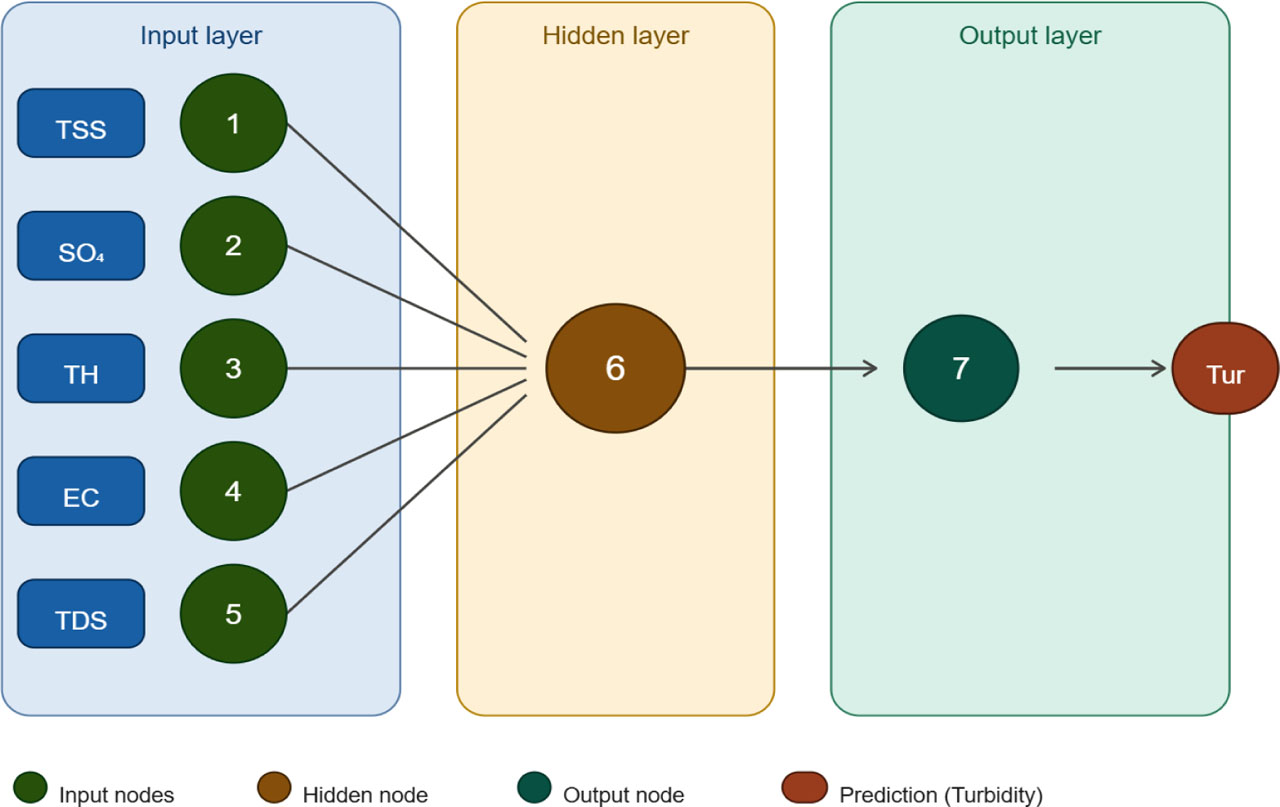
Figure 19:
Architecture of the developed artificial neural network (ANN) model used for turbidity prediction
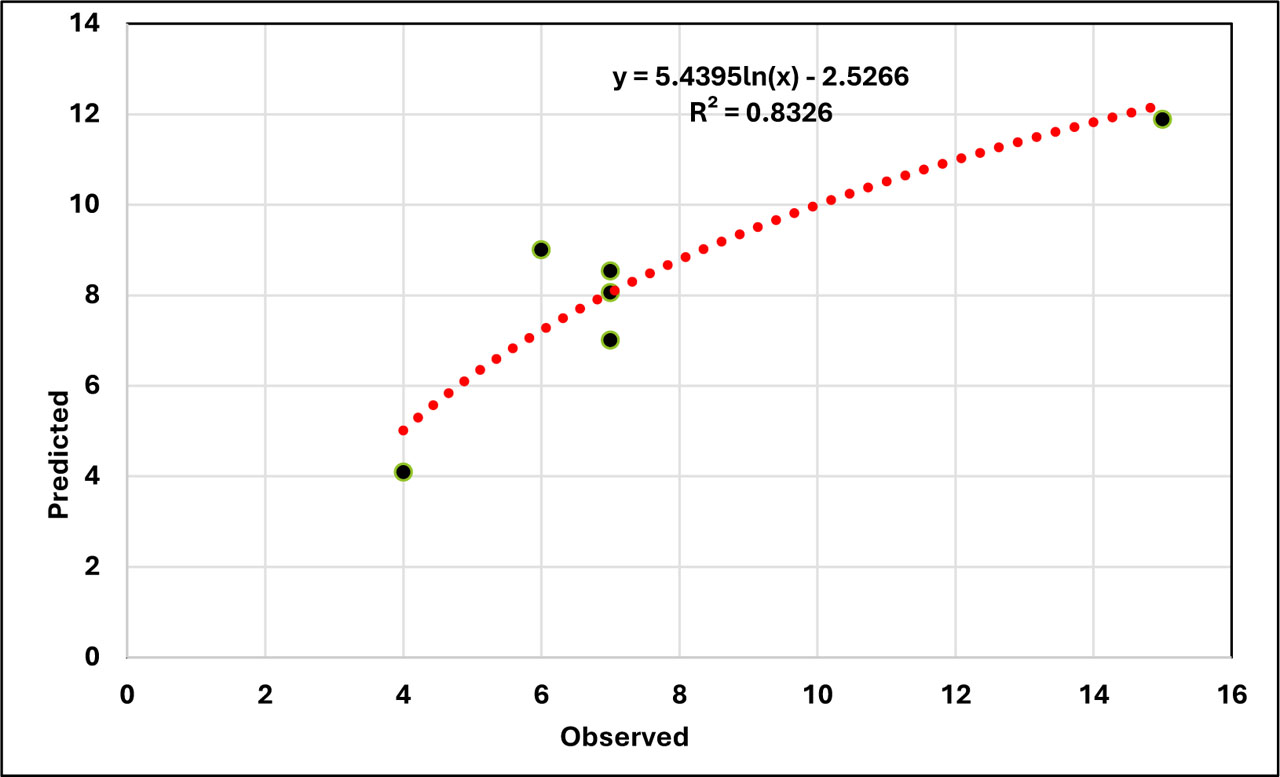
Figure 20:
Comparison between predicted and observed turbidity values for the ANN validation dataset
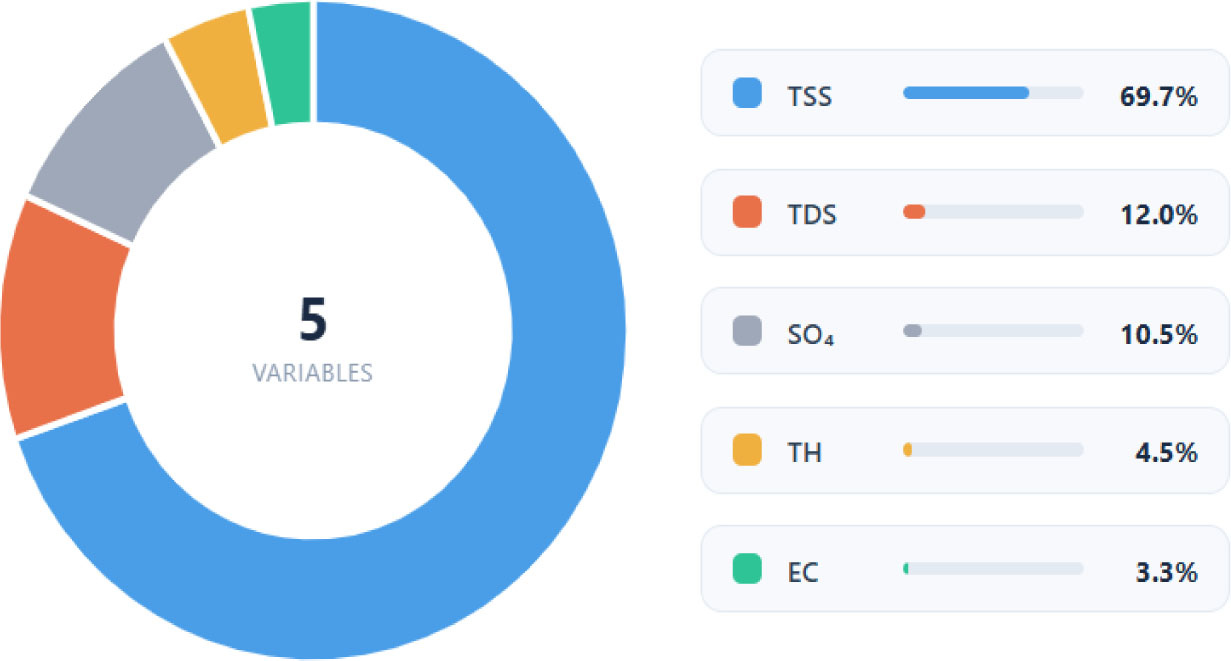
Figure 21:
Relative importance of the selected input variables in ANN-based turbidity prediction