

1. Introduction
Access to safe and potable water is essential for protecting public health, and for achieving environmental sustainability. Yet, rapid population growth, expanding urban demand and mounting pressure on freshwater resources has forced water-quality assessment to the top of several policy agendas as indeed it represents an urgent priority particularly for regions experiencing hydro-environmental stress (Aalipour Erdi et al., 2018). WQI is one of the most commonly used tools in water quality assessment. It is attractive because it condenses a large amount of physicochemical information into one number, thereby greatly simplifying the job for water managers and custodians (Uddin et al., 2021; Fortes et al., 2023). However, in practice the WQI is fixed and cannot respond to rapid hadrochemical changes or complex nonlinear relationships among parameters. It is content with many applications but also it can be regarded largely descriptive, especially in an extreme case when a system must bear strain from environment (Fortes et al., 2023; Gupta & Gupta, 2021). This weakness might constitute a major constraint for assessments in highly dynamic and environment sensitive water bodies. Moreover, conventional monitoring methods come with their own limitations. Obtaining field samples and conducting laboratory experiments/analyses are plagued with significant obstacles, including high costs, time delays, and the inability to provide continuous coverage. In places without sophisticated infrastructure, this is all the more problematic. Because of this, data gaps can exist, and therefore artificial neural network models have been trained to mimic nonlinear relationships found in the environment. Support vector regression is one of the best models for accurate predictions as well following the multilayer perceptron (MLP) based architecture used in water quality studies (Maier & Dandy, 2000). High salinity of the Shatt al-Arab due to tidal intrusion and decreased freshwater input from its tributaries is also known as a serious problem. Here, Al-Obaidy etal. According to Imeh and Younes (2020), environmental problems in arid and semi-arid region of southern Iraq exacerbated due to increased soil along with water salinity. These conditions not only reduce the water quality but also cause great geotechnical and environmental danger with continuous monitoring requirements. It is well known that conventional water treatment processes have a much lower efficiency in removing dissolved salts than suspended particles, particularly at the salinity levels observed today in the Shatt al-Arab (Abdullah et al., 2016; Al-Asadi et al., 2023). These situations call for operational decisions which require methods that are not essentially descriptive and forecasts for water quality declines which cannot be made solely based on observations (Abdullah et al., 2016). Unlike the previous studies, whose applications were limited due to using WQI and ANNs separately, this work fills that gap by providing an integrated methodological framework. This deficiency tends to amplify within destabilized hadrochemical systems since predictions of bona fides for any real-time performance cannot be brought forward but rather require 4-D pre-emptive scalars to adequately assess adaptive delivery across spatial and temporal scales (Quadri et al., 2021). We tried to overcome the previous studies by applying the saline stress conditions and a water quality index with prediction artificial neural network modelling which is applied in this study on drinking water’s treated integrated data monthly obtained from Al-Baradhiyah plant-Basra city. Finally, the real originality and scientific merit of this study is stratification in a stepwise manner of descriptive assessment and predictive modelling; which assures direct practical relevance through a refined decision-making framework for efficient water systems under stress. This research can help explain the hadrochemical problems of Basra and to develop a model of treatment systems for countries with similar environments across the world (Abdullah et al., 2016; Fortis et al., 2023; Quadri et al., 2021).
2. Material and Methods
2.1. Study Area and Plant Description
Al Baradiyah Water Treatment Plant is located in the area of the same name – more precisely, in Al-Ash’ar County, central Basra, in southern Iraq. The geographical coordinates of the site are approximately 30.50267°N and 47.85571°E. Geologically, the area is part of the southern alluvial plain of the Mesopotamian platform. Its sedimentary bed is mainly composed of Holocene fluvial-deltaic deposits, the result of the joint activity of the Tigris and Euphrates rivers; the area has always been influenced by the tides of the Persian Gulf and the intrusion of seawater (Douabul et al., 2020). Figure 1 illustrates that the plant is located near the Shatt Al-Arab River that is the primary source of raw water and greatly defines the hydraulic and environmental environment of the plant (Abdullah et al., 2016). In 1956, the facility is designed to run at an operational capacity of 3,500 cubic meters per hour. Its currently operating volume is around 3000 cubic meters per hour, less than the nominal design capacity but still significant. Despite the old age of the station, it is an integral part of the water supply network in Basra and works for a significant portion of the population in governorate (Al-Chalabi et al., 2020). The geographical location of the station provides real practical benefits to Basra’s urban fabric, such as minimizing pumping and transportation distance for water needs between systems in addition to its distribution, maintenance products, and daily operation (Abdullah et al., 2016).
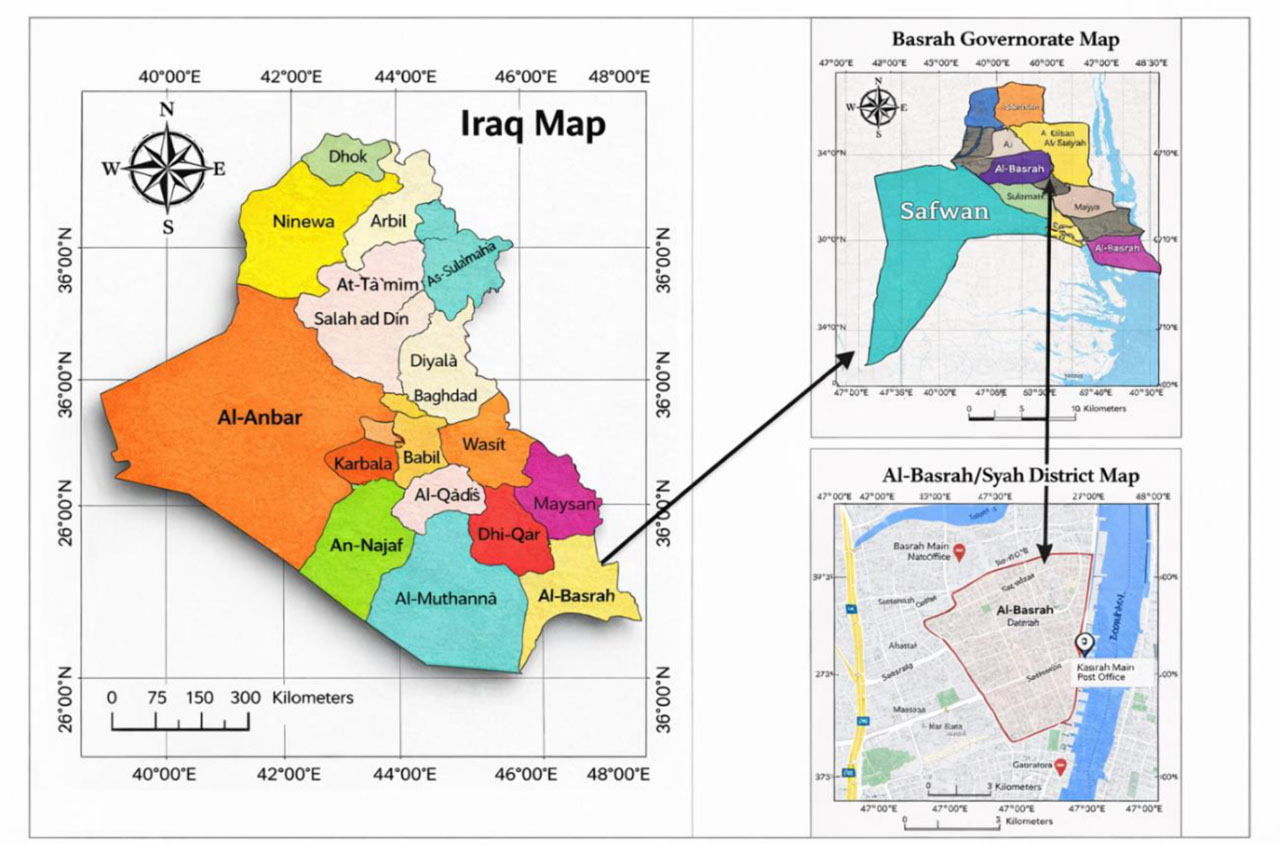
Figure 1:
Location map of Al-Baradiyah water treatment plant in Basra, southern Iraq
2.2. Water Sampling and Dataset Preparation
The current study is premised on a conducted extensive monthly monitoring program within the Al-Baradiyah Water Treatment Plant over the course of 2024–2025. As shown in Figure 2, the sampling structure was planned to comprise two key points of activity: the inlet of raw water and the outlet of treated water. This two-point monitoring scheme is necessary to set a standard of quality of the source-water as well as to measure the overall efficiency of the treatment stages (Abdullah et al., 2016). The analytical variables comprised the main physicochemical parameters commonly used to evaluate water quality status and treatment performance, including turbidity, pH, electrical conductivity (EC), alkalinity (Alk), total hardness (TH), calcium (Ca), magnesium (Mg), chloride (Cl), total suspended solids (TSS), sulphate (SO4), total dissolved solids (TDS), and potassium (K). These parameters were selected because they represent key indicators of drinking water quality and provide a scientifically sound basis for both Water Quality Index (WQI) assessment and ANN-based water-quality analysis under salinity-affected conditions (Ibrahim, 2019; Aswad et al., 2025). Within the methodological framework of the present study, raw water data were used to describe the environmental and hadrochemical dynamics of the Shatt al-Arab River, while treated water data were used to assess the ultimate suitability of the produced water for human consumption.
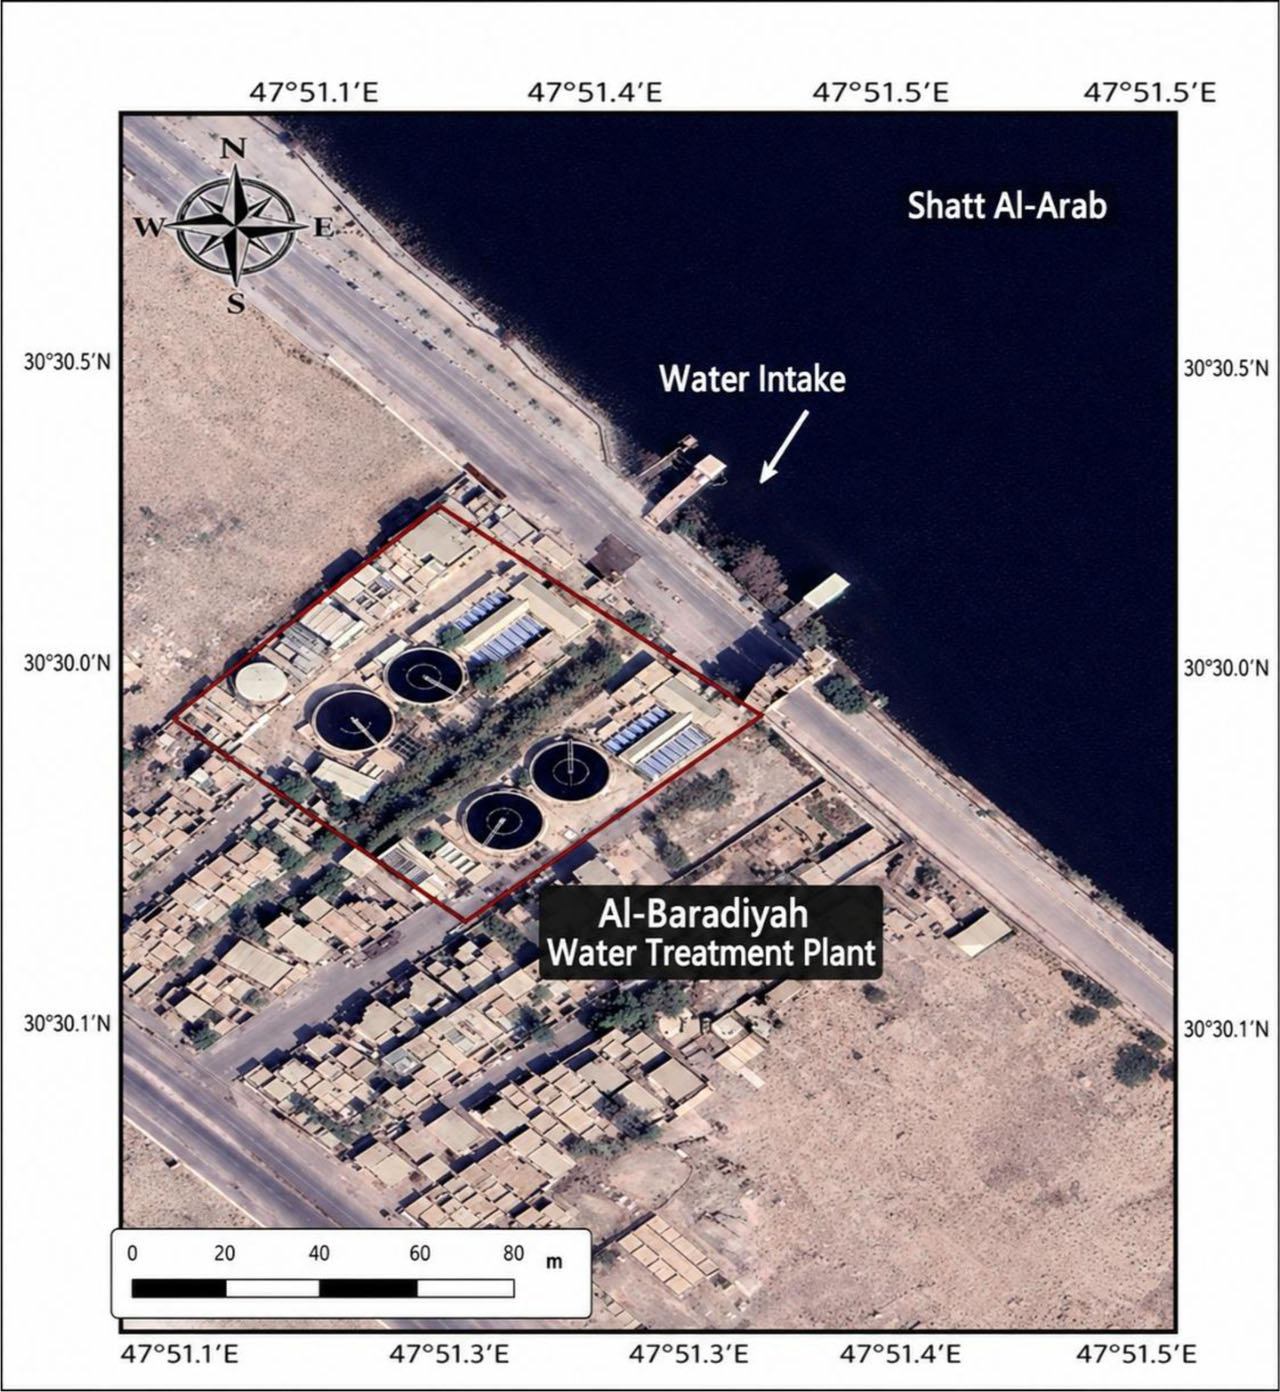
Figure 2:
Google Earth (2026). Satellite image of Al-Baradiyah Water treatment plant
2.3. Water Quality Index (WQI) Assessment
The Water Quality Index (WQI) is a mathematical expression that converts many physical and chemical parameters into one dimensionless number, providing great value as a quantitative tool for qualitative assessment of the quality of treated drinking water. This makes it easier for researchers and water managers to interpret results and make decisions (Ibrahim, 2019). WQI values are calculated through a comparison of the measured concentrations against standards defined by the World Health Organization (WHO), establishing a simple framework for indicating water safety (Aswad et al., 2025). This index serves as a global classification of water suitability throughout varying degrees of salinity levels, needed in Basra Governorate that suffers from the poor supply of water. In some cases, WQI reflects an acceptable status of water and yet some individual parameters show more than permissible limits (Uddin et al., 2021). Thus, only in combination with detailed physical and chemical data this index can be interpreted correctly as a more realistic figure of treatment efficiency and the impact of salinity on final water quality (Quadri et al., 2021; Kim et al., 2020). During the process of selecting criteria for WQI, total suspended solids (TSS) were omitted from the calculation, as the World Health Organization (WHO, 2017) has not established direct health-based guideline values for this parameter in drinking water. This exclusion is consistent with established WQI methodological practice, whereby parameters lacking standardised health-based thresholds are generally excluded from index computation (Uddin et al., 2021). However, this variable was kept as an explanatory one in the artificial neural network (ANN) model for its practical relevance; that is, its impact on turbidity and increased treatment load. The reason is scientific as the calculation of the Water Quality Index (WQI) grants a specific monitoring framework (standardized methods of detection), while the Artificial Neural Network ANN is a forecasting tool dependent on nonlinear relationships able to analyse mixed signals between suspended materials and dissolved salts (Uddin et al., 2021).
2.4. Water Quality Index Calculation
The quality of water can be measured using a broad range of physical, chemical, and biological parameters, but some of these parameters can present similar information when measured against regulatory guidelines. Based on this, composite tools have been extensively used to make interpretation easier through a simplified approach using composite tools like Water Quality Index (WQI). Some of the most common parameters utilized in WQI studies include temperature, biochemical oxygen demand (BOD), faecal coliforms, pH, dissolved oxygen, total phosphate, nitrate, and turbidity (Alobaidy et al., 2010).
Where:
SIi – the sub-index of parameter.
The quality rating (qi) for each parameter was calculated as:
Where:
Ci – Observed variable concentration (i),
Si – parameter(i) regular value according to WHO.
The initial weight (wi) of each parameter was assigned inversely to its standard value
The relative weight (Wi) was then calculated as (Alwaeli et al., 2021).
The sub-index of each parameter was determined using:
Finally, the overall Water Quality Index was obtained from:
After calculation, the resulting WQI values were interpreted according to the classification presented in Table 1.
2.5. Environmental Stress Assessment
Beyond the conventional assessment of treated water, this study incorporated an environmental stress evaluation to clarify the hadrochemical pressures acting on the raw water source of the Al-Baradiyah Water Treatment Plant. This was important as the Shatt Al-arab River suffers from salinity intrusion, tidal fluctuation and reduced upstream freshwater inflow all of which greatly alters the physicochemical condition of the intake water and places significant stress on treatment performance (Al-Tawash et al., 2020). In addition to assessing compliance with environmental standards, this study approach considered environmental pressures differently targeting indicators directly associated with salinity: electrical conductivity, chloride, sulphate and total hardness (Abdullah et al. 2016). In addition to the temporal study of these parameters, spatial maps were also integrated as an auxiliary method in the analysis. The spatial distribution analysis of salinity indicators along the Shatt al-Arab provided solid objective evidence of aquatic environmental stress, demonstrating that these indicators are continually increasing in those places examined (Al-Tawash et al., 2020). So, one thing to be aware of is that treatment plants are distributed within the urban context of Basra so that the raw water intake point faces a plethora contextual complexity. The process of urban activity combined with wastewater from human consumption can result in further contamination to the raw water quality and additional stress on Treatment Plants, subsequently leading to lower application scope for existing resources (Liu et al., 2017). The rise in total dissolved salts and hardness compounds concentrations is also indicative of continued operational stress on the treatment system. This conceptual note is important: an acceptable value of the water quality index does not guarantee freedom from severe environmental stresses in salinity-affected systems (Gupta & Gupta, 2021). Even if the composite index presents a somewhat favourable picture, some of its individual, partial parameters stay at values that jeopardize the stability of the treatment process, accelerate infrastructure deterioration and increase uncertainty whether the long-term functioning of not only (Drupal) but also other solutions on this basis will turn out to be reliable in water distribution networks.
2.6. Treatment Performance and Removal Efficiency Analysis
Removal efficiency was defined for each water-quality parameter as the reduction in concentration from raw-water concentrations to treated-water concentrations. The equation below was used to derive the removal efficiency:
Where:
Craw – Parameter concentration (in raw water),
Ctreated – Parameter concentration (in treated water).
Removal efficiency was used to evaluate the treatment performance of each parameter based on percentage reductions between influent and effluent concentrations. This gives a more accurate assessment than classification of water quality per se, particularly in differentiating among the sediment-related constituents (e.g., turbidity and TSS) from salinity-associated dissolved material. Conventional treatment processes are usually efficient at controlling suspended matter, but much less so for constituent classes that pose challenges during saline source-water conditions (corresponding dissolved inorganic parameters include TDS, EC, chloride and sulphate) (WHO 2017)]. TSS was excluded from the WQI calculation, but it was retained for removal-efficiency analysis because this performance metric assesses parameter-specific treatment performance rather than index-based classification. This is a methodologically appropriate choice, as the selection of WQI parameters depends on models and weighting schemes which vary (Uddin et al., 2021).
2.7. Artificial Neural Network (ANN) Predictive Framework
In this study, to enhance the conventional assessment based on the Water Quality Index (WQI), an artificial neural network (ANN) model was used as a complementary and predictive tool to more accurately represent the complex nonlinear relationships inherent in water systems affected by salinity. Unlike classical statistical approaches, ANN models can extract and model multivariate interactions without imposing predetermined assumptions on the mathematical structure of the data. (Palani et al., 2008; Kouadri et al., 2021). In the present study, the ANN architecture was specifically configured to predict turbidity in a water reservoir as the target dependent variable; in this regard, hydrochemical parameters and selected suspended particles were considered as independent predictor variables. This approach is consistent with the documented applications of ANN in water quality prediction and hydraulic modelling within Iraqi water systems (Ewaid et al., 2018; Al Shaikhli et al., 2024).
2.7.1. Model Architecture and Data Management
Input variables were selected based on a priori knowledge approach to ensure that each selected parameter had a well-established physicochemical significance in the field of water treatment (Maier & Dandy, 2000). Accordingly, the model included five input variables: total suspended solids (TSS), sulphate (SO42−), total hardness (TH), electrical conductivity (EC), and total dissolved solids (TDS). In order to ensure the optimal generalizability of the model and to prevent overfitting, the dataset was divided into three distinct subsets: 60% for the training phase (to optimize the network weights), 20% for the testing phase (to monitor performance during the development process), and 20% for the validation phase (to evaluate the final predictive ability of the model) (Shahin, 2003). The neural network was implemented as a multilayer perception (MLP) using Neuframe software (version 4.0). The optimal architecture consisted of one hidden layer, which is typically sufficient for approximating nonlinear functional relationships in environmental data (Hu & Hwang, 2002). The network training process was based on the error backpropagation algorithm. The momentum coefficient was set to 0.80, and the learning rate was set to 0.20 (Shahin, 2003).
2.7.2. Model Validation and Complementary Interpretation with WQI
The model was validated by comparing the predicted turbidity values with the laboratory-measured turbidity values in the validation dataset. Comparison between measured and predicted uptake for VPA model: Determination coefficient (R2) indicated a close correlation with observed vs. predicted uptake, (R = 0.9125 R2 = 0.8326). This indicates that the model accounted for 83.26% of the variance in the validation data (Aswad et al., 2025; Garson, 1991). Within the methodological scope, this study employed a correlation of two complementary approaches: WQI for assessment and ANN for prediction. In fact, the WQI index is itself a general model for water quality classification of treated water based on WHO standards. But the ANN has yet another duty to fulfil.
However, the ANN has an additional function that is more diagnostic and contrary to turbidity behaviour in salinity intrusion conditions and the relationships between variables (non-linear). This provides a more complete picture of the treatment process when employing these two techniques. While WQI can provide a broad picture of water-quality status, ANN focused on more specific interactions between the key parameters, particularly when salinity stress is high (Kouadri et al., 2021; Palani et al., 2008). It should be highlighted that the ANN model here presented and implemented was generated and dedicated uniquely to turbidity prediction, not aimed at replacing the performance of Water Quality Index (WQI), but rather complementing and expanding the interpretative spectrum in relation to results obtained along with this index.
3. Results and Discussion
3.1. Water Quality Index (WQI)
The value of WQI using the standard equation, calculated for treated water at Al-Baradiyah treatment plant was equal to 90.83 indicating that the quality of this water falls within “good” category (71–90). This outcome suggests that the treated water is largely suitable for human consumption and meets many recognized standards of quality. That’s a top-down perspective, but if we look at individual parameters, it paints a bit more nuanced picture. In the present study, as shown in Table 2, TDS, EC, Cl−, SO42− and TH were higher than WHO permissible limits. This elevation can be ascribed to higher salinity of Shatt al-Arab River which is affected by tidal intrusion related to Mediterranean Sea and lower upstream freshwater discharge. Thus, it should be noticed that a composite WQI value at “good” should not be considered alone. Even when the overall composite index is favourable, persistent hydro-chemical stress of individual parameters exceeding guideline values can be concealed by the mathematical aggregation process. In line with the increasing salinity stress on local water resources, ongoing enhancement of treatment efficiency and routine measurement of specific quality indices are significant. This result is also in accordance with WQI calculations from other river systems of Iraq which report similar exceedances for specific parameters although the total composite score was acceptable, highlighting the well-documented limitation of aggregate indices to obscure loss of individual parameter quality (Hassan et al., 2025).
Table 1:
Relative weight of selected physicochemical parameters to determine the water quality index (WQI) in the effluent water of the Al-Baradiyah treatment plant
| Parameters | Permissible value (si) WHO | IQS 417 (si) [mg/L] | Observed values (ci) | qi (ci/si)*100 | W(1/si) | Wi = w/sumw | Sli=wi*qi | Exceeds IQS 417 |
|---|---|---|---|---|---|---|---|---|
| TDS | 500 | 500 | 1906.20 | 381 | 0.002 | 0.01 | 2.10 | Yes |
| Turb | 5 | 5 | 4.02 | 80.4 | 0.2 | 0.55 | 44.36 | No |
| E.C | 1000 | 2786.54 | 279 | 0.001 | 0.00 | 0.77 | N/A | |
| Ca | 200 | 75* | 132.9 | 66.5 | 0.005 | 0.01 | 0.92 | Yes |
| Mg | 150 | 50* | 81 | 54 | 0.0067 | 0.02 | 1.00 | Yes |
| TH | 500 | - | 670.2 | 134 | 0.002 | 0.01 | 0.74 | N/A |
| pH | 8.5 | 7.0–8.5 | 7.7 | 91 | 0.1178 | 0.32 | 29.57 | Within |
| Cl | 250 | 200* | 620.5 | 248 | 0.004 | 0.01 | 2.74 | Yes |
| SO4 | 250 | 200* | 481.8 | 193 | 0.004 | 0.01 | 2.13 | Yes |
| Alk | 150 | - | 177.5 | 118 | 0.02 | 0.06 | 6.51 | N/A |
| Sum | - | 0.3625 | 1 | 90.83 |
- = No guideline value specified in IQS 417 (ICOSQC, 2009). Exceeds IQS 417 column based on the acceptable limit. Ca and Mg mean values in treated water (132.9 and 81 mg/L) exceed IQS 417 acceptable limits (75 and 50 mg/L respectively) but remain within the maximum allowable limits.
Table 2:
Monthly Water Quality Index (WQI) values for treated water at Al-Baradiyah water treatment plant (2024–2025)
| Month | WQI Value | Classification | Salinity period |
|---|---|---|---|
| Jan–2024 | 94.19 | Excellent | Normal |
| Feb–2024 | 98.26 | Excellent | Normal |
| Mar–2024 | 108.72 | Excellent | Normal |
| Apr–2024 | 91.63 | Excellent | Normal |
| May–2024 | 101.47 | Excellent | Normal |
| Jun–2024 | 86.43 | Good | Moderate salinity |
| Jul–2024 | 68.31 | Medium | Moderate salinity |
| Aug–2024 | 81.37 | Good | Moderate Salinity |
| Sep–2024 | 105.92 | Excellent | Moderate Salinity |
| Oct–2024 | 103.36 | Excellent | Moderate Salinity |
| Nov–2024 | 106.18 | Excellent | Moderate Salinity |
| Dec–2024 | 104.37 | Excellent | Moderate Salinity |
| Jan–2025 | 104.16 | Excellent | Normal |
| Feb–2025 | 85.15 | Good | Normal |
| Mar–2025 | 97.43 | Excellent | Normal |
| Apr–2025 | 92.59 | Excellent | Normal |
| May–2025 | 107.36 | Excellent | Moderate Salinity |
| Jun–2025 | 58.66 | Medium | High Salinity Intrusion |
| Jul–2025 | 96.08 | Excellent | High Salinity Intrusion |
| Aug–2025 | 65.07 | Medium | High Salinity Intrusion |
| Sep–2025 | 61.02 | Medium | High Salinity Intrusion |
| Oct–2025 | 68.01 | Medium | High Salinity Intrusion |
| Nov–2025 | 81.89 | Good | Normal |
| Dec–2025 | 73.86 | Good | Normal |
To address the limitations of mean-based WQI computation, 24 individual monthly WQI scores were additionally calculated for the study period. As presented in Table 3, the monthly WQI values ranged from 58.66 in June 2025 to 108.72 in March 2024. Results revealed that WQI values ranged from 58.66 (June 2025 – Medium category) to 108.72 (March 2024), with a monthly mean of 89.23. Fourteen months were classified as Excellent, five as Good, and five as medium quality. Notably, all five Medium-quality months coincided with periods of intensified salinity intrusion (June–October 2025), confirming that the single composite score of 90.83 conceals critical temporal deteriorations in water quality during peak salinity events.3.1.1 Environmental Interpretation of the WQI Results under Salinity Stress.
3.1.1. Environmental Interpretation of the WQI Results under Salinity Stress
Water Quality Index (WQI) is a widely used and simple water quality assessment tool; however, in saline systems, interpretation of its output is not so straightforward. Sometimes, the WQI score is in an “acceptable” or “good” range but that does not mean there is no environmental stress. Certain single parameters can be persistently high signalling a specific kind of damage that the composite index then tends to mask over time. Indeed, the WQI is best used as a general, indicative assessment rather than as a precise tool to demonstrate the actual condition of a water source or the efficiency of its treatment plants (Chidiac et al., 2023; Fortes et al., 2023). The substantial water quality alterations detected by this study correspond closely to salinity pressures upon the Shatt al-Arab system. Recent evidence suggests that there are two pathways through which saltwater intrusion into the river is amplified; by tidal forces and by losses from freshwater discharges. Over time this causes a gradual change in hydro-chemical characteristics of river water and moves the salinity front upriver (Abdullah et al., 2016; Al-Tawash et al., 2020). Considering this background, high concentration of TDS, electrical conductivity chloride, sulphate and total hardness values found in this study are not sporadic phenomena but manifestations of broader environmental processes. Two main issues related to WQI that may obscure salinity stress (and their long-term effects, it will be shown) on treatment efficiencies, infrastructure reliability and security of water supplies if individual components are accepted mechanically. For instance, emerging evidence indicates that the accumulation of chloride and sulphate causes accelerated corrosion, encrustation and shortened material life in distribution systems. That is, without physicochemical profiles, WQI scores hold little significance (Zhang et al., 2024).
3.2. Physicochemical Characteristics of Raw and Treated Water
A total of 24 data points were obtained for each parameter, with raw and treated water sampled monthly over a period of two years (2024–2025). Several physicochemical variables were analysed to characterize the hadrochemical properties of incoming water and evaluate the efficiency of the treatment process in improving drinking water quality. Statistical data were evaluated against both the World Health Organization (WHO, 2017) guidelines and the Iraqi National Drinking Water Standard (IQS 417; ICOSQC, 2009), as presented in Tables 4 and 5. Parameters for which IQS 417 does not specify guideline values – namely EC, total hardness, alkalinity, and potassium were evaluated against WHO guidelines only. Descriptive statistics for raw water (Table 4) show a pronounced variability of water quality parameters during the study period, particularly with salinity-related ones. The average values of EC, TDS, chloride, sulphate (and total hardness) are all high which strongly indicates that the saltwater intrusion into Shatt al-Arab is an ongoing process. The very high standard deviation of these parameters is one less studied. This spread indicates that the composition of the raw water must have undergone significant changes over time. These fluctuations may be due to tidal shifting, irregular supplies of fresh water and seasonal hydrological changes. In conclusion, we provide data indicating that the incoming water has been chronically exposed to significant environmental stress over the entire monitoring period.
Table 3:
Descriptive statistics for raw water parameters
| Descriptive | N | Minimum | Maximum | Mean | Std. deviation | IQS 417 [mg/L] |
|---|---|---|---|---|---|---|
| Turb | 24 | 3.83 | 14.9 | 8.3 | 3.58 | 5 / 25* |
| pH | 24 | 7.5 | 8 | 7.74 | 0.145 | 7.0–8.5 / 6.5–9.2* |
| E.C | 24 | 3,386 | 48253 | 15316.96 | 16647.70 | - |
| Alk | 24 | 160 | 200 | 177.5 | 12.68 | - |
| TH | 24 | 752 | 6240 | 2134.90 | 1965.30 | - |
| Ca | 24 | 152 | 1254 | 429.8 | 394.7 | 75 / 200* |
| Mg | 24 | 91 | 758 | 258.8 | 238.9 | 50 / 150* |
| Cl | 24 | 675 | 14300 | 4310.6 | 5093.1 | 200 / 600* |
| SO4 | 24 | 553 | 6043 | 1936.10 | 1962.60 | 200 / 400* |
| TSS | 24 | 14 | 60 | 39.75 | 13.15 | - |
| TDS | 24 | 2,122 | 32,038 | 9947.8 | 11052.5 | 500 / 1500* |
| K+ | 24 | 6.2 | 18 | 11.22 | 2.88 | - |
* IQS 417 format: Acceptable limit / Maximum allowable limit when no better source is available (ICOSQC, 2009).
- = No guideline value specified in IQS 417 for this parameter; evaluation conducted against WHO (2017) guidelines only.
Data obtained from raw water (Table 4) and treated water (Table 5) proved that all parameters such as turbidity, calcium, magnesium and chloride were significantly lower in the case of treated effluent, which indicates the increased physicochemical quality of the effluent at treatment plant. However, a more granular parameter-level analysis shows that this benefit is not evenly distributed between all constituents. Although all different stages of treatment were completed, salinity parameters (EC, TDS chloride, sulphate and total hardness) continued to be high after the treatments conducted at this water. This trend is a consequence of the basic limitation of conventional treatment processes that are mainly designed for removal of suspended solids, so they are by structure inadequate to be effective in reducing dissolved ionic constituents. It is therefore concluded that while the treatment plant regulated physical contamination and suspended solids effectively, dissolved salts and hardness-forming species in the final effluent remain abnormally high suggesting that acceptable levels dissolved ionic load remain problematic under current saline source-water conditions.
Table 4:
Descriptive statistics for treated water parameters
| Descriptive | N | Minimum | Maximum | Mean | Std. deviation | IQS 417 [mg/L] |
|---|---|---|---|---|---|---|
| Turb | 24 | 1.84 | 5 | 4.02 | 1.19 | 5 / 25* |
| pH | 24 | 7.1 | 8.19 | 7.69 | 0.27 | 7.0–8.5 / 6.5–9.2* |
| E.C | 24 | 1,022 | 6,037 | 2,786.54 | 1,707.01 | - |
| Alk | 24 | 160 | 200 | 177.5 | 12.68 | - |
| TH | 24 | 352 | 1,072 | 670.2 | 229.9 | - |
| Ca | 24 | 72 | 216 | 132.9 | 48.9 | 75 / 200* |
| Mg | 24 | 42 | 130 | 81 | 28.6 | 50 / 150* |
| Cl | 24 | 150 | 1,490 | 620.5 | 453.5 | 200 / 600* |
| SO4 | 24 | 183 | 855 | 481.8 | 213 | 200 / 400* |
| TSS | 24 | 4 | 35 | 22 | 9.7 | - |
| TDS | 24 | 317 | 4,646 | 1,906.20 | 1,247.30 | 500 / 1500* |
| K+ | 24 | 3.5 | 13 | 6.81 | 2.33 | - |
* IQS 417 format: Acceptable limit / Maximum allowable limit when no better source is available (ICOSQC, 2009).
- = No guideline value specified in IQS 417 for this parameter; evaluation conducted against WHO (2017) guidelines only.
Strangely, this contrast is not something you would get from the single snapshot of success or failure that Tables 4 and 5 represent when reviewed in isolation. The reality is more complex. The El Baradiyah Water Treatment Plant has made significant strides in the quality of water entering its gates, but this is not a solution at all, as raw water salinity has historically become one of the most indicative characteristics for the source. What has actually hindered the conditions of its work is not technical engineering weakness as much as it is related to the continuous erosion of the aquatic environment of the Shatt al-Arab River. The highest EC measured during monitoring was an incredible 48,253 microsiemens/cm. This is not a natural ebb and flow. That is a mechanism we have observed in other systems (Abdullah et al., 2016) but, under low river flow conditions this could result in acute and intermittent salinities consistent with cyclic tidal inversions. This figure captures the hydrochemical stress forcing along treatment plant inlet and it also reminds that there would always be a disequilibrium between treatment unit award management efficiency and source water quality dramatically declining.
3.2.1. Turbidity
A reasonably illustrative representation of the turbidity status in the raw water sample is depicted in Figure 3. This parameter in particular reached a maximum of 14.9 NTU, exceeded the World Health Organisation (WHO) limit of 5 NTU on four occasions and showed pronounced spatiotemporal variability during the monitoring period. Of course, given how river systems respond to seasonal hydrological changes and how suspended sediments behave in them, this instability in the quality of the water source is not far-fetched (WHO, 2017; Łukasiewicz, 2025). In contrast, the situation in the treated water looks more reassuring.
Turbidity remained within acceptable limits for most of the study period, indicating the overall efficiency of the treatment processes in removing suspended solids. However, the numbers were not always far below the limit at some points, the values were close enough to the 5 NTU limit to raise the question: how much margin of safety is left for the treatment plant under operating pressure? (WHO, 2017; Łukasiewicz, 2025).
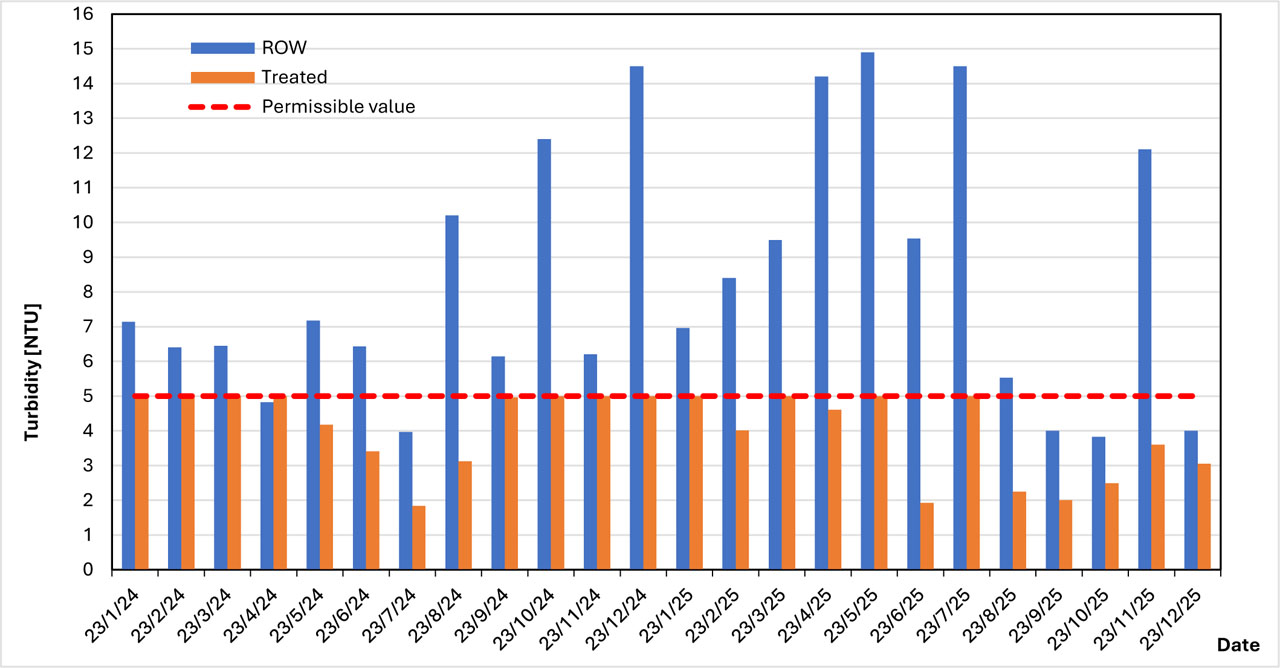
Figure 3:
Monthly variation of turbidity in raw and treated water compared to WHO drinking water limits at Al-Baradiyah water project (2024–2025)
3.2.2. (pH)
Figure 4 shows the changes in the pH of raw and treated water at the El Baradiyah treatment plant during the 2024–2025 monitoring period. The pH values throughout this period were within the range of 6.5 to 8.5 – the range that the WHO considers acceptable for drinking water – indicating a relatively stable chemical condition of the water source (WHO, 2017). The small fluctuations in the pH of the raw water are likely related to the inherent buffering capacity of the source. On the other hand, the small changes observed in the pH of the treated water can be attributed to the effect of the chemicals used in the treatment process as well as the gradual changes in water chemistry due to seasonal changes. Maintaining the pH within this range is of real operational importance; it both prevents corrosion in the distribution network and maintains disinfection efficiency at the desired level (WHO, 2007). In general, the data obtained from this study showed that El Baradiyah treatment plant was able to complete an acceptable control of this parameter during the period under consideration and that the effluent values at demand point met international drinking water standards (WHO, 2017).
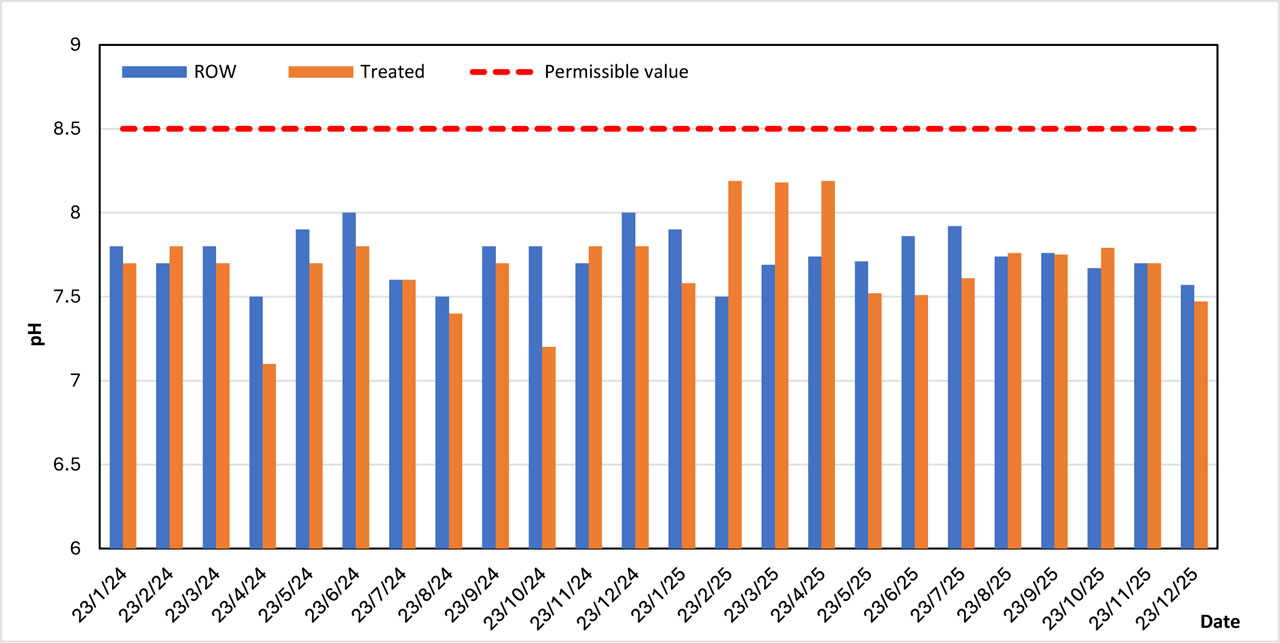
Figure 4:
Monthly variation of pH in raw and treated water compared with WHO drinking water limits at Al-Baradiyah Water Project (2024–2025)
3.2.3. Total Dissolved Solids (TDS) and Electrical Conductivity (EC)
Monitoring data for the 2024–2025 period reveals a worrying situation. EC and TDS in the incoming raw water remained above the permissible limits throughout this period and increased significantly in the final months of 2025 (Figures 5 and 6). Simply put, the water source is under severe salinity stress. EC indicates how much dissolved ions are present in the water, and TDS reflects the total dissolved salt load when both parameters remain high for a long time, this means a gradual deterioration of the hydrochemical quality of the water (WHO, 2017). In the Shatt al-Arab basin, this situation is not so unexpected; the river has long been subject to saltwater intrusion from downstream due to tidal action, and the lack of freshwater flow from upstream exacerbates this problem (Abdullah et al., 2016). In fact, logical evidence also supports this view. Seawater intrusion appears to have become the most important factor in changing the hadrochemical composition of the river in southern Iraq (Al-Assadi et al., 2023). Of course, in some months, the treatment operation was able to reduce EC and TDS to some extent, but the point is that the concentration of these parameters in the treated water still remained above the standard in most cases. This is not surprising, since conventional drinking water treatment systems are inherently designed to separate suspended solids and have a more limited function in removing dissolved salts (WHO, 2017). The conclusion that can be drawn from the persistence of high EC and TDS values at the treatment plant outlet is that the fundamental problem of the Al-Baradiyah water treatment plant in its current state is the salinity of the incoming water, not its turbidity (Abdullah et al., 2016).
When assessed against the Iraqi National Standard (IQS 417; ICOSQC, 2009), mean TDS in treated water (1,906.20 mg/L) was found to exceed the IQS 417 acceptable limit of 500 mg/L by approximately 3.8 times, consistent with the exceedance observed against the WHO guideline value. As IQS 417 does not specify a guideline value for EC, this parameter was evaluated against the WHO limit of 1,000 μS/cm only, against which treated water EC (mean: 2,786.54 μS/cm) was persistently exceeded throughout the monitoring period. These findings confirm that the treated water at Al-Baradiyah fails to meet both international and national regulatory thresholds for dissolved ionic content.
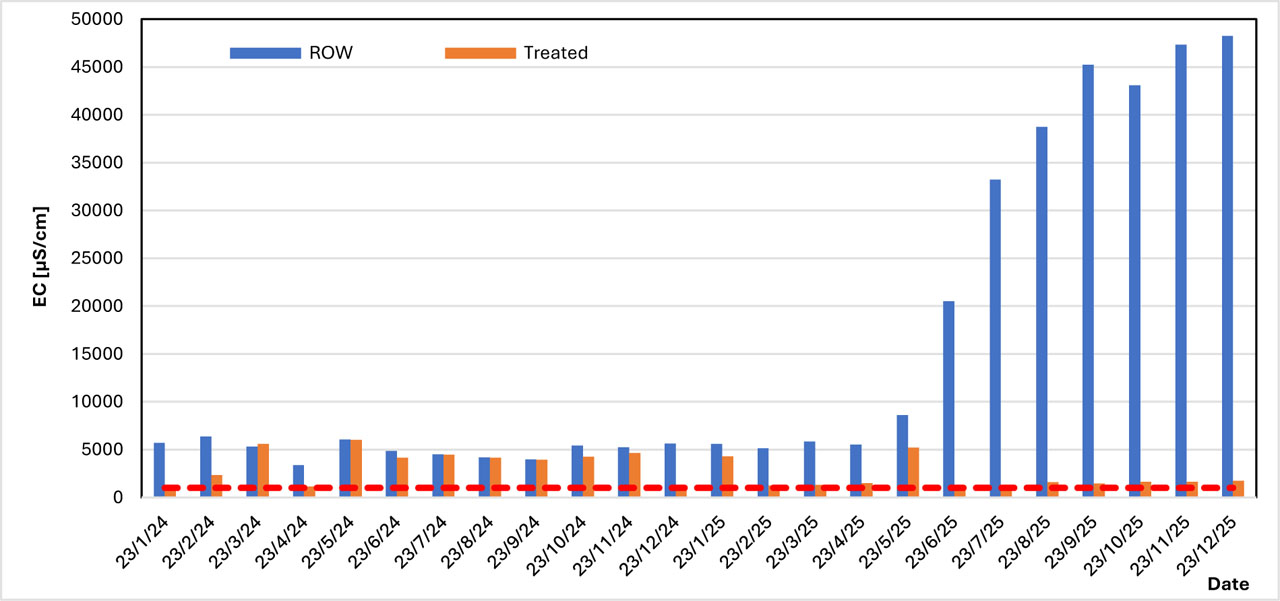
Figure 5:
Monthly variation of (EC) in raw and treated water compared with WHO drinking water limits at Al-Baradiyah Water project (2024–2025)
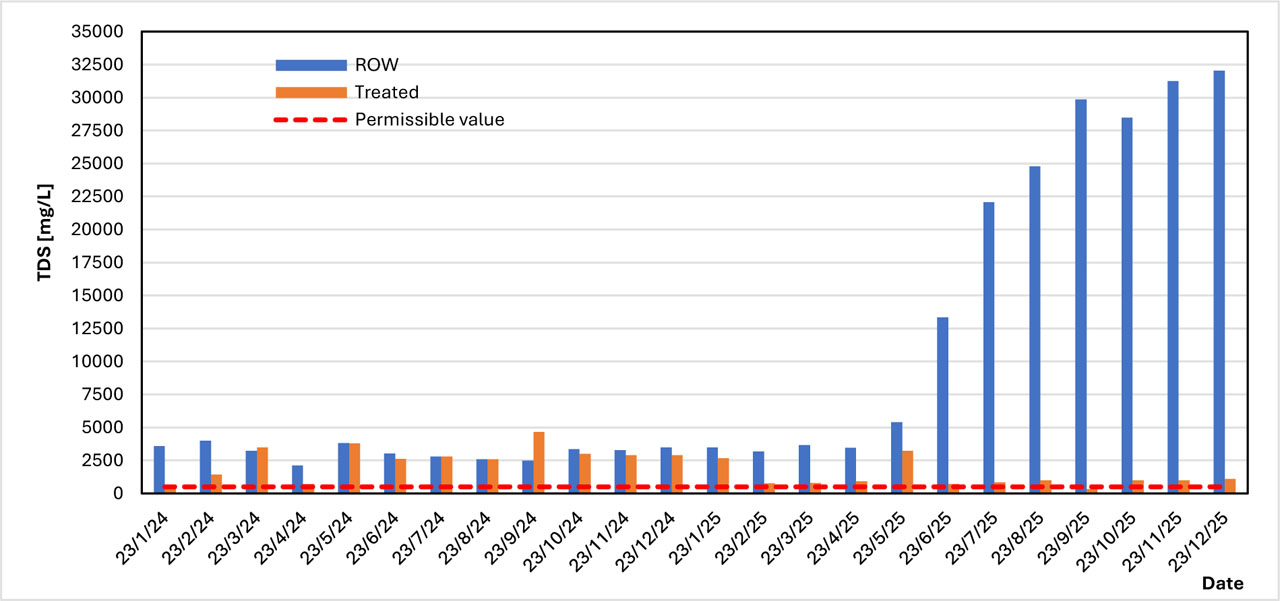
Figure 6:
Monthly variation of (TDS) in raw and treated water compared with WHO drinking water limits at Al-Baradiyah water project (2024–2025)
3.2.4. Alkalinity (Alk)
The data in Figure 7 show that the alkalinity of the raw water was relatively stable during the period 2024–2025, which indicates that the natural buffering capacity of the water source was maintained during this period. After the treatment process, a significant decrease in this parameter was observed. This decrease is not unexpected, since aluminium coagulants consume part of the bicarbonate of water during the coagulation and flocculation stages (Krupińska, 2020; NHMRC, 2025). From an operational point of view, this is important; alkalinity plays a direct role in maintaining the pH and controlling its changes both during treatment and during the water transport through the distribution network (WHO, 2007). However, the water leaving the treatment plant did not reach critical thresholds. In most of the months monitored, alkalinity was in the middle range, which means that the buffer capacity of the system was sufficiently maintained and supported optimal performance. Overall, the findings suggest that the treatment process modified alkalinity to a limited extent while maintaining chemically stable water suitable for distribution (WHO, 2007; Health Canada, 2009).
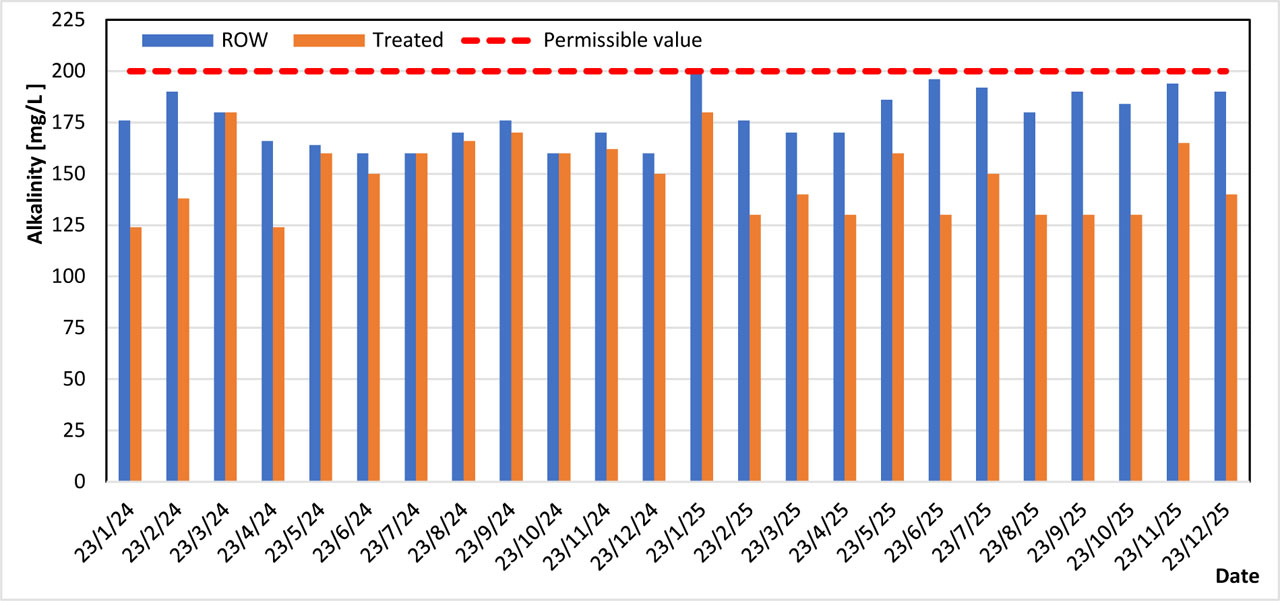
Figure 7:
Monthly variation of (Alkalinity) in raw and treated water compared with WHO drinking water limits at Al-Baradiyah water project (2024–2025)
3.2.5. Total Hardness (TH)
Figure 8 indicates that total hardness in both raw and treated water was often higher than the WHO guideline value during the monitoring period, and significant increases were detected in late 2025 (WHO, 2017). This trend indicates the mineral and salty composition of the source water that is subject to increasing salinity pressure in the Shatt Al-Arab system (Al-Asadi et al., 2023). The fact that the decrease is limited even after treatment is another indication that the traditional treatment processes have limited capability of eliminating the dissolved hardness.
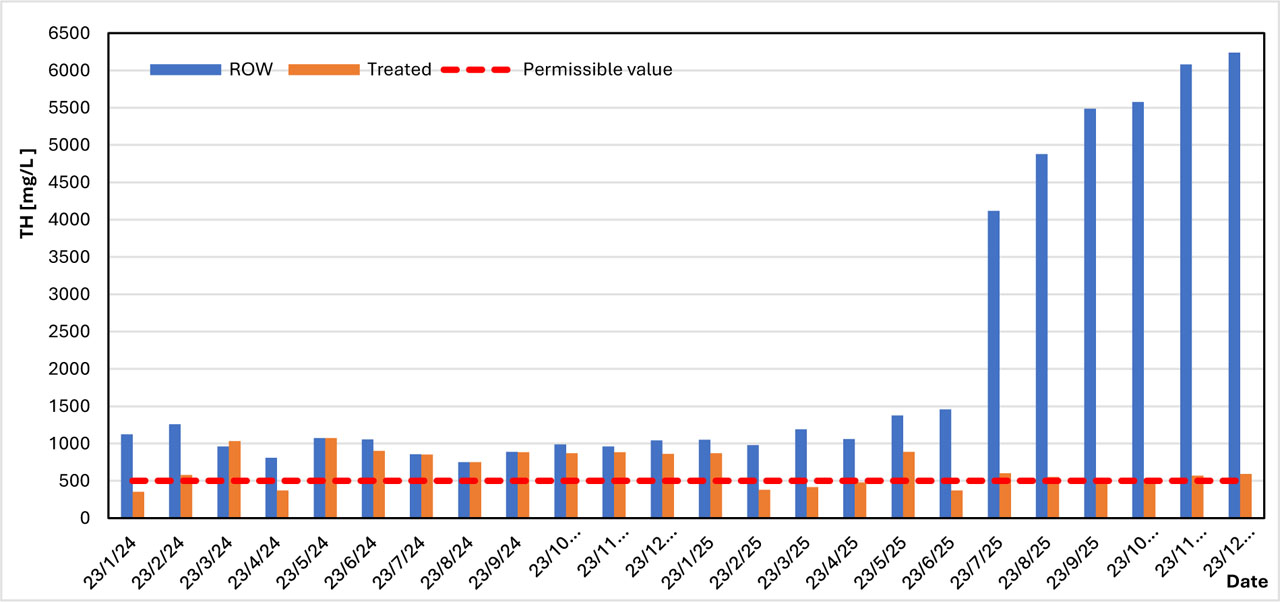
Figure 8:
Monthly variation in Total Hardness (TH) of raw and treated water compared with the WHO guideline limit at Al-Baradiyah water treatment plant (2024–2025)
3.2.6. Calcium and Magnesium
Figures 9 and 10 indicate that calcium and magnesium concentrations in raw water increased markedly during the monitoring period, reflecting progressive hydrochemical deterioration in the source water. Calcium showed particularly high values during mid-to-late 2024, whereas magnesium increased sharply in late 2025. As we already know, calcium and magnesium are among the most important elements that cause water hardness, and this information has been confirmed by the results obtained, as both ions show a pattern consistent with increased water salinity in the Shatt al-Arab system. (Al-Asadi et al., 2023). Treatment reduced both parameters to some extent, but the results were not always consistent. Magnesium was better; in most months its levels were within the WHO standard. Calcium, however, was a different story. Sometimes its concentration remained at or above the WHO guidelines even after treatment (WHO, 2017). This difference in the behaviour of the two parameters is noteworthy. Calcium appears to be more resistant to leaching than magnesium at the treatment plant outlet and is more difficult to remove. In the larger picture, the persistently high levels of both ions are part of the same hydrochemical degradation process that, under the influence of salinity, has been straining the performance of the Al-Baradei water treatment plant (Al-Asadi et al., 2023).
A comparison with the Iraqi National Standard (IQS 417; ICOSQC, 2009) showed that WHO-based evaluation was less adequate than using both standards in order to evaluate water quality. Similarly, the mean calcium concentration in treated water (132.9 mg/L) was more than 75 mg/L IQS 417 acceptable limit of ca but it is within WHO guideline value 200 mg/L and also mean magnesium concentration (81 mg) in treated water exceeded IQS 50 mg/L for Mg while it is under WH limit (150 mg/ L). This emphasizes the importance of simultaneously assessing treatment performance on both frameworks.
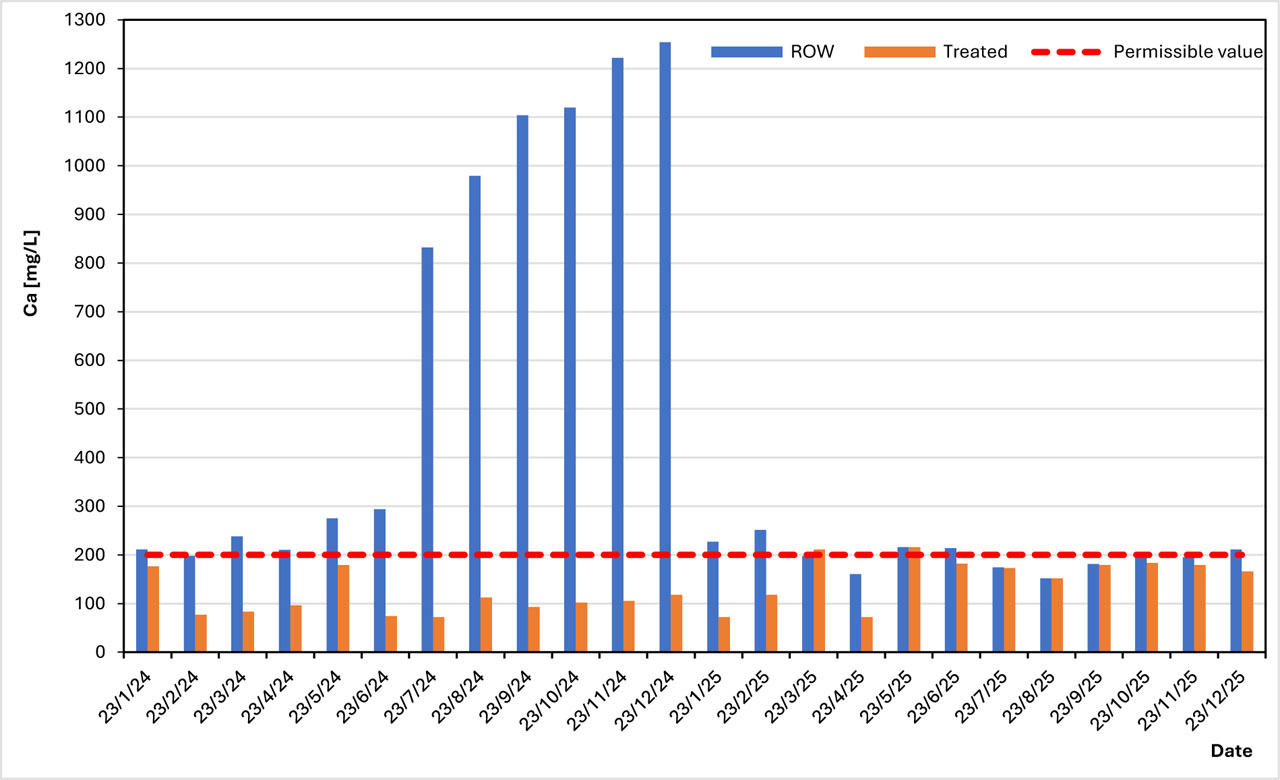
Figure 9:
Monthly variation in calcium concentration in raw and treated water at Al-Baradiyah water treatment plant (2024–2025)
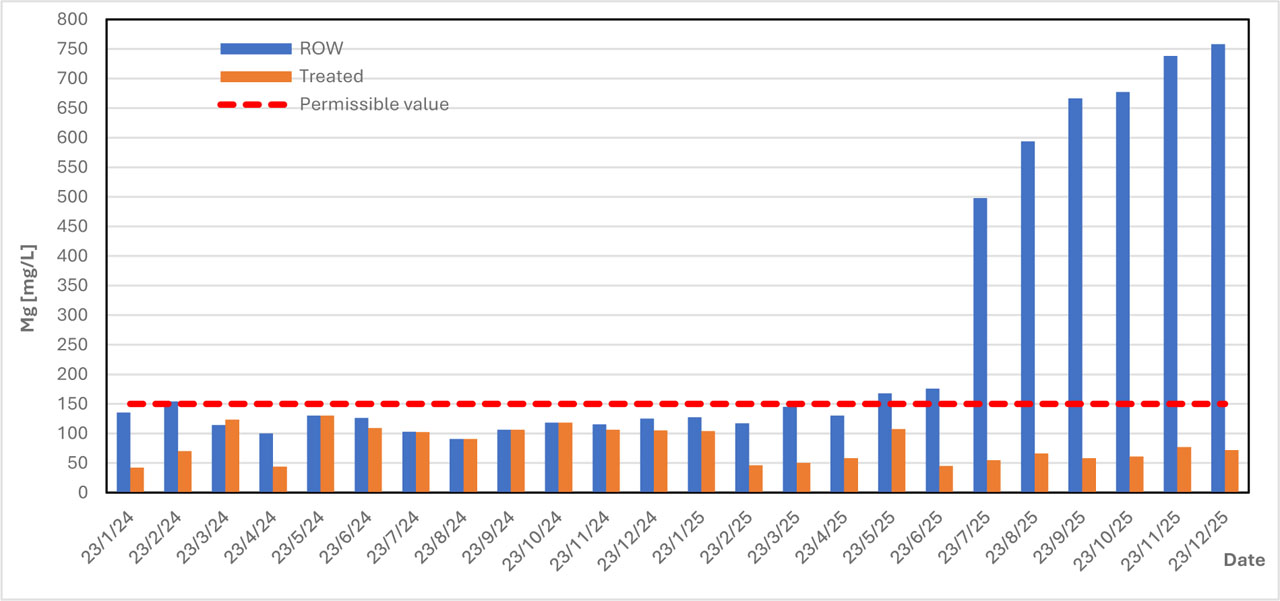
Figure 10:
Monthly variation in magnesium concentration in raw and treated water at Al-Baradiyah Water Treatment Plant (2024–2025)
3.2.7. Chloride and Sulphate
Chloride and sulphate concentrations in the raw water using data for 2024–2025 monitoring period, showed that at all measurement points they exceeded the WHO limit of 250 mg/L – and even more significantly in the second half of calendar year 2025 (Figures 11, 12). This trend is consistent with what occurs when saltwater intrusion into the Shatt al-Arab system occurs due to reduced freshwater flow from upstream (Abdullah et al., 2016). The treatment process was able to reduce these parameters to some extent, but this reduction was not sufficient. The treated water exceeded the standard limits in several cases, clearly indicating that conventional treatment processes cannot remove highly soluble ions (WHO, 2017).. In fact, chloride and sulphate are not the only contaminants in high concentration in the present study. These two parameters are more reflective of a more fundamental challenge: the structural salinity present in the ElBaradei water treatment plant. Given the observed pattern, it is a serious question whether the plant can withstand periods of maximum salinity (Abdullah et al., 2016).
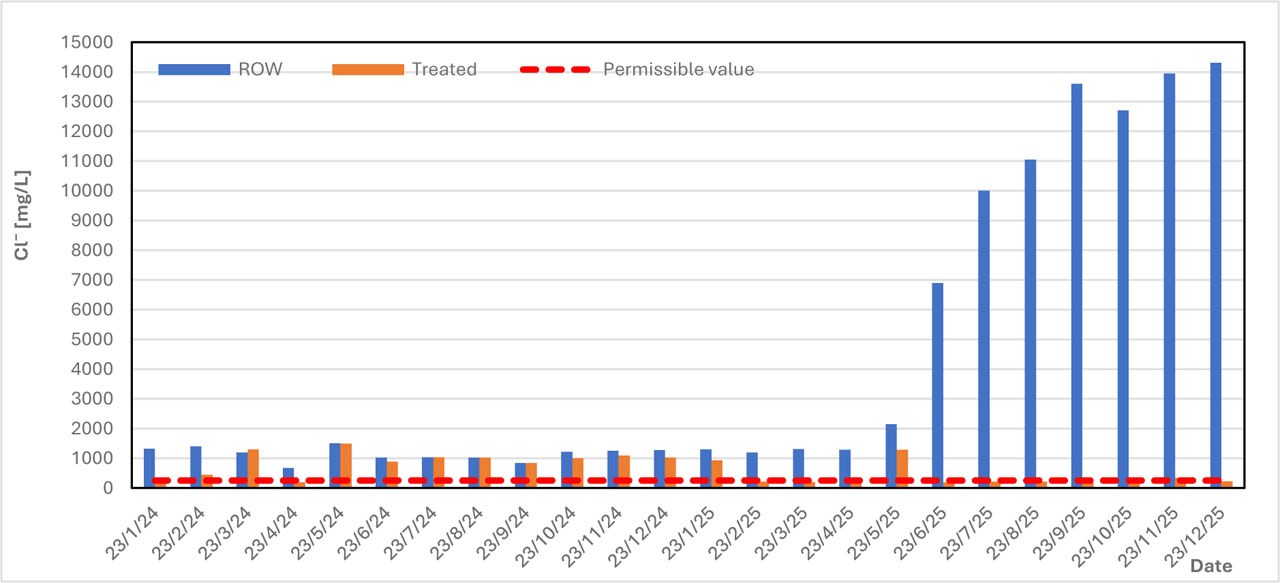
Figure 11:
Monthly variation in chloride concentration of raw and treated water compared with the WHO guideline value at Al-Baradiyah water treatment plant (2024–2025)
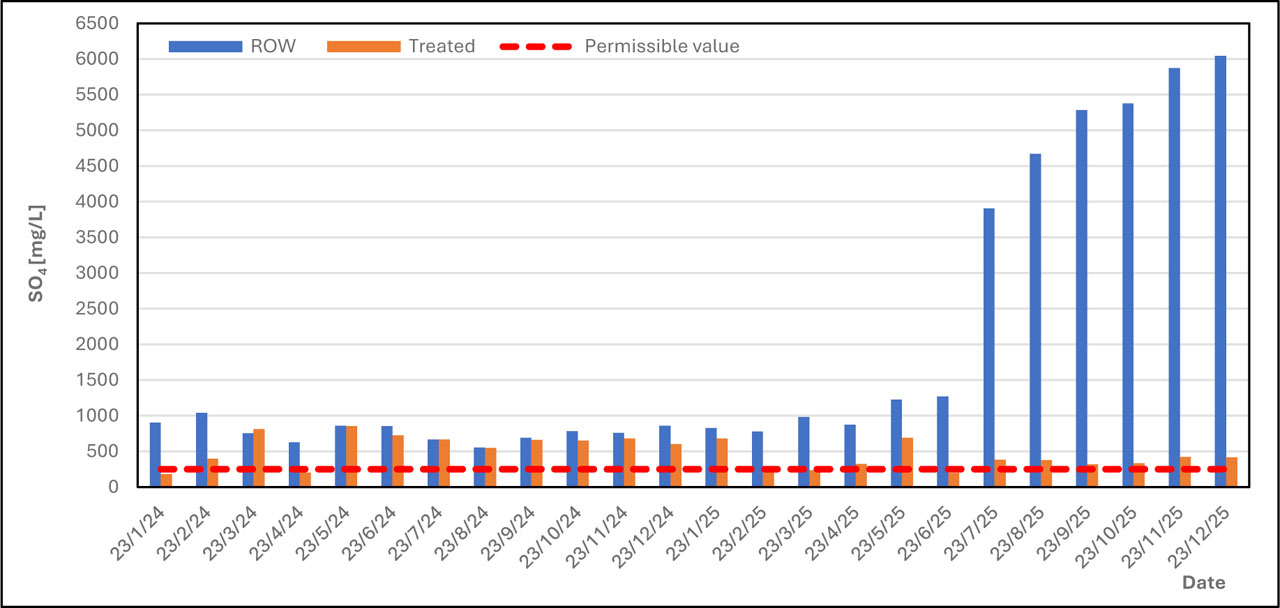
Figure 12:
Monthly variation in sulphate concentration of raw and treated water compared with the WHO guideline value at Al-Baradiyah Water Treatment Plant (2024–2025)
When evaluated against the Iraqi National Standard (IQS 417; ICOSQC, 2009), the exceedances are even more pronounced. The IQS 417 acceptable limit for chloride is 200 mg/L – lower than the WHO guideline of 250 mg/L – yet mean treated water chloride concentration (620.5 mg/L) exceeded this national threshold by more than three times. Similarly, the IQS 417 acceptable limit for sulphate is 200 mg/L, compared to the WHO guideline of 250 mg/L, and mean treated water sulphate (481.8 mg/L) exceeded the national limit by approximately 2.4 times. These results confirm that treated water at the Al-Baradiyah plant fails to comply with the Iraqi national regulatory framework for both chloride and sulphate throughout the monitoring period, not only during peak salinity events. This finding has important public health and legal implications because the plant is required by law to comply with IQS 417 multiple decontamination requirements but not WHO limits.
3.2.8. Potassium (K+)
Figure 13 shows that potassium in raw water ranges from 6 to 18 mg/l. This range does not fluctuate significantly compared to other dissolved ions. There is no significant decrease after the treatment step. Given that the World Health Organization has not set any health guidance limit for potassium in drinking water, these values are simply evaluated in comparison with typical concentrations in surface waters affected by mineral dissolution and salinity intrusion (WHO, 2009). The low efficiency of potassium removal is not surprising. Coagulation-flocculation processes are primarily optimized for the separation of negatively charged colloidal and suspended particles, not for the removal of soluble monovalent cations such as potassium. These ions remain in solution and only in rare cases may be accidentally trapped in the floc matrix (Bratby, 2016). From a hydrochemical perspective, potassium can serve as a secondary indicator for monitoring seawater intrusion in aquatic systems. However, its concentration is still much lower than that of sodium—a difference that reflects the ionic composition of diluted seawater in conditions of reduced upstream freshwater discharge and the tidal influence of the Persian Gulf (Brandimarte et al., 2015).
3.2.9. Total Suspended Solids (TSS)
Figure 14 shows TSS concentrations in raw water were higher than in treated water throughout the monitoring period, which is evidence of the adequate performance of the treatment plant in removing suspended solids through conventional processes. Of course, the removal efficiency was not the same from month to month; these fluctuations show how sensitive the coagulation, sedimentation and filtration processes are to the quality of the incoming water and operating conditions, especially in conditions where salinity intrusion in the Shatt al-Arab River puts additional stress on the system (Bratby, 2016). There is also a methodological point that needs to be explained. TSS was not included in the final calculation of the WQI, because the WHO has not provided any direct health-based guideline value for this parameter in the framework of the indicator used. This does not mean, however, that TSS is considered unimportant. From a scientific point of view, the presence of TSS in the ANN model is quite defensible. This variable is strongly correlated with turbidity and can be seen as a good indicator of the total suspended solids load, thus acting as an operational predictor variable in practice (McKelvey et al., 2024). This view has since been confirmed in more contemporary studies. TSS directly affects the dosage of coagulants that can be used and their ultimate efficient removal from the water during clarifications steps, which makes its use for input in machine learning models reasonable and grounded (Yasin et al., 2018).
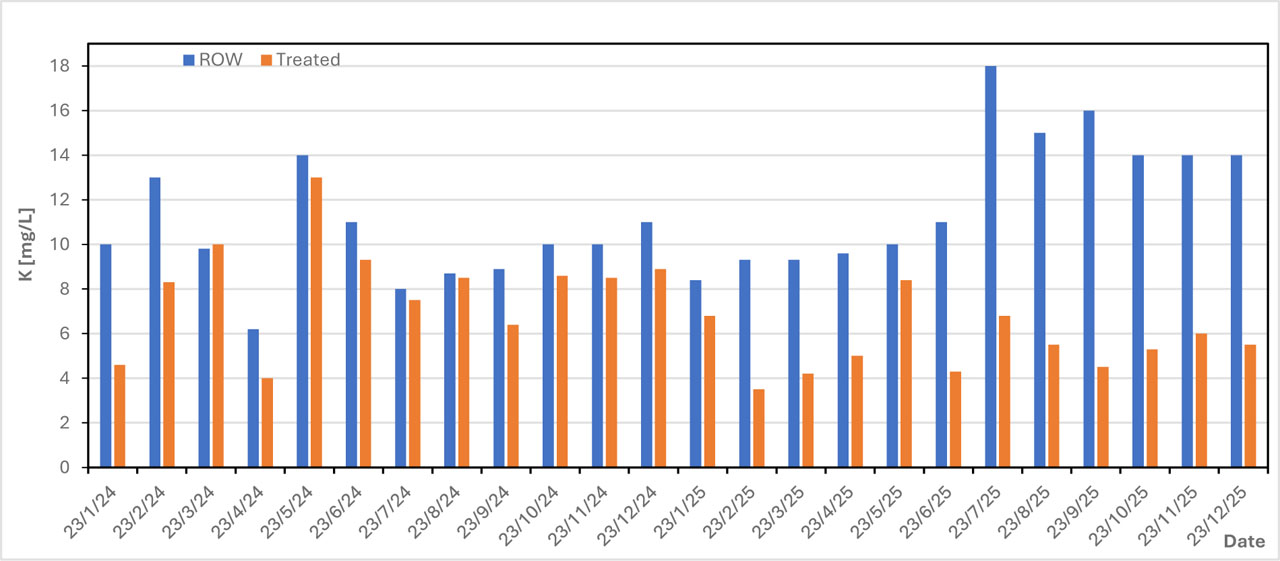
Figure 13:
Monthly variation in potassium concentration of raw and treated water at Al-Baradiyah Water Treatment Plant during 2024–2025
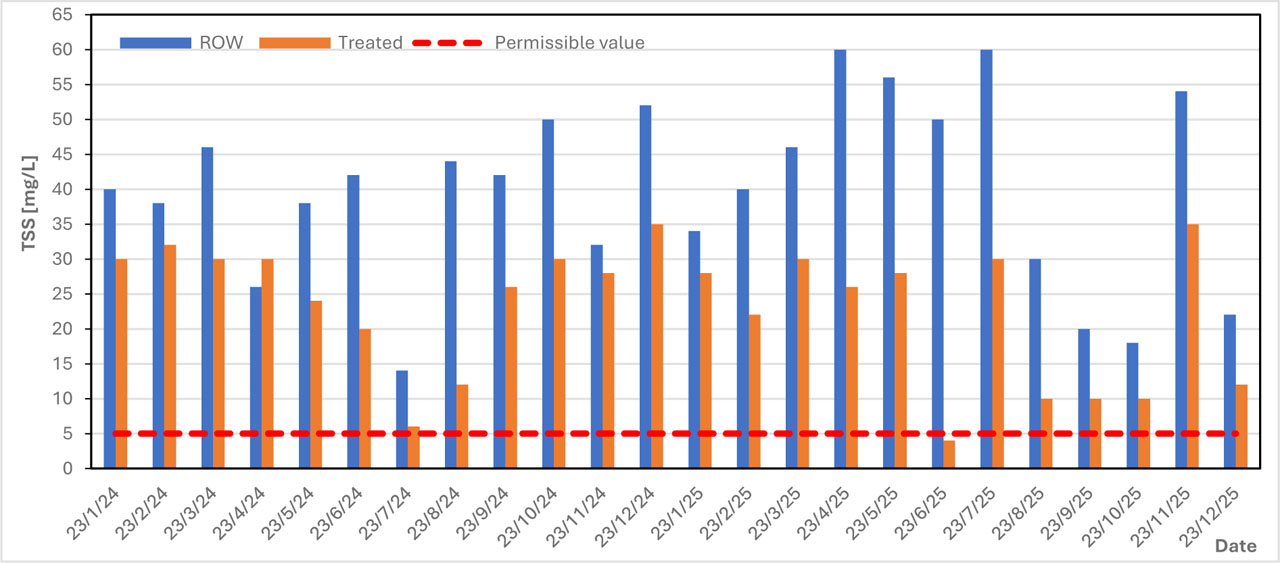
Figure 14:
Monthly variation in Total Suspended Solids concentration of raw and treated water at Al-Baradiyah Water Treatment Plant during 2024–2025
Collectively, the findings of this study confirm that water quality deterioration is mainly associated with salinity-related parameters rather than classical physical properties. While pH and turbidity levels were within acceptable limits, the same could not be said for this group of parameters which included EC, TDS, chloride, sulphate, total hardness, calcium and magnesium. Both in raw and treated water, these parameters continually exceeded the permissible drinking water standards. This pattern leads to a straightforward conclusion: salinity intrusion is an important cause of source water quality degradation and, simultaneously reveals the incapacity of the treatment plant able to face dissolved salt charges. The treatment plant, however, performed much better in the removal of suspended solids. Even during other periods with greater fluctuations in operating conditions, effluent TSS concentrations were low and remained considerably less than those reported on previous occasions. In short, the conversion of physical parameters has proven much more successful than ionic contaminants in traditional technologies, while solution salinity is still a crucial limiting factor when it comes to achieving the desired quality of treated water. It should be said about TSS that while it is removed from the WQI formal calculation, but on the contrary, we kept TSS as one input variable for our ANN model. The reason for this choice is evident – TSS, as a major water quality identifier, has an important role in forecasting treatment efficiency and the response of the system to variation in water composition.
3.3. Removal Efficiency
The pollutant removal efficiency provided a considerable temporal variation during the monitoring period, representing that performance of treatment plant was neither uniform nor reliable stable. The above mentioned values, in conjunction with the average removal efficiency of 49.75% TDS was highest and followed by SO42− 49.34%, Cl⁻ was about 47.09%, Ca2+ was around 46.48% turbidity reached to (45.48%) also T.H reached to (41.77%), maximum removal percentage for TSS(41.27) and Mg2+(40.40) were obtained [3], thus these numbers together indicating that the treatment system provided moderate performance of reduction across most indicators But analysis of month-to-month fluctuations, and the presence of negative removal efficiency numbers at high salinity periods, tells a much more complicated story when it comes to how these units operated. Abnormalities occurred in the characteristics of TDS, Cl−, SO42−, TH, Ca2+, Mg2+, TSS and turbidity; some of the concentrations of indicators obtained in the effluent from this treatment plant are higher than in raw water inlet. Such conditions reveal serious shortcomings of conventional treatment processes in the face of water sources whose salinity varies greatly. The significant gap between the maximum and minimum values is itself evidence of the instability of the operation. The TDS removal efficiency reached 98.94% in the most favourable situation but fell to −88.10% in the most unfavourable situation. The range of Cl− extended from 98.54% to negative values, SO42− experienced a maximum of 94.00% and TSS also showed a drop to −15.38%. Overall, the findings confirm the fact that the treatment plant could reduce both dissolved and suspended solids during certain periods, but its performance remained moderate and highly variable. According to Figure 15, the significant fluctuations between minimum and maximum efficiency clearly demonstrate the unstable nature of this treatment plant in the face of changes in raw water quality – especially under the influence of salinity intrusion.
In Figure 15, the removal efficiency was assessed only for those parameters for which a significant reduction in concentration could be measured after treatment. For this reason, the three parameters pH, alkalinity, and potassium were excluded from this analysis. pH is essentially an operational parameter and does not have a specific health guideline standard (WHO, 2022); potassium is in a similar situation and does not have a health guideline limit under typical conditions of treated water (WHO, 2009). Alkalinity is a different matter. Unlike the other parameters, this indicator is more indicative of the buffering capacity of the water and the hadrochemical stability of the system, rather than a direct target for the removal process (U.S. EPA, 1976/2006). The simultaneous removal of these three parameters has enabled the formation of a more integrated methodological framework for the analysis. On the other hand, the resulting graphical pattern clearly indicates that the performance of the treatment process in the field of removal of suspended solids was much more favourable than the control of dissolved components related to salinity. Among all the parameters examined, TDS also showed the highest degree of variability and instability.
3.4. Correlation Matrix of Salinity Indicators
In this study, the Pearson correlation matrix was able to provide a relatively clear picture of the water quality trends in the El Baradiyah treatment plant during the period 2024–2025. What is most striking is the very close relationship between EC, TDS, chloride (Cl⁻) and sulphate (SO42−); the correlation coefficients between these parameters were in the range of 0.98 to 1.00, which in practice indicates their aligned and almost integrated behaviour. Correlations close to unity clearly demonstrate that these parameters do not change independently of each other but rather act as a single hadrochemical regime (Al-Asadi et al., 2023). The near-perfect correlation between EC and TDS, with r ≈ 1.00, can be estimated as the true value, which is more precisely determined. In this regard, the strong correlations of Cl− and SO42− with both EC and TDS indices suggest that these two are the determining factors in shaping the salinity profile of the source water (Abdullah et al., 2016; Salman & Jazaa, 2023). Hydrologically, this pattern fully agrees with Shatt al-Arab River. Great. In conclusion, findings presented within this section lend strong statistical support to the interpretation that salinity has acted as an important control on raw water chemistry. Accordingly, EC, TDS, Cl− and SO42− is widely accepted as legitimate and suitable indicators for salinity assessment purposes in the study area (Salman & Jazaa 2023). The strong positive correlations at 0-pen testing time of EC, TDS, Cl− and SO4 are evident from Figure 16 which indicates these parameters changed almost instantly and in tune with salinity intrusion conditions.
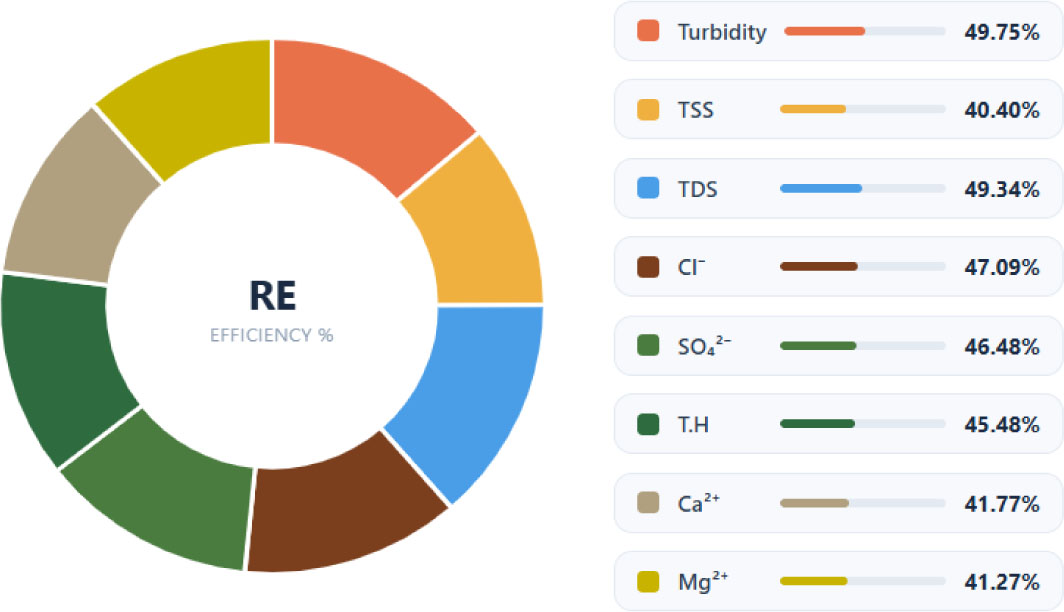
Figure 15:
Mean removal efficiency (%) with minimum–maximum variation for selected water quality parameters at Al-Baradiyah Water Project
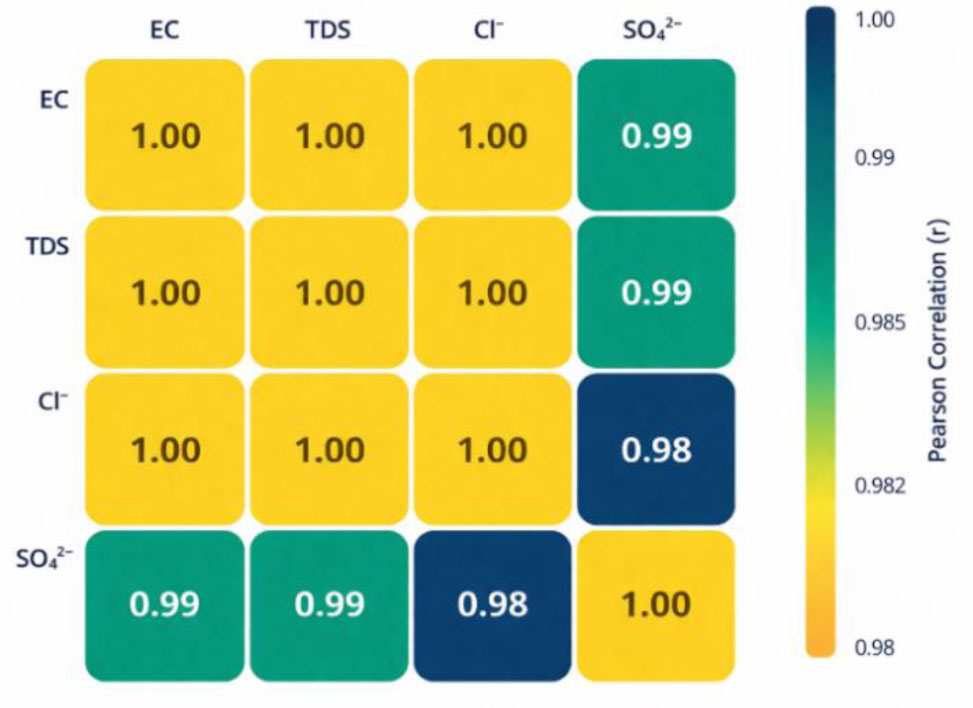
Figure 16:
Correlation matrix of the major salinity indicators in raw water at Al-Baradiyah water project during the 2024–2025 monitoring period
3.4.1. Spatial Dynamics and External Drivers of Salinity
Table 6 and Figure 17 provide a reasonably straightforward story: salinity parameters increase consistently throughout the course of the Shatt al-Arab as we go downstream. At station SH4 in the Faw, total dissolved solids were >492% higher than at station SH1 marking a significant change. This is a significant number. The pattern of this gradient suggests that the Baradiyah water-source problem is not site-specific or due to malfunctioning equipment, but rather in hydrological and salinization processes spanning entire river reach. This situation is backed by the evidence at the basin level. Montazeri et al. (2023) also report an increase in salinity stress throughout the lower Tigris-Euphrates system and Shatt al-Arab, and Al-Asadi et al. (2023) demonstrated the active intrusion of seawater into the land, as well as pronounced longitudinal gradients in dissolved ionic concentrations within the river itself.
This result is not so surprising from an operational point of view Conventional treatment systems were not designed to treat dissolved ionic loads at their core, they are for the removal of suspended solids and turbidity which renders them structurally incapable of handling the kind of salt ingress experienced in the Shatt al-Arab (Qassem et al., 2000; World Health Organization, 2017). In a way, comparing performance for removing dissolved salts is like putting them to a test they were never designed to pass. What the spatial analysis in this section reveals is precisely the broader frame of reference mentioned earlier. Rather than examining the constraints of the treatment plant in isolation, the cross-sectional data from SH1 to SH4 place these constraints in the context of a hadrochemical change at the river scale a change that no conventional treatment system, no matter how optimized, can truly overcome (Salman & Jazaa, 2023).
Table 5:
Spatial variation of major salinity-related parameters along the Shatt Al-Arab River, with percentage change relative to the upstream reference station (SH1), 2024
| Impacted river reaches | Chlorides [mg/L] | Sulphates [mg/L] | Total hardness [mg/L] | Total dissolved solids [mg/L] | Increase/decrease in TDS concentration |
|---|---|---|---|---|---|
| SH1: Karma Ali River Monitoring Station, Shatt Al-Arab River | 1036.17 | 427.5 | 968.18 | 2750.83 | An advanced zone affecting the waters of the Shatt Al-Arab |
| SH2: Al-Maqal area | 1069.25 | 441.67 | 952.25 | 2771 | Increase by 0.73% compared with SH1 |
| 3.19% | 3.31% | −1.65% | 0.73% | ||
| SH3: Al-Subiya area near the Saihan Water Project | 1119.5 | 450 | 890.5 | 2797 | Increase by 0.94% compared with SH2 |
| 8.04% | 5.27% | −8.02% | 1.68% | ||
| SH4: Al-Faw area / Boat Marina | 6,370 | 1,750 | 4,995 | 16,566 | Increase by 492.28% compared with SH3 |
| 514.76% | 309.36% | 415.92% | 502.22% |
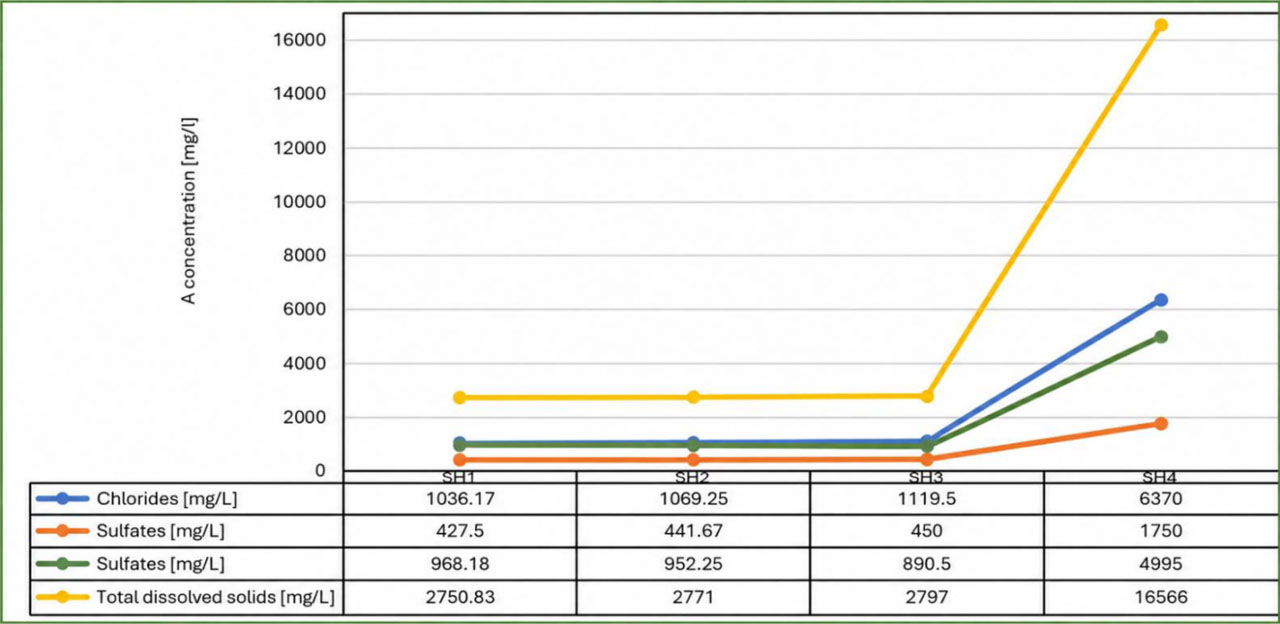
Figure 17:
Percentage increase of major salinity-related parameters along monitoring points (SH1–SH4) in the Shatt Al-Arab River
Between stations SH1 and SH3, the concentrations of the parameters do not change much, and the trend is relatively uniform. However, from SH4 onwards, the situation is completely different. a sharp and disproportionate increase in the recorded values is observed, reaching 16,566 mg/L for total dissolved solids. This sudden jump most likely reflects the intrusion of seawater through tidal currents, which have a dominant influence in the lower reaches of the Shatt Al-Arab.
3.4.2. Spatial Mapping of Salinity-Related Parameters Along the Shatt Al-Arab River
GIS maps were generated based on salinity monitoring data from 2024 at four stations (SH1-SH4) along the Shatt al-Arab River. The aim of these maps was to show spatial variations in chloride, sulphate, total hardness, and TDS along the river course. In fact, this geographic visualization helped to provide a more accurate interpretation of the water quality decline trend. In this way, the relationship between the decline in raw water quality at the El-Baradiyah treatment plant and water-environmental stress at a regional scale was better understood.
The four spatial maps generated represented in Figure 18 display a relatively uniform longitudinal trend from SH1 to SH3, where sulphate, total hardness, TDS and chloride are within the range of moderate and almost homogeneity concentrations. Now comes the interesting part – at station SH4 it is a totally different picture. Note that now, traveling downstream of the river, all parameters shoot up to their maximum detectable concentration level – and even more remarkably so. Overall, maximum general TDS was 16,566 mg/l and the maximum open chloride was 6.370 mg/l – knowledge that clearly still verify groundwater salinity enhancing alongside Shatt al-Arab River versus poor-fortunate Faw. Therefore, if we were looking for spatial pattern-based conclusions that would be relevant across these 8 maps, one could probably state that the degradation of raw water quality here is not an isolated local affair, but a systematic process associated with salinization from lower reaches.
3.5. Environmental and Operational Implications
The implications of the research from both an environmental and a tactical issue illustrate more than just a technical vulnerability in Remedy cycle. The increasing salinity in the case of Basra is merely a manifestation of a broader hydrological disaster caused by three overlapping factors: simultaneity, upstream freshwater diversion and depletion due to climate change. None of this pressure occurs in a vacuum. They instead form part of a more regional development indicated by the hadrochemical turnover sampled for the lower Tigris-Euphrates basin. The interaction between higher temperatures, declining precipitation and the trans-border river management has been gradually increasing salinization loads on surface water resources in this basin (Al-Malaki et al., 2025; Montazeri et al., 2023). On this background, the ElBaradei Water Treatment Plant has two challenges as of course 1) continue to treat incoming load with traditional treatment techniques 2) challenged by a changing environmental baseline that already exceeds outdated infrastructure. As such, it has shown that existing solutions to treatment are not working very well against salinity stress. Inclusion and management for climate resilience is not a choice multiply a necessity. In this context, three pillars would need to be laid: i) proactiveness in protecting water resources (Appendix I); ii) constant management of salinity risk advancement; and iii) application of cutting-edge membrane desalination technologies which are able to remove dissolved ionic compounds (the very target, also posing a core ‘soft spot’ for standard ways as reported by Honarparvar et al. (2021); Aswad et al. (2025).
3.6. Artificial Neural Network (ANN) Analysis
3.6.1. ANN Model Structure
Addressing salinity issues in regions like Iraq necessitates the development of inexpensive and efficient assessment tools. Recent studies have emphasized the transition toward innovative electronic systems and modelling techniques to provide qualified assessments of saline environments (Al-Shueli et al., 2022). In line with this trend, the present study employs advanced modelling to predict water quality parameters. To better understand the internal structure of the model, the architectural diagram of the artificial neural network used for turbidity prediction is presented in Figure 19. In this model, five input variables including TSS, SO4, TH, EC and TDS were connected to a neuron in the hidden layer, and the final output was the predicted turbidity (Tur). Therefore, the overall architecture of the network was formed as 5-1-1. Neuframe software recognized this configuration as the best possible structure for this problem.
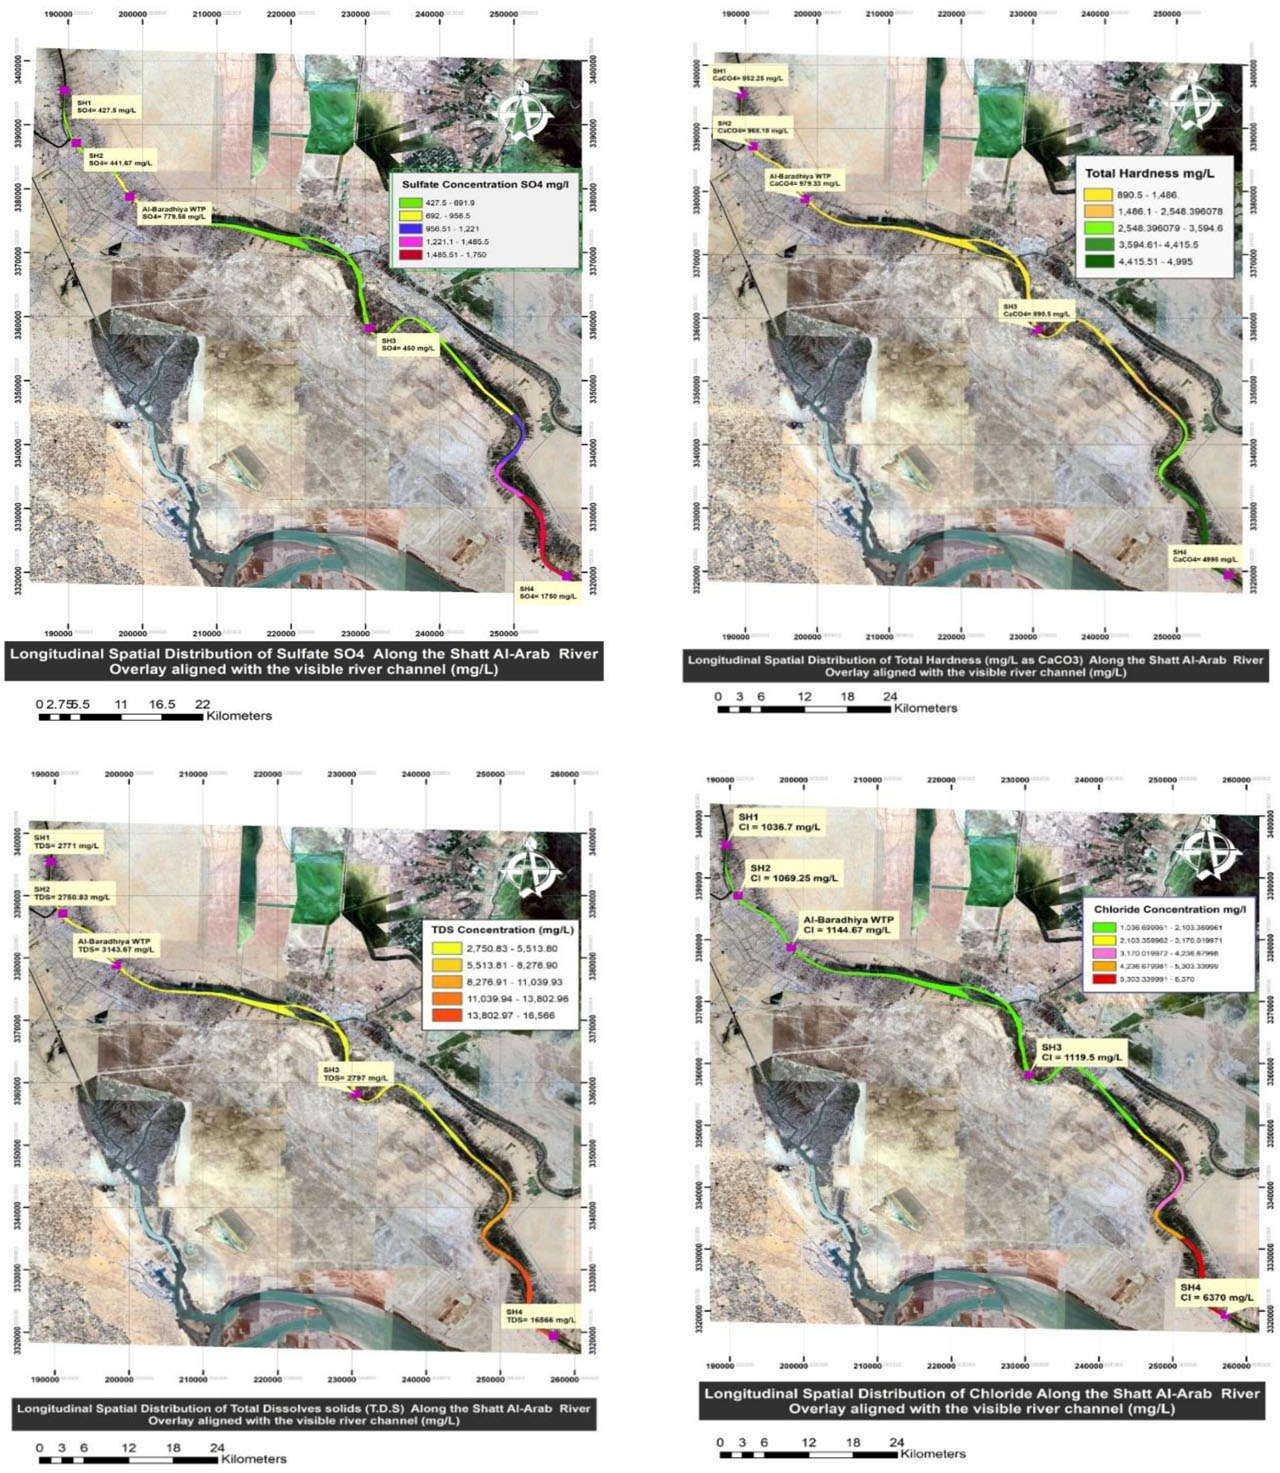
Figure 18:
Longitudinal spatial distribution of major salinity-related parameters along the Shatt Al-Arab River at selected monitoring points in Basra, Iraq (2024): chloride, sulphate, total hardness, and total dissolved solids
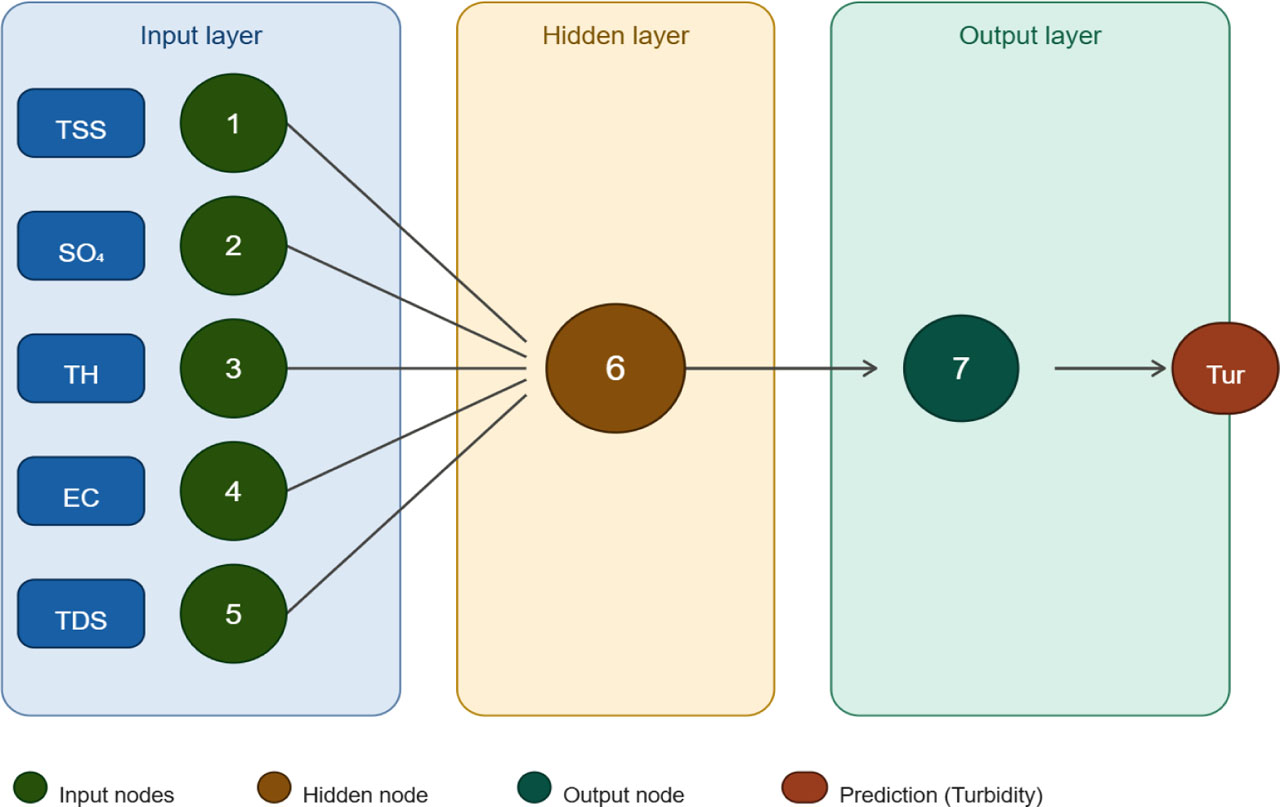
Figure 19:
Architecture of the developed artificial neural network (ANN) model used for turbidity prediction
Recall what the 5-1-1 architecture says here: five input parameters, one hidden neuron, and one output. It sounds simple, but it is this simplicity that prevents overfitting. In fact, the predictive information contained in the input variables is enough for a hidden neuron to capture nonlinear relationships with turbidity well. In this structure, each input has its own weight, obtained from the training stage, indicating the relative contribution of that variable to the final output. The hidden neuron also applies an activation function to the received signal and sends the transformed output to the output neuron. The mathematical equation derived from this architecture is given later in this section.
3.6.2. ANN Model Validation
To measure how reliable the ANN model is in practice, we compared the predicted turbidity values with the actual data from the validation set. In fact, the main criterion for judging a model is not its performance on the training data, but its behaviour when dealing with data it has not seen before. Therefore, this comparison provides a practical basis for assessing the robustness of the model – especially as it is intended to be used as a decision support tool in situations where the chemical composition of the source water changes under the influence of salinity.
Figure 20 shows that the model was able to follow the general trend of turbidity over the validation interval, albeit with the dispersions noted below. The value of R2 = 0.8326 shows an acceptable level of agreement – this number is not uncommon for ANN models in the field of water quality prediction and has been accepted as a sufficient criterion in similar studies (Palani et al., 2008). The dispersion seen in the range of 6–8 NTU is also not unexpected; the limited volume of validation data, together with the natural variability of hadrochemical conditions, somewhat justifies such behaviour.
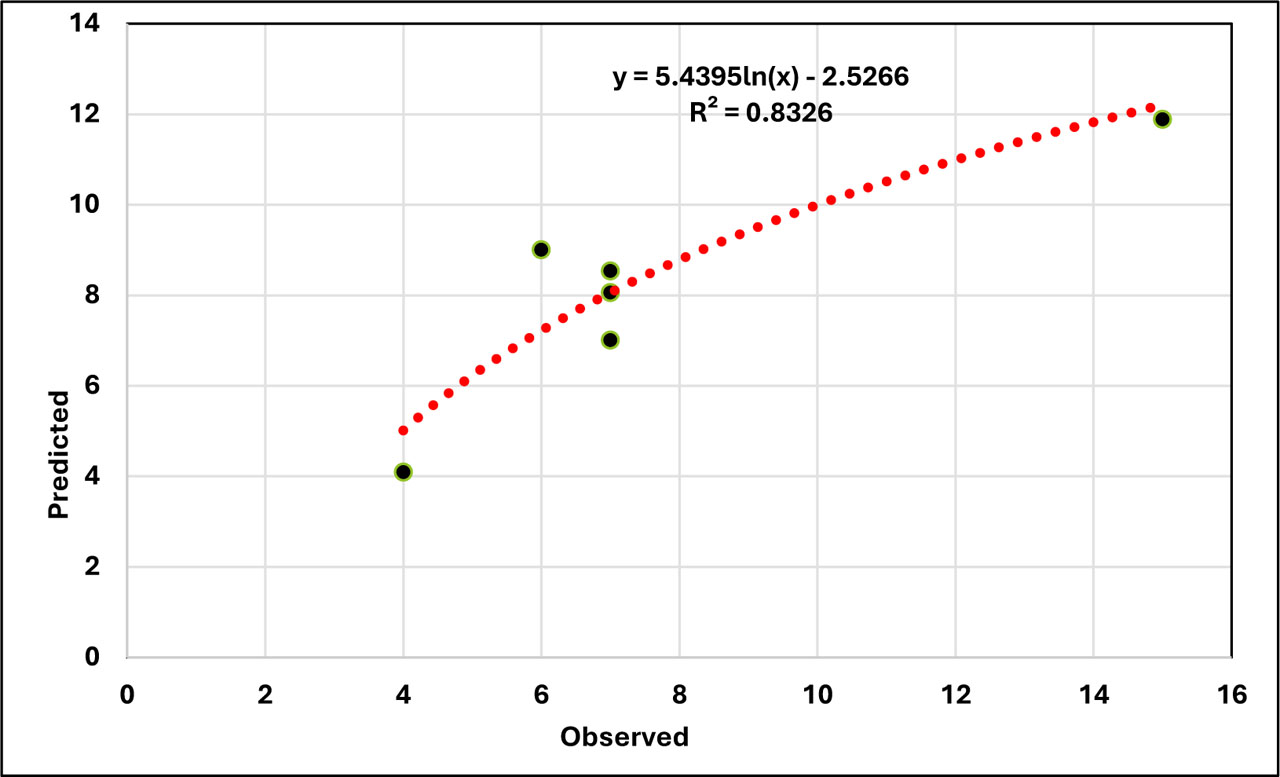
Figure 20:
Comparison between predicted and observed turbidity values for the ANN validation dataset
3.6.3. Sensitivity Analysis of ANN Inputs
A sensitivity analysis was conducted to examine the relative importance of the selected input variables in the ANN model. The results are presented in Figure 20.
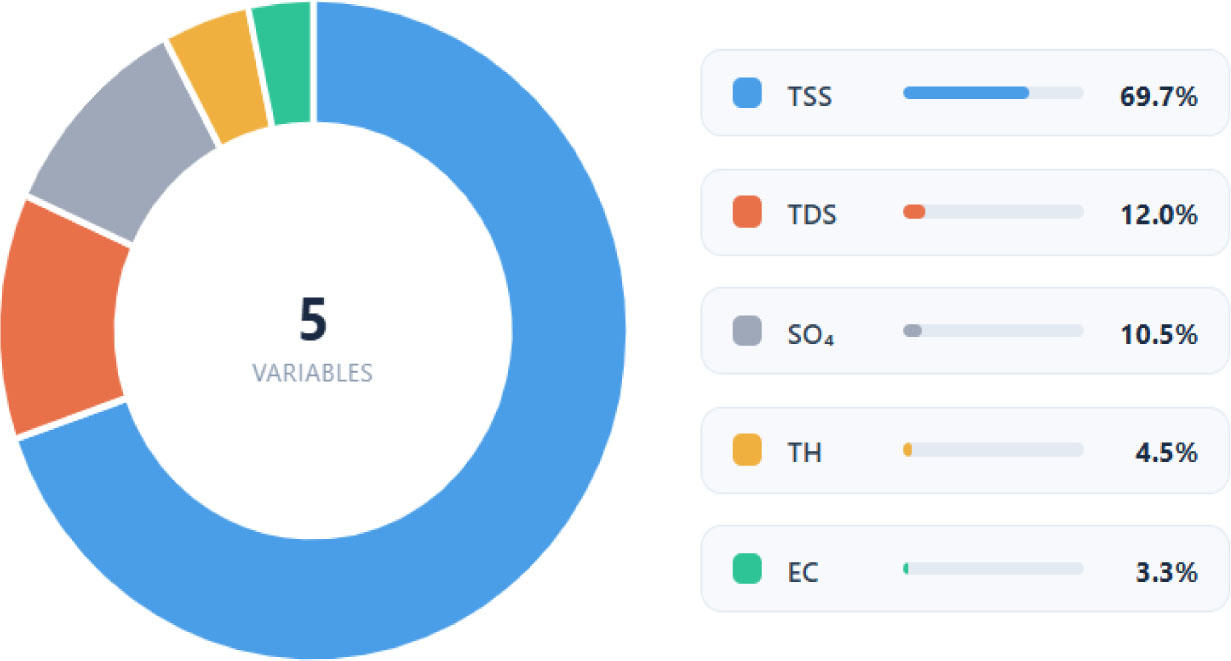
Figure 21:
Relative importance of the selected input variables in ANN-based turbidity prediction
Sensitivity analysis was performed to determine the contribution of each input variable to the prediction of turbidity under the actual conditions of the raw water studied. The results of this analysis, shown in Figure 21, clearly show that TSS was the most dominant variable, accounting for 69.7% of the total relative importance; this figure clearly demonstrates the decisive role of this parameter in the model output. TDS was next with 12.0% and SO4 with 10.5%. At the other end of the spectrum, TH with 4.5% and EC with 3.3% showed a more limited impact. This is no surprise of a distribution. In a system where turbidity is mainly controlled by a suspended particulate load, it would be logical that TSS would have the greatest predictive importance. Of interest, though, is that the variables associated with salinity, namely, TDS, SO 4, and to a lesser degree EC, only slightly over a quarter of the model sensitivity is attributed to them, which indicates that dissolved ionic conditions are not fully decoupled to turbidity behaviour, even using the variable-source-water conditions of the Shatt Al-Arab.
This also explains why TSS was retained as a model input despite its exclusion from the formal WQI calculation. Its contribution to predicting treatment-related water-quality behaviour is substantial and omitting it would have left a significant gap in the model’s ability to capture what is actually happening at the plant level (Garson, 1991).
3.6.4. Derived ANN Model Equation
The relatively small number of connection weights obtained from the Neuframe software for the optimal ANN model made it possible to express the network in the form of a relatively simple mathematical relationship. Using the connection weights and threshold levels generated by the software, the intermediate hidden-layer expression was first derived as follows:
The relatively small number of connection weights obtained from the Neuframe software for the optimal ANN model made it possible to express the network in the form of a relatively simple mathematical relationship. Using the connection weights and threshold levels generated by the software, the intermediate hidden-layer expression was first derived as follows:
Where:
Tur – the predicted turbidity,
x – the intermediate hidden-layer function derived from the weighted combination of the selected input variables.
This expression was derived from the connection weights and threshold values generated by the Neuframe software during the network training process, and its purpose was to provide a mathematical representation of the internal structure of the model (Garson, 1991). It should be noted, however, that this equation is closely related to the specific architecture of the neural network as well as the dataset on which the Basra support model is developed. Hence, the generalizability of results only applies for the established segments and under conditions that are represented within the data in the model development phase. In other words, this relationship cannot be treated as a general physical law explaining the behaviour of turbidity in every water treatment system (Palani et al., 2008).
3.7. Complementary Interpretation of WQI and ANN Results
It was also indicated that this method can be a successful alternative to traditional approaches, especially in situations where it is essential to reveal complex nonlinear correlations between water quality parameters (Palani et al., 2008). As anticipated, the WQI index provides a complete assessment of the processed water quality considering international parameters. However, the ANN model was even more progressive. Under environmental stress condition, it could analyse turbidity behaviour with more detail and accuracy (Kouadri et al., 2021). With regards to performance, the model validation process resulted in quite acceptable output: correlation coefficient of R = 0.9125 and a determination coefficient R2= 0.8326 (83.26%) giving an acceptably accurate reconstruction of turbidity patterns (Aswad et al., 2025). The sensitivity analysis yielded significant results; TSS proved to be the most important predictor for turbidity, followed by TDS and SO4 (Garson, 1991). In short, the conclusion drawn from this study is that it is a complement and not a substitute. The ANN model was specifically designed for turbidity prediction and did not aim to usurp or replace the entire WQI framework.
4. Discussion
The WQI, in the current study was calculated to be 90.83 at one time which came under “good” quality water (71–90) during a time of year when especially salinity driven parameters were largely exceeded mainly TDS, EC: chloride and sulphate (Abdullah et al., 2016). By contrast, a parameter-by-parameter analysis indicates that much of this composite picture is an oversimplification: while the overall subtractive score was within acceptability limits, individual parameters repeatedly exceeded WHO guideline values, and such simple aggregation has been shown to cover-up deleterious hadrochemical changes. This finding is in line with that reported by Gupta and Gupta (2021) and Chidiac et al. (2023). Both these studies have reported that the mathematical aggregation process in composite indices can obscure major hadrochemical stresses. At the same time, the current results also lend support for Fortes et al. (2023), WQI is in fact an approach for preliminary screening but does not eliminate the necessity for detailed monitoring of individual parameters. Also, a methodological note needs to be mentioned: the WQI and ANN methods are complementary in this study, not integrated. The ANN models for turbidity prediction were also not participating to form the final WQI structure. However, the ANN primarily serves as a decision-support tool that helps evaluate process performance more effectively. This contradiction is further emphasized by considering the removal efficiency (RE) of these compounds. On the other hand, the turbidity and TSS removal of Al-Bardiya treatment plant had a relatively constant - and an acceptable performance - which is considered as technical efficiency indicator of conventional coagulation + sedimentation processes (Bratby, 2016; Łukasiewicz, 2025). However, during higher salinity intrusion periods RE values of TDS, EC and chloride that fluctuated around zero and even entered the negative range. Practically speaking, this means that during salinity stress, the treatment plant did not successfully manage the dissolved ionic load. The origin of this limitation must be found in tidal effects and the decrease in upstream freshwater flow, which lead to an increasing ionic concentration of incoming raw water (Brandimarte et al., 2015; Abdullah et al., 2016; Al-Asadi et al., 2023). Such a challenge for conventional treatment plants in southern Iraq has been previously documented (Al-Chalabi et al., 2020). The methodological strength of this research lies in linking descriptive assessment with predictive support through the complementary use of ANN. The model can capture complex nonlinear relationships (R = 0.9125; R2 = 0.8326), providing a useful decision-support framework and in accordance with the findings reported by Kouadri et al. (2021) and Aswad et al. (2025). Therefore, this integrated WQI–ANN–RE framework is not only purely a technical assessment tool based more on local information but also provides an analytical model that can be replicated for other deltaic and salinity-effected systems. However, one important methodological issue with our ANN component needs to be explicitly addressed. Data was limited to 24 monthly observations in total: ~14 data points (60%) for training and 5 each for testing (20%) and validation (20%). An ANN trained on such a small sample is essentially at risk of overfitting, and an R2 of 0.8326 based on just five data points for validation may be thought of as statistically weak in a classical sense. Such limitation limits the generalisability of the model and determine its usage for only conditions that are represented in the patient’s monitoring period. In other future works assessment should aim at a more detailed temporal resolution of data collection – preferably in daily or weekly intervals – to offer sufficient sample size for meaningful ANN training and validation. In case only monthly data are accessible, this limitation should be qualified as a major factor influencing the predictive modelling component.
However, when the results are found to be consistently high and compared to the Iraqi National Drinking Water Standard (IQS 417; ICOSQC, 2009) as well as WHO guidelines, it paints a far more dire picture. Treated water had chloride and sulphate all above the IQS 417 acceptable limits of 200 mg/L for most of the monitoring period with mean concentrations of 620.5 mg/L and 481.8 mg/L respectively – more than three times and 2.4 times higher than national standards. Calcium and magnesium also exceeded their respective IQS 417 acceptable limits (75 and 50 mg/L), while all the data for these parameters were compliant with WHO guideline values, again demonstrating a major difference between this national standard and WHO guideline values. The value of TDS in treated water was observed 4 times higher than IQS 417 limit for allowable amount of TDS, which is set at 500 mg/L. The indicated results indicate that YES, the Al-Baradiyah Water Treatment Plant does not meet national regulatory framework for safe drinking water in Iraq despite having partial compliance with WHO standards. This distinction is essential, because the scores of treatment plant functioning against international guidelines are a gross overestimation of compliance with actual operational requirements without corresponding national standard comparison (by regulation,[26] and may hide intensive public health risk for consumers in Basra Governorate).
The findings further highlight the need for an integrated environmental planning approach that combines advanced desalination-oriented technologies, continuous salinity-risk monitoring, adaptive source-water management, and long-term protection strategies to address the accelerating hadrochemical degradation of freshwater resources in southern Iraq.
5. Recommendations
Based on the findings of this study, water quality in salinity-affected systems should not be evaluated using WQI alone, but rather through a complementary approach that combines composite indices with parameter-specific analysis, removal-efficiency assessment, and predictive modelling. Continuous monitoring of salinity-related parameters is particularly necessary during periods of intensified saline intrusion. The findings of this study show that conventional treatment alone does not meet the existing challenges. The serious limitations of these systems in removing dissolved ions make the use of advanced desalination technologies an inevitable complement. More broadly, integrated life-cycle cost and environmental assessment can provide a useful decision-support framework for comparing the long-term economic and environmental implications of infrastructure alternatives (Naser et al., 2026). Sustainable drinking water supply in Basra is not realistic at the level of environmental management without an integrated approach; specifically, one that involves combining protection of the water resource, continuous monitoring of salinity risk, adaptive management of consumption and effective coordination among relevant institutions. A preliminary application for this integrated WQI-ANN-RE framework should be used on other treatment plants in southern Iraq; therefore, the purpose of this development is to support planning based on resilience for water supply networks facing experienced hadrochemical stresses.
6. Conclusion
This study assessed the quality of treated drinking water at the Al-Baradiyah Water Treatment Plant in Basra, Iraq, under conditions of intensifying salinity intrusion in the Shatt al-Arab River, employing an integrated methodological framework combining the Water Quality Index (WQI), removal efficiency (RE) analysis, spatial-environmental assessment, and artificial neural network (ANN) modelling. The following main findings are derived from the results. Although the composite WQI of the treated water was 90.83, thereby falling into the ‘good’ category; this composite score masks substantial exceedances of salinity relevant parameters, namely TDS, EC, chloride, sulphate and total hardness which exceeded WHO guideline values. Using a monthly-based calculation, the temporal variability in WQI was pronounced; with values varying from 58.66 (June 2025, Medium category) to over 108.72 (March 2024); indicating that mean-based WQI computation conceals important declines in water quality during periods of maximum salinity [10%].
The removal efficiency analysis showed that the treatment plant can efficiently remove suspended constituents, while dissolved ionic parameters exhibited moderate, intermittent and rare negative removal efficiencies during periods of high saline concentrations.
A spatial analysis showed clear downstream increases in salinity indicators, with values of TDS at station SH4 reaching 16,566 mg/l, placing the challenges faced by the plant into the context of a more regional process of hadrochemical degradation.
The artificial neural network (ANN) model was deemed satisfactory (R = 0.9125; R2 = 0.8326), in which TSS as the principal predictor variable. Despite this insight, there is a trade-off between statistical robustness owing to the limited sample of just 24 months with directionally similar methodology and future studies are needed to expand temporal data resolution.
Ultimately, this study shows that no standalone assessment method to characterize water in the context of dynamic hadrochemical stress is adequate. This integrated WQI–RE–ANN–spatial framework model is replicable and can be employed in other salt-affected environments around the world.