

Table 1:
Chemical composition of O.P.C
| Oxide | Test result [%] | I.Q.S. 5:1984 Limits |
|---|---|---|
| CaO | 64.04 | _ |
| SiO2 | 20.8 | _ |
| Al2O3 | 4.0 | _ |
| Fe2O3 | 4.82 | _ |
| MgO | 1.43 | <5.0 |
| SO3 | 2.52 | <2.8 |
| Loss On Ignition (L.O.I.) | 1.73 | <4.0 |
| Lime Saturation Factor (L.S.F.) | 0.91 | 0.66 – 1.02 |
| Insoluble Residue (I.R.) | 0.67 | 1.5 [%] |
| Free Lime (F.L.) total | 99.42 | _ |
| Compound composition | ||
| C3S% | 54.0 | _ |
| C2S% | 19.12 | _ |
| C3A% | 6.0 | _ |
| C4AF% | 12.17 | _ |
Table 2:
Physical properties of O.P.C
| Physical properties | Test results | I.Q.S.5:1984 Limits |
|---|---|---|
| Fineness, blaine [cm2/gm] | 3300 | >2300 |
| Setting time | ||
| Initial hours.; min. | 2; 0 | ≥45 min |
| Final hours.; min | 3; 0 | ≤10 hours |
| Compressive strength [MPa] | ||
| 3-days | 24 | ≥15 |
| 28-days | 35 | ≥23 |
Table 3:
Physical and chemical properties of coarse aggregate
| Properties | Test results | I.Q.S.45:1984: Limits |
|---|---|---|
| Apparent specific gravity | 2.6 | - |
| Bulk density kg/m3 | 1700 | - |
| Absorption % | 0.85 | - |
| Clay % | 0.5 | 1.0 (max) |
| Sulphate content (SO3) % | 0.09 | 0.10 (max) |
Table 5:
Physical and chemical properties of sand
| Properties | Test results | I.Q.S.45:1984: Limits |
|---|---|---|
| Grading zone | three | - |
| Fineness modulus | 2.46 | - |
| Apparent specific gravity | 2.65 | - |
| Bulk density [kg/m3] | 1580 | - |
| Sulphate content (SO3) [%] | 0.242 | 0.50 (max) |
| Clay [%] | 2.3 | 3.0 (max) |
Table 6:
Grading of fine aggregate
| Sieve size [mm] | Passing [%] | I.Q.S: 1984 Limits zone (3) |
|---|---|---|
| 5 | 98 | 90 – 100 |
| 2.36 | 90 | 85 – 100 |
| 1.18 | 81 | 75 – 100 |
| 0.6 | 62 | 60 – 79 |
| 0.3 | 33 | 12 – 40 |
| 0.15 | 2 | 0 – 10 |
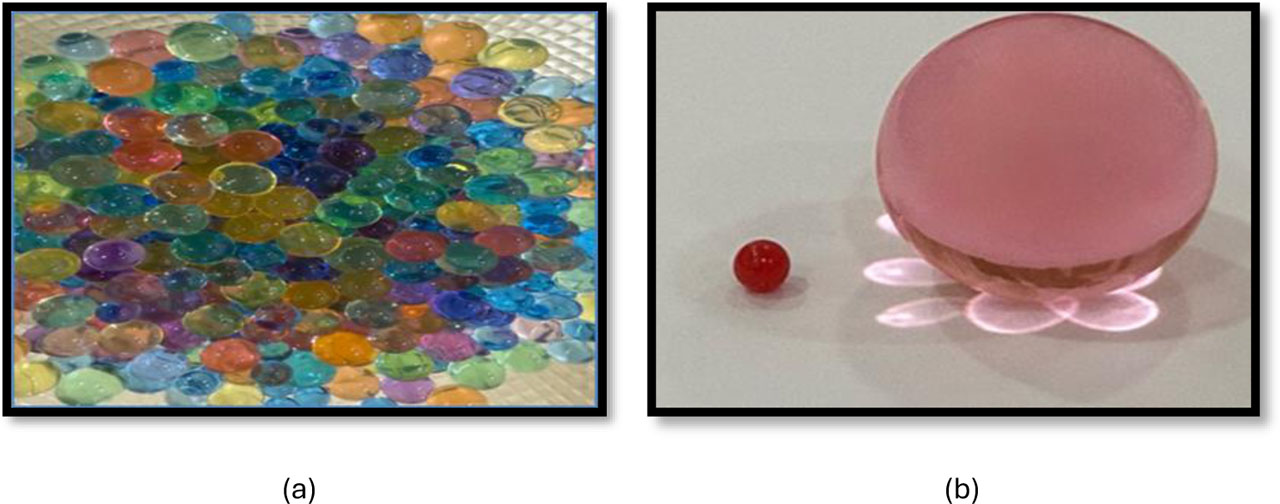
Figure 1:
(a) APBs after soaking 24hrs, (b) comparison between APBs before and after soaking in water 24 hrs
Table 7:
Mix design proportions
| Component | Control | 0.5% APBs | 1% APBs | 1.5% APBs | 2% APBs | 2.5% APBs | 3% APBs | 3.5% APBs | 4% APBs | 4.5% APBs | 5% APBs |
|---|---|---|---|---|---|---|---|---|---|---|---|
| Cement [Kg/m3] | 400 | 400 | 400 | 400 | 400 | 400 | 400 | 400 | 400 | 400 | 400 |
| Sand [Kg/m3] | 600 | 600 | 600 | 600 | 600 | 600 | 600 | 600 | 600 | 600 | 600 |
| Gravel [Kg/m3] | 1200 | 1200 | 1200 | 1200 | 1200 | 1200 | 1200 | 1200 | 1200 | 1200 | 1200 |
| Water [Kg/m3] | 180 | 180 | 180 | 180 | 180 | 180 | 180 | 180 | 180 | 180 | 180 |
| APBs [Kg/m3] | 0 | 2 | 4 | 6 | 8 | 10 | 12 | 14 | 16 | 18 | 20 |
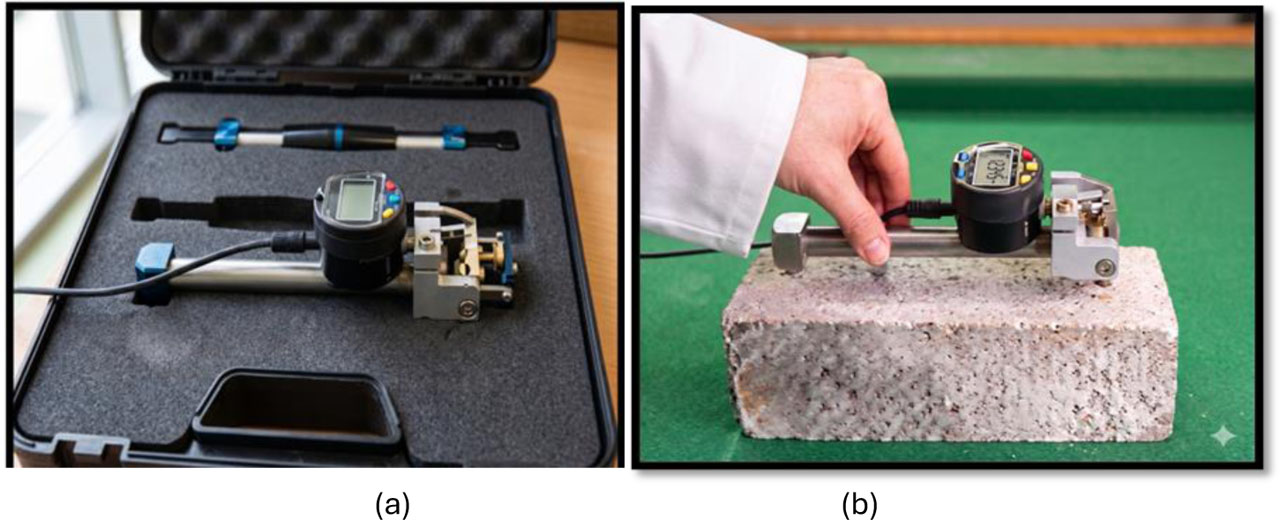
Figure 2:
(a) The apparatus used, (b) Drying shrinkage test
Table 8:
Experimental testing program
| Test category | Property evaluated | Standard specification | Specimen size [mm] | Testing ages [Days] | Replicates per age | Total specimens |
|---|---|---|---|---|---|---|
| Fresh concrete | Workability (Slump) | ASTM C143 | N/A | Fresh state | 1 | 11 |
| Mechanical properties | Compressive strength | B.S. 1881: Part 116 | 100 × 100 × 100 | 7, 14, 28, 56, 90 | 3 | 165 |
| Splitting tensile strength | ASTM C496 | 100 (dia.) × 200 | 7, 14, 28, 56, 90 | 3 | 165 | |
| Volume stability | Drying shrinkage | ASTM C490 | 75 × 75 × 285 | Continuous (up to 90) | 2 | 22 |
| Grand total | 363 |
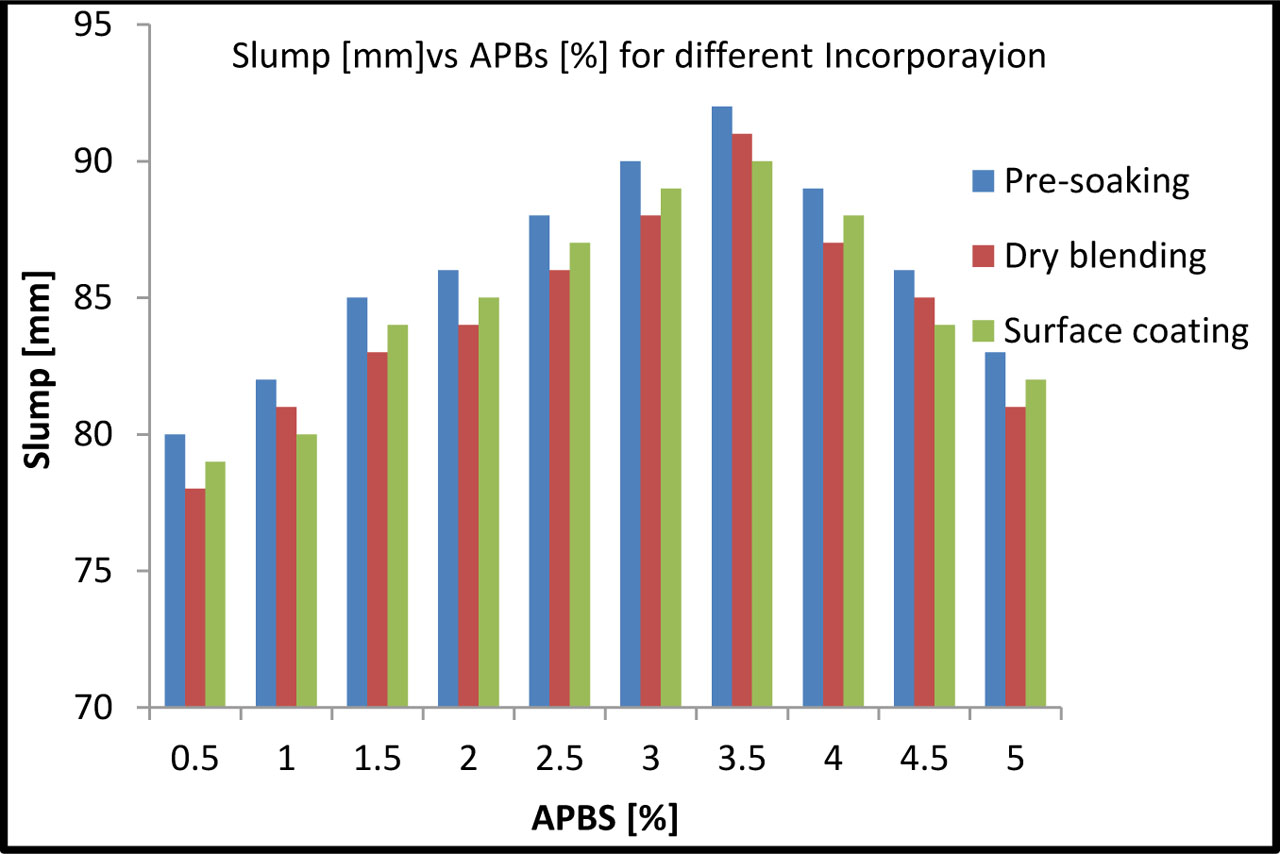
Figure 3:
Slump [mm] vs APBs [%] for different incorporation methods
Table 9:
Result slump [mm] vs APBs [%] for different incorporation methods
| APBs [%] | Incorporation method | Slump [mm] |
|---|---|---|
| Control | - | 75 |
| 0.5 | Pre-soaking | 80 |
| Dry blending | 78 | |
| Surface coating | 79 | |
| 1.0 | Pre-soaking | 82 |
| Dry blending | 81 | |
| Surface coating | 80 | |
| 1.5 | Pre-soaking | 85 |
| Dry blending | 83 | |
| Surface coating | 84 | |
| 2 | Pre-soaking | 86 |
| Dry blending | 84 | |
| Surface coating | 85 | |
| 2.5 | Pre-soaking | 88 |
| Dry blending | 86 | |
| Surface coating | 87 | |
| 3.0 | Pre-soaking | 90 |
| Dry blending | 88 | |
| Surface coating | 89 | |
| 3.5 | Pre-soaking | 92 |
| Dry blending | 91 | |
| Surface coating | 90 | |
| 4.0 | Pre-soaking | 89 |
| Dry blending | 87 | |
| Surface coating | 88 | |
| 4.5 | Pre-soaking | 86 |
| Dry blending | 85 | |
| Surface coating | 84 | |
| 5.0 | Pre-soaking | 83 |
| Dry blending | 81 | |
| Surface coating | 82 |
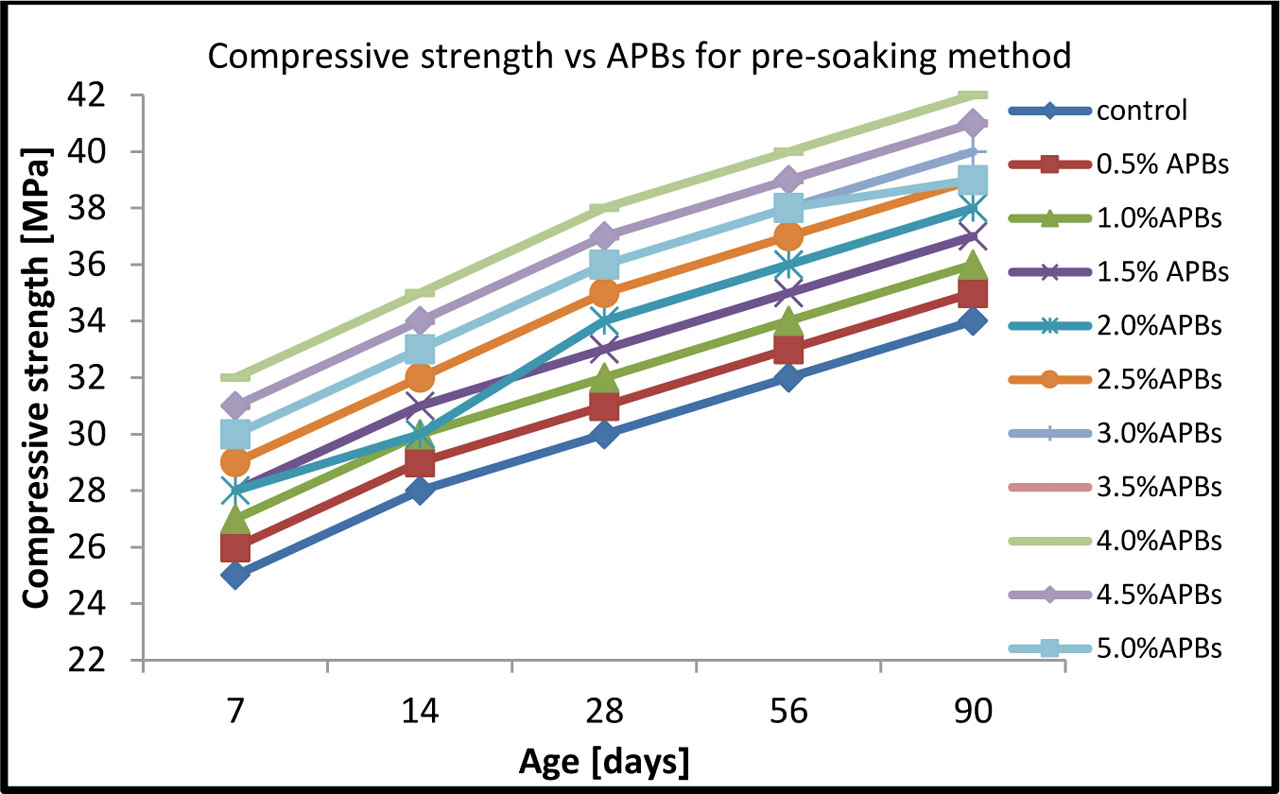
Figure 4:
Compressive strength vs APBs for pre-soaking method
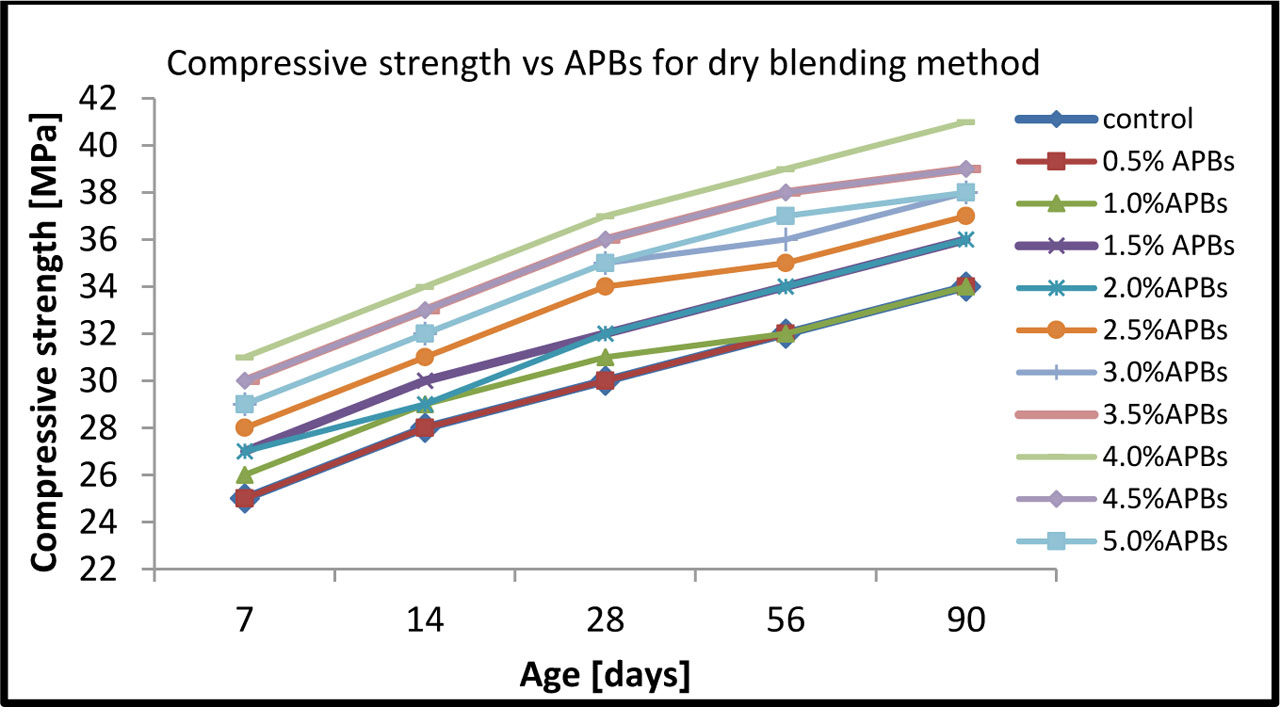
Figure 5:
Compressive strength vs APBs for dry blending method
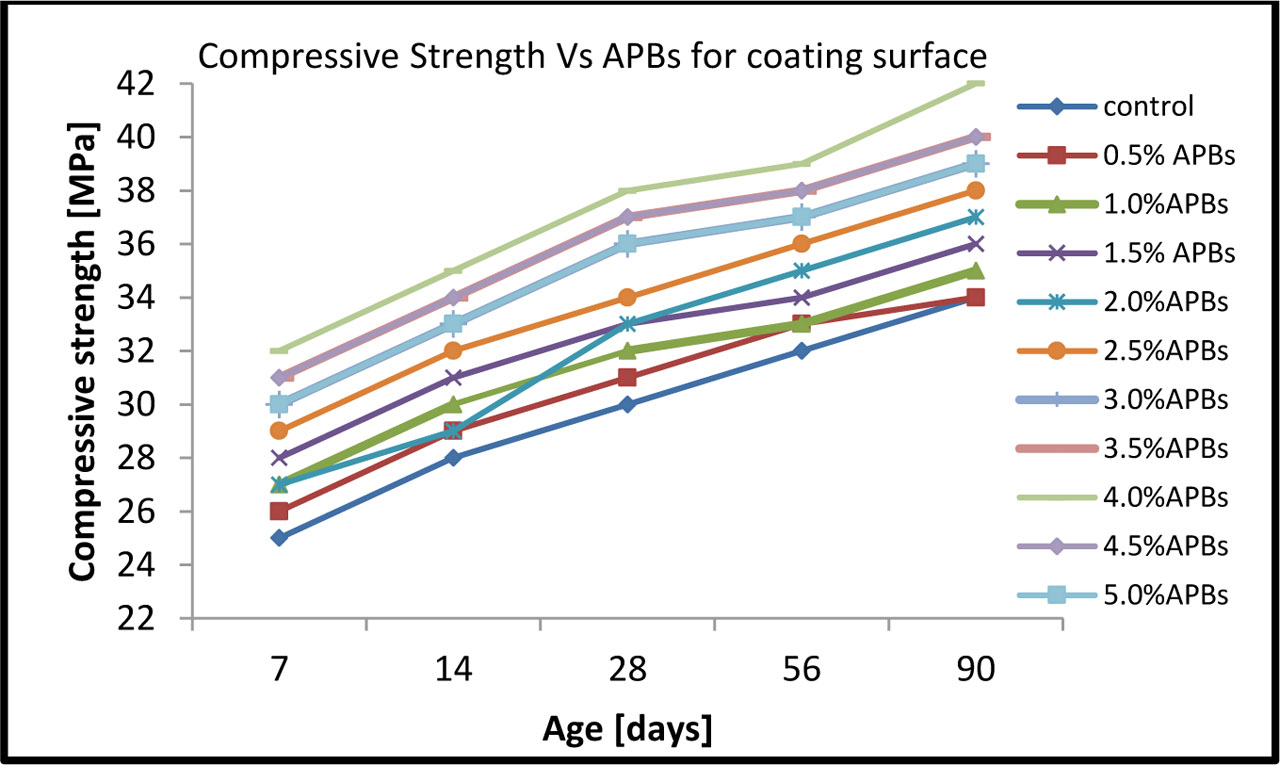
Figure 6:
Compressive strength vs APBs for coating surface method
Table 10:
Results of the compressive strength [MPa] vs APBs content
| APBs content [%] | Incorporation method | 7 days [MPa] | 14 days [MPa] | 28 days [MPa] | 56 days [MPa] | 90 days [MPa] |
|---|---|---|---|---|---|---|
| Control | 25 | 28 | 30 | 32 | 34 | |
| 0.5 | Pre-soaking | 26 | 29 | 31 | 33 | 35 |
| Dry blending | 25 | 28 | 30 | 32 | 34 | |
| Surface coating | 26 | 29 | 31 | 33 | 34 | |
| 1.0 | Pre-soaking | 27 | 30 | 32 | 34 | 36 |
| Dry blending | 26 | 29 | 31 | 32 | 34 | |
| Surface coating | 27 | 30 | 32 | 33 | 35 | |
| 1.5 | Pre-soaking | 28 | 31 | 33 | 35 | 37 |
| Dry blending | 27 | 30 | 32 | 34 | 36 | |
| Surface coating | 28 | 31 | 33 | 34 | 36 | |
| 2.0 | Pre-soaking | 28 | 30 | 34 | 36 | 38 |
| Dry blending | 27 | 29 | 32 | 34 | 36 | |
| Surface coating | 27 | 29 | 33 | 35 | 37 | |
| 2.5 | Pre-soaking | 29 | 32 | 35 | 37 | 39 |
| Dry blending | 28 | 31 | 34 | 35 | 37 | |
| Surface coating | 29 | 32 | 34 | 36 | 38 | |
| 3.0 | Pre-soaking | 30 | 33 | 36 | 38 | 40 |
| Dry blending | 29 | 32 | 35 | 36 | 38 | |
| Surface coating | 30 | 33 | 36 | 37 | 39 | |
| 3.5 | Pre-soaking | 31 | 34 | 37 | 39 | 41 |
| Dry blending | 30 | 33 | 36 | 38 | 39 | |
| Surface coating | 31 | 34 | 37 | 38 | 40 | |
| 4.0 | Pre-soaking | 32 | 35 | 38 | 40 | 42 |
| Dry blending | 31 | 34 | 37 | 39 | 41 | |
| Surface coating | 32 | 35 | 38 | 39 | 42 | |
| 4.5 | Pre-soaking | 31 | 34 | 37 | 39 | 41 |
| Dry blending | 30 | 33 | 36 | 38 | 39 | |
| Surface coating | 31 | 34 | 37 | 38 | 40 | |
| 5.0 | Pre-soaking | 30 | 33 | 36 | 38 | 40 |
| Dry blending | 29 | 32 | 35 | 37 | 38 | |
| Surface coating | 30 | 33 | 36 | 37 | 39 |
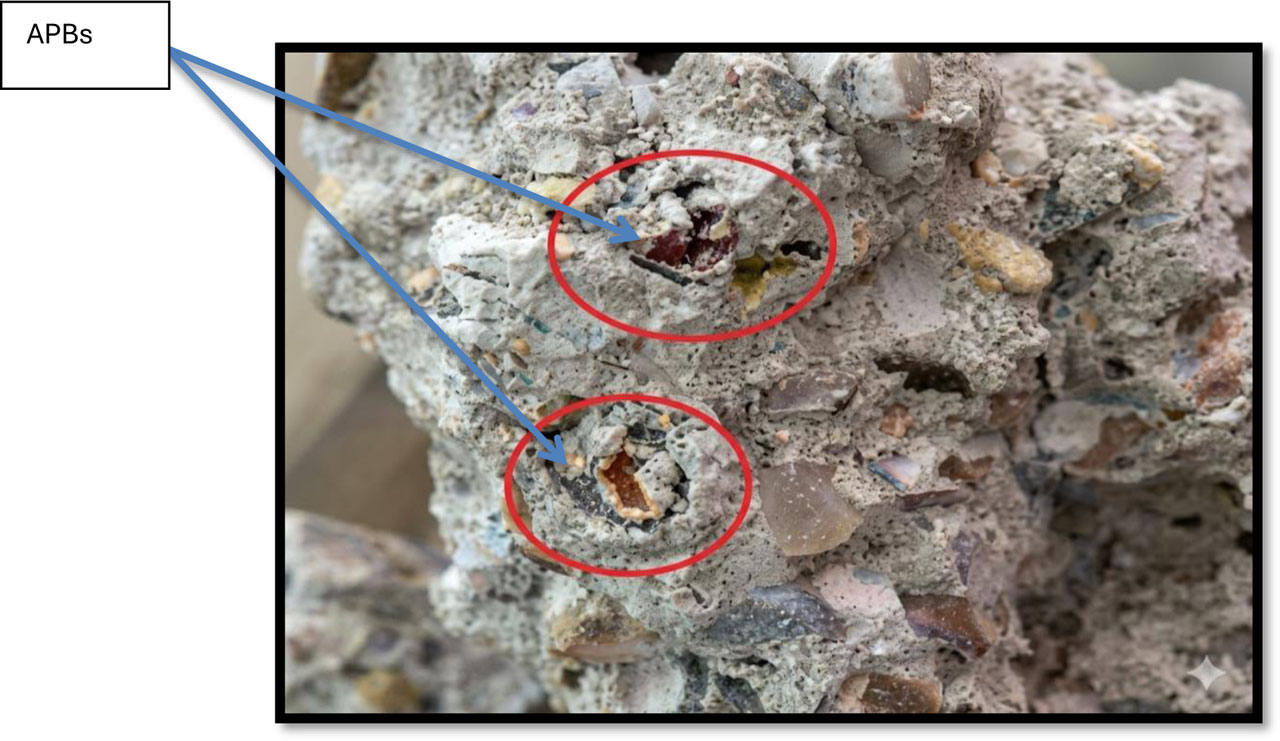
Figure 7:
Absorbent Polymer Balls explosion during test
Table 11:
Results of the splitting tensile strength (MPa) vs APBs content
| APBs content [%] | Incorporation method | 7 days [MPa] | 14 days [MPa] | 28 days [MPa] | 56 days [MPa] | 90 days [MPa] |
|---|---|---|---|---|---|---|
| Control | - | 2.4 | 2.5 | 2.5 | 2.6 | 2.7 |
| 0.5 | Pre-soaking | 2.5 | 2.6 | 2.7 | 2.8 | 2.9 |
| Dry blending | 2.4 | 2.5 | 2.5 | 2.6 | 2.7 | |
| Surface coating | 2.5 | 2.6 | 2.7 | 2.8 | 2.8 | |
| 1.0 | Pre-soaking | 2.6 | 2.7 | 2.8 | 2.9 | 3.0 |
| Dry blending | 2.5 | 2.6 | 2.7 | 2.8 | 2.9 | |
| Surface coating | 2.6 | 2.7 | 2.8 | 2.9 | 3.0 | |
| 1.5 | Pre-soaking | 2.7 | 2.8 | 2.9 | 3.0 | 3.1 |
| Dry blending | 2.6 | 2.7 | 2.8 | 2.9 | 3.0 | |
| Surface coating | 2.7 | 2.8 | 2.9 | 3.0 | 3.1 | |
| 2.0 | Pre-soaking | 3.0 | 3.5 | 4.0 | 4.5 | 4.8 |
| Dry blending | 2.8 | 3.3 | 3.8 | 4.3 | 4.6 | |
| Surface coating | 2.9 | 3.4 | 3.9 | 4.4 | 4.5 | |
| 2.5 | Pre-soaking | 2.8 | 2.9 | 3.0 | 3.1 | 3.2 |
| Dry blending | 2.7 | 2.8 | 2.9 | 3.0 | 3.1 | |
| Surface coating | 2.8 | 2.9 | 3.0 | 3.1 | 3.2 | |
| 3.0 | Pre-soaking | 2.9 | 3.0 | 3.1 | 3.2 | 3.3 |
| Dry blending | 2.8 | 2.9 | 3.0 | 3.1 | 3.2 | |
| Surface coating | 2.9 | 3.0 | 3.1 | 3.2 | 3.4 | |
| 3.5 | Pre-soaking | 3.0 | 3.1 | 3.2 | 3.3 | 3.4 |
| Dry blending | 2.9 | 3.0 | 3.1 | 3.2 | 3.3 | |
| Surface coating | 3.0 | 3.1 | 3.2 | 3.3 | 3.4 | |
| 4.0 | Pre-soaking | 3.1 | 3.2 | 3.3 | 3.4 | 3.5 |
| Dry blending | 3.0 | 3.1 | 3.2 | 3.3 | 3.4 | |
| Surface coating | 3.1 | 3.2 | 3.3 | 3.4 | 3.5 | |
| 4.5 | Pre-soaking | 3.0 | 3.1 | 3.2 | 3.3 | 3.4 |
| Dry blending | 2.9 | 3.0 | 3.1 | 3.2 | 3.3 | |
| Surface coating | 3.0 | 3.1 | 3.2 | 3.3 | 3.4 | |
| 5.0 | Pre-soaking | 2.9 | 3.0 | 3.1 | 3.2 | 3.3 |
| Dry blending | 2.8 | 2.9 | 3.0 | 3.1 | 3.2 | |
| Surface coating | 2.9 | 3.0 | 3.1 | 3.2 | 3.3 |
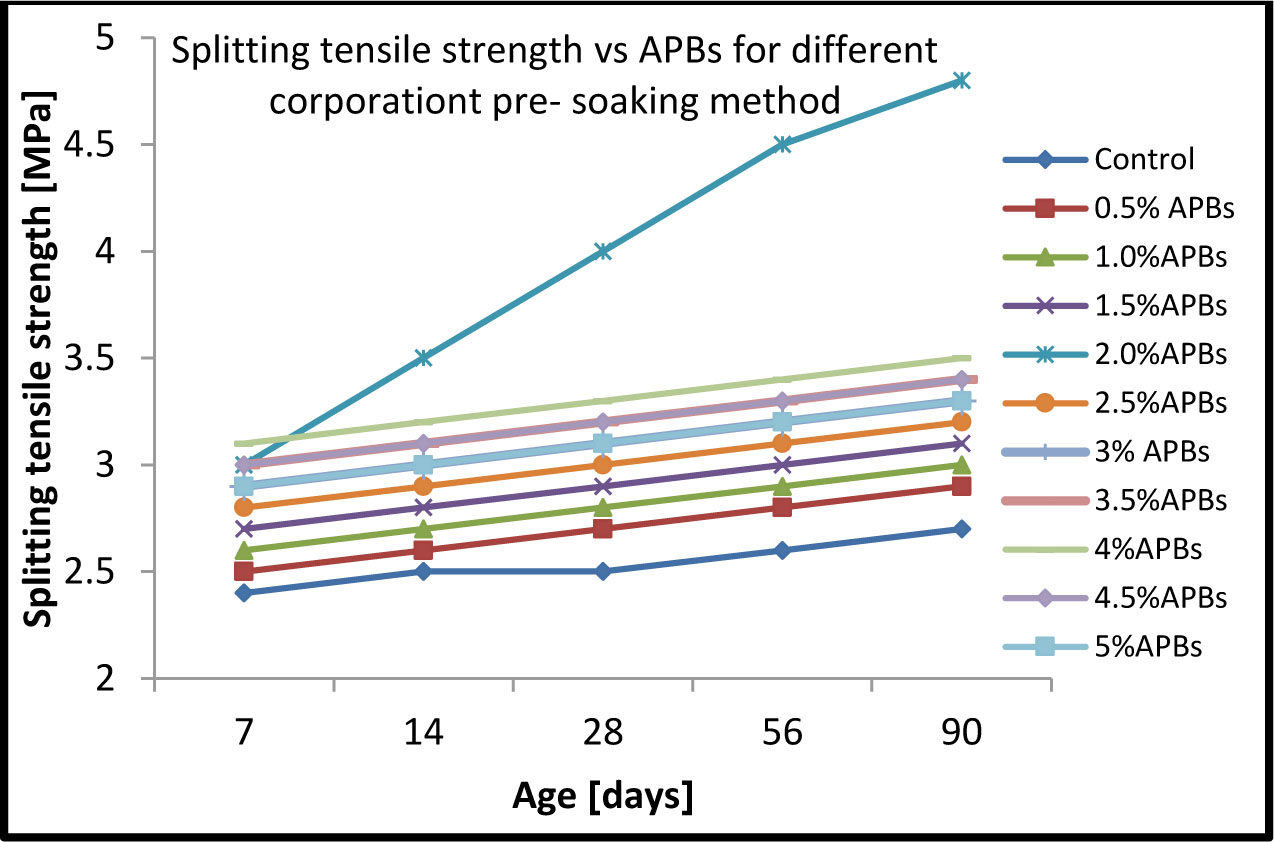
Figure 8:
Splitting tensile strength vs APBs for different corporation (pre-soaking) method
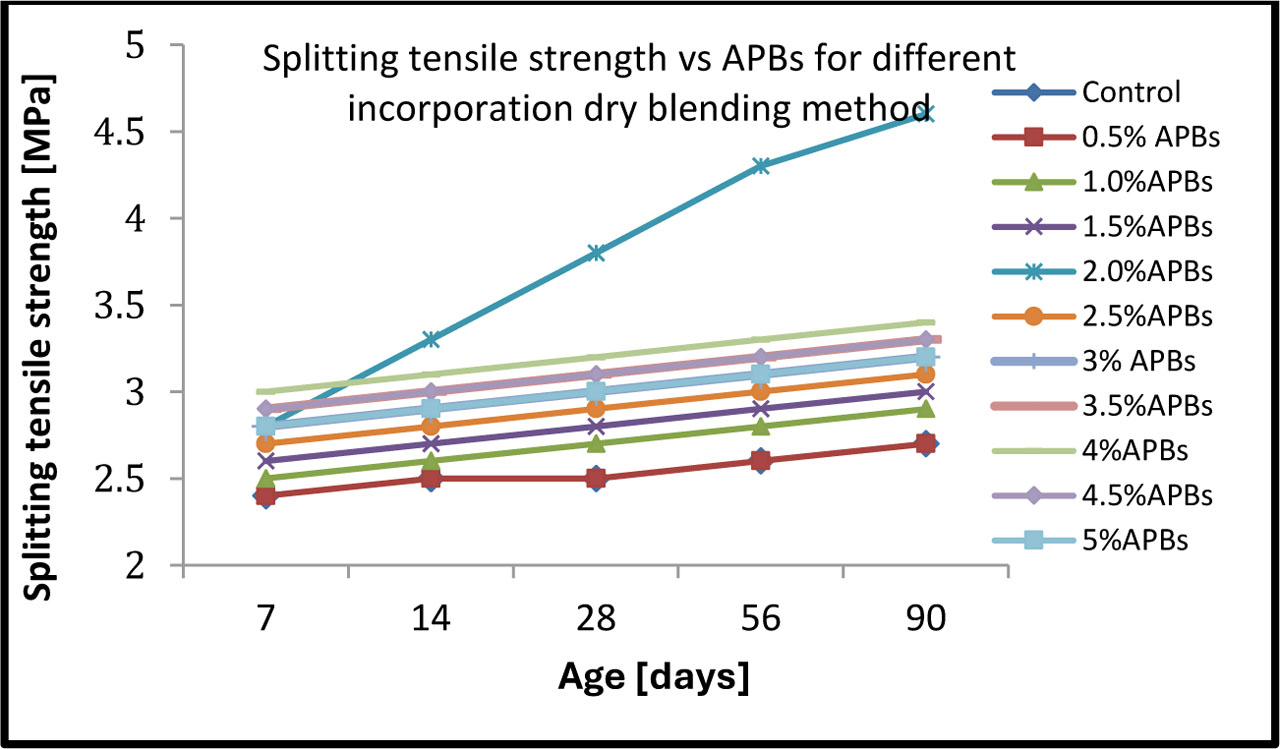
Figure 9:
Splitting tensile strength vs APBs for different incorporation (dry blending) method
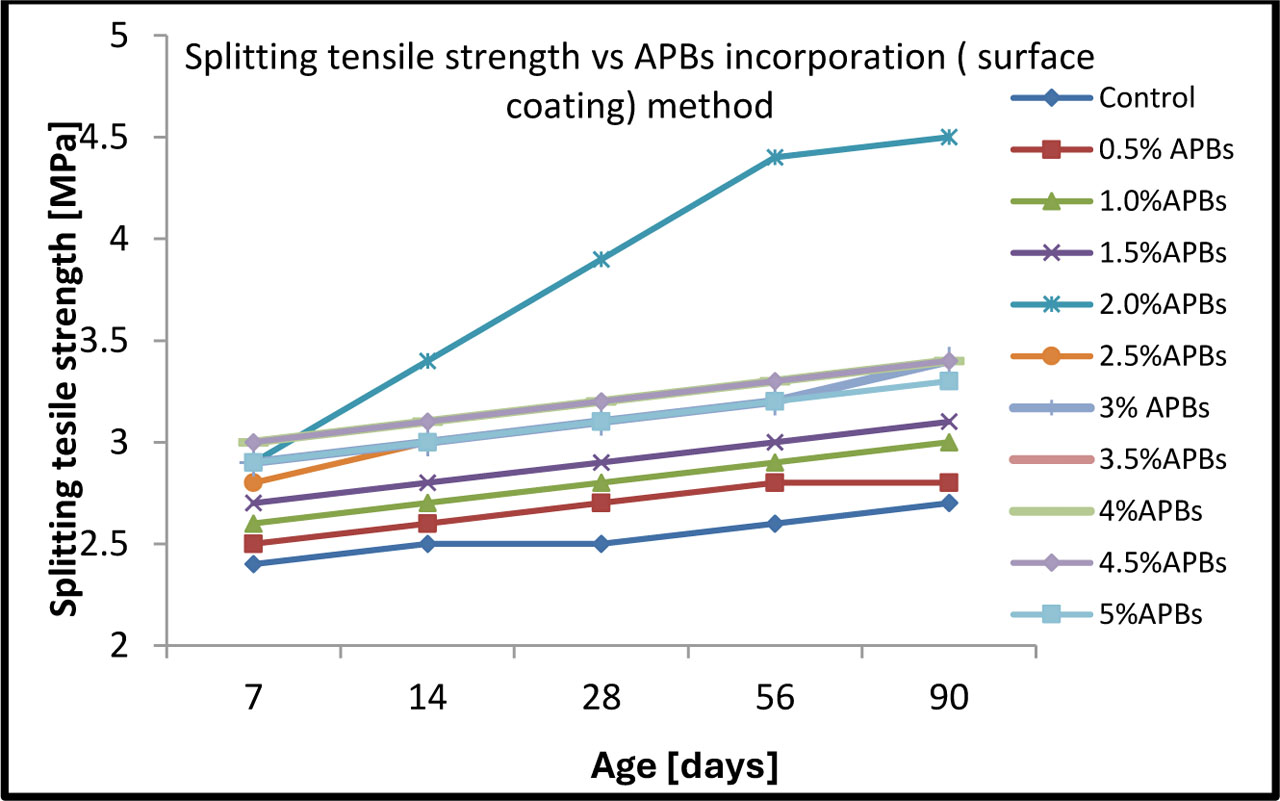
Figure 10:
Splitting tensile strength vs APBs incorporation (surface coating) method
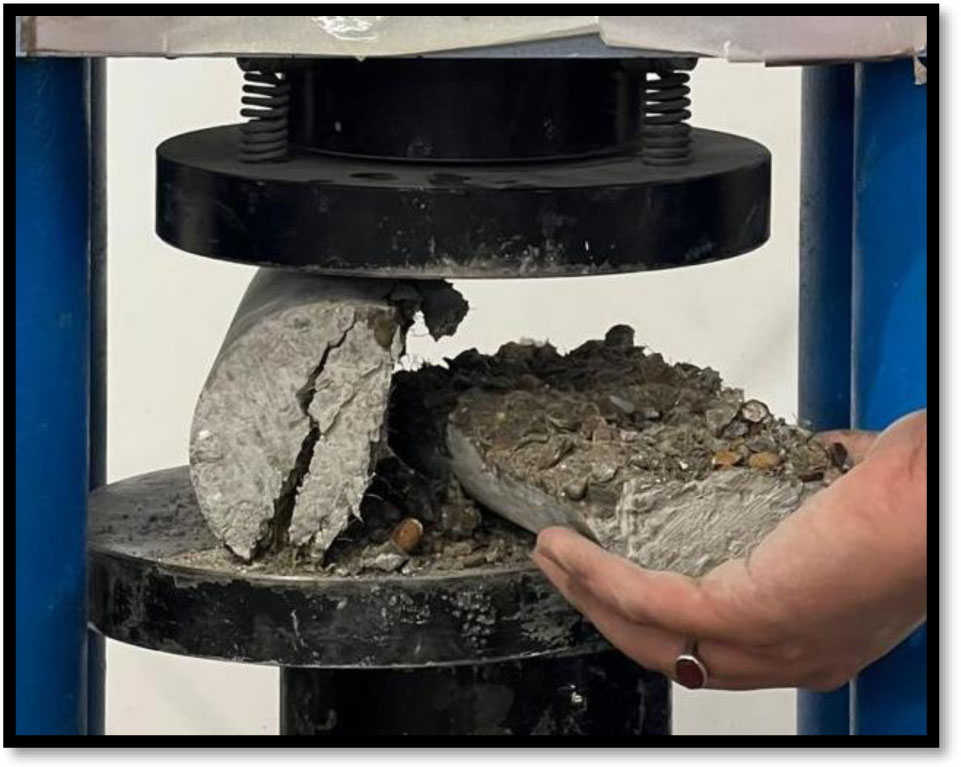
Figure 11:
Sample of tested cylinder splitting
Table 12:
Shrinkage vs APBs content
| APBs content [%] | Incorporation method | Shrinkage (µε) at 7 days | Shrinkage (µε) at 14 days | Shrinkage (µε) at 28 days | Shrinkage (µε) at 56 days | Shrinkage (µε) at 90 days |
|---|---|---|---|---|---|---|
| Control | - | 350 | 400 | 500 | 550 | 630 |
| 0.5 | Pre-soaking | 340 | 380 | 480 | 530 | 570 |
| Dry blending | 345 | 390 | 490 | 540 | 590 | |
| Surface coating | 348 | 395 | 495 | 545 | 595 | |
| 1.0 | Pre-soaking | 330 | 360 | 460 | 510 | 550 |
| Dry blending | 335 | 365 | 470 | 520 | 560 | |
| Surface coating | 337 | 368 | 475 | 525 | 565 | |
| 1.5 | Pre-soaking | 320 | 340 | 440 | 490 | 530 |
| Dry blending | 325 | 345 | 450 | 500 | 540 | |
| Surface coating | 327 | 348 | 455 | 505 | 545 | |
| 2.0 | Pre-soaking | 310 | 320 | 420 | 470 | 510 |
| Dry blending | 315 | 325 | 430 | 480 | 500 | |
| Surface coating | 317 | 328 | 435 | 485 | 505 | |
| 2.5 | Pre-soaking | 300 | 310 | 400 | 450 | 490 |
| Dry blending | 305 | 315 | 410 | 460 | 496 | |
| Surface coating | 307 | 318 | 415 | 465 | 500 | |
| 3.0 | Pre-soaking | 290 | 300 | 380 | 430 | 470 |
| Dry blending | 295 | 305 | 390 | 440 | 477 | |
| Surface coating | 297 | 308 | 395 | 445 | 480 | |
| 3.5 | Pre-soaking | 280 | 290 | 360 | 410 | 450 |
| Dry blending | 285 | 295 | 370 | 420 | 455 | |
| Surface coating | 287 | 298 | 375 | 425 | 460 | |
| 4.0 | Pre-soaking | 270 | 280 | 350 | 400 | 430 |
| Dry blending | 275 | 285 | 360 | 410 | 440 | |
| Surface coating | 277 | 288 | 365 | 415 | 445 | |
| 4.5 | Pre-soaking | 280 | 290 | 360 | 410 | 440 |
| Dry blending | 285 | 298 | 378 | 427 | 455 | |
| Surface coating | 287 | 307 | 375 | 432 | 467 | |
| 5.0 | Pre-soaking | 290 | 300 | 370 | 420 | 454 |
| Dry blending | 295 | 305 | 380 | 430 | 461 | |
| Surface coating | 297 | 309 | 385 | 437 | 468 |
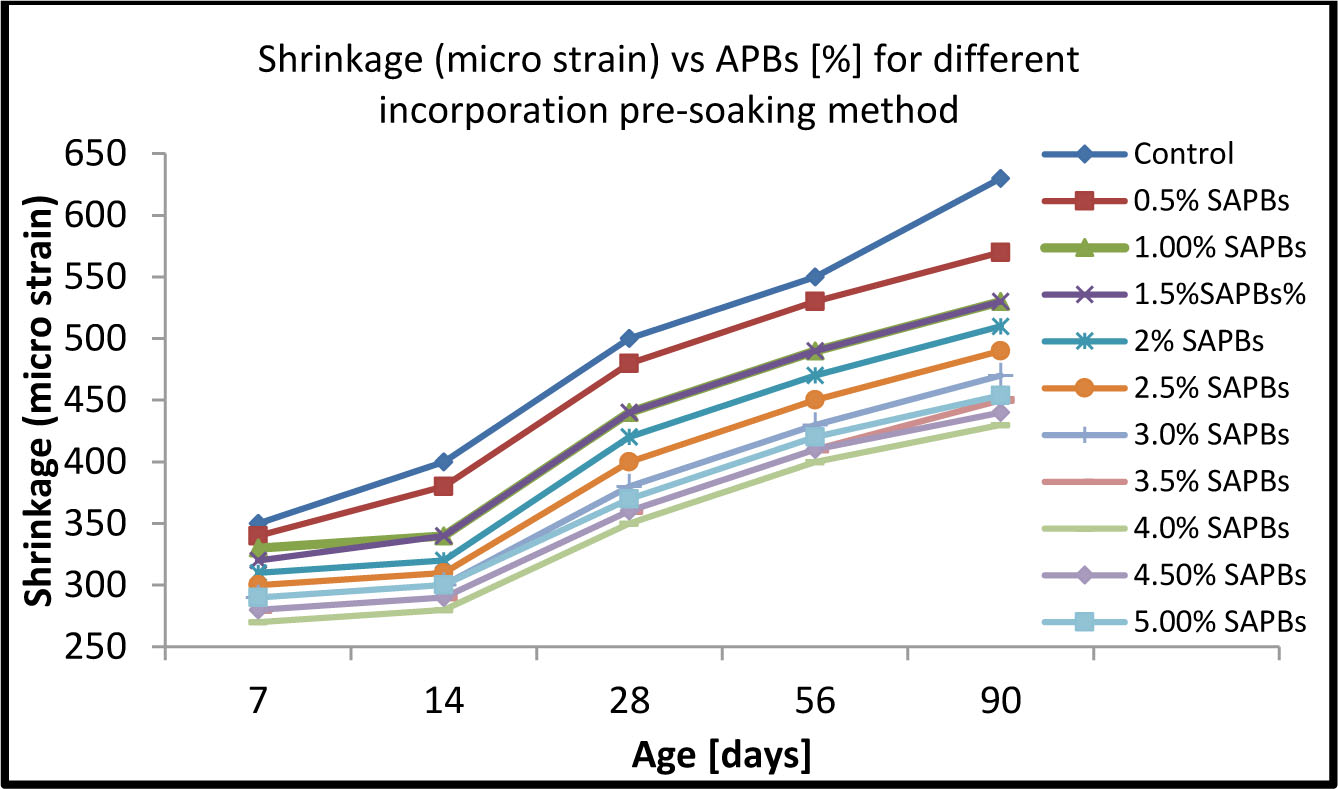
Figure 12:
Shrinkage (micro strain) vs APBs for different incorporation (pre-soaking)
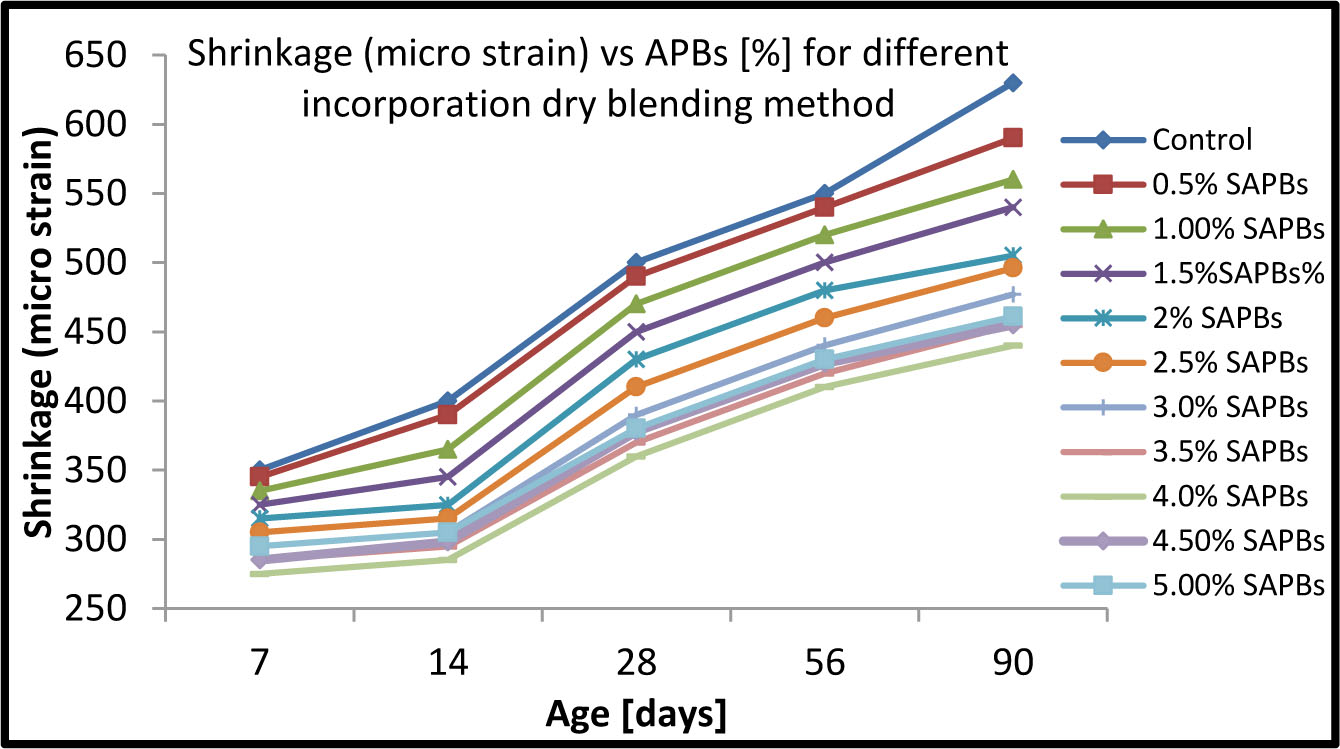
Figure 13:
Shrinkage (micro strain) vs APBs for different incorporation (dry blending) method
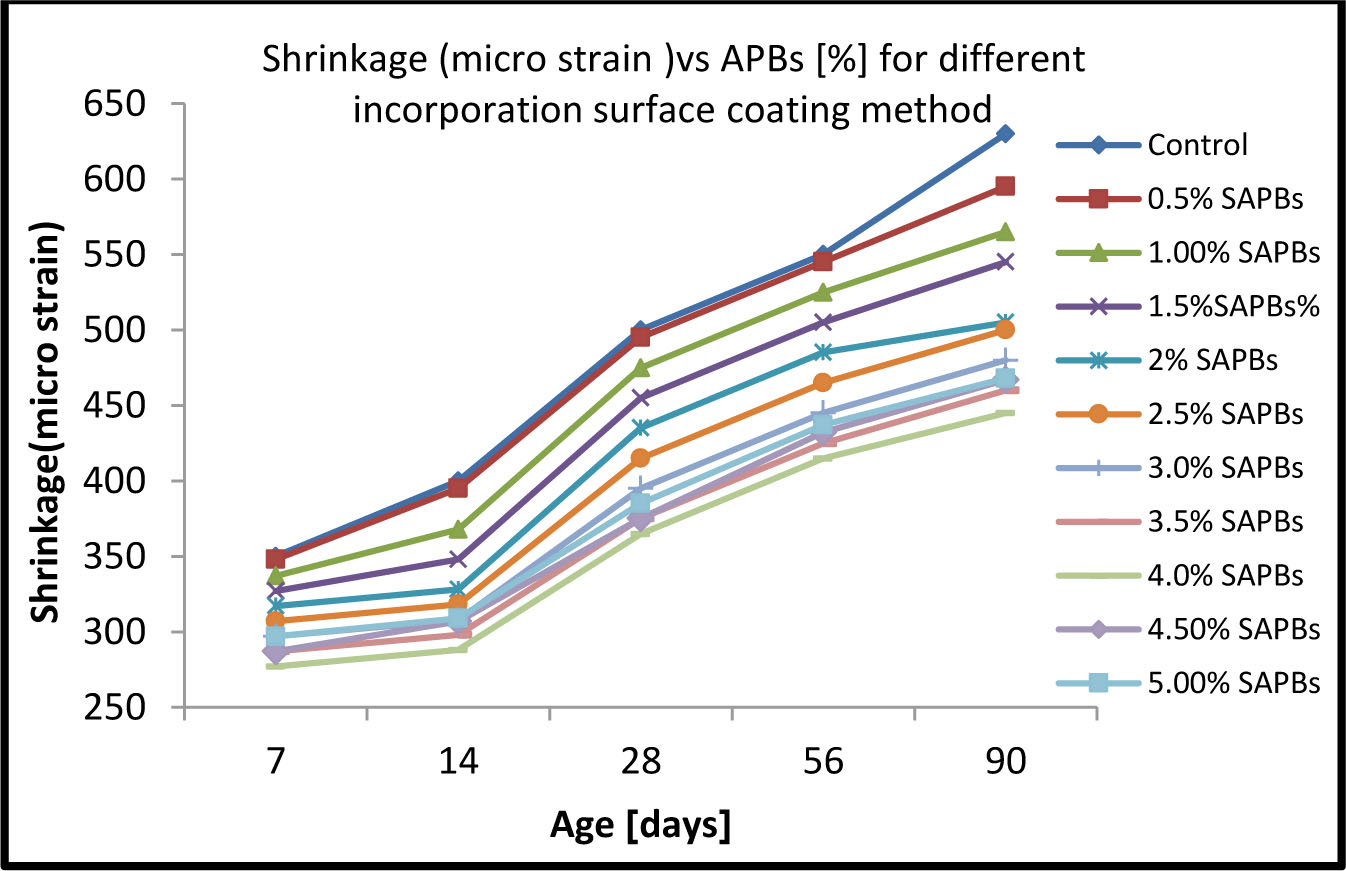
Figure 14:
Shrinkage (micro strain) vs APBs for different incorporation surface coating method conclusion