

1. Introduction
It is known that the strength of concrete structures depends largely on cracking induced by shrinkage since the material thus becomes sensitive to weathering and structural damage (Mehta & Monteiro, 2014; Jensen & Hansen, 2001; Neville, 2011). Shrinkage is determined by many parameters but is mostly defined by the water-to-cement (w/c) ratio, drying conditions, and atmospheric humidity (Hashim, 2020). With water escaping from the gel phase of the concrete during initial hydration, there appears the necessity to increase the stability and resistance of the concrete through decreasing such losses (Powers, 1958).
To solve the described problem, the technique of internal curing with the help of the so-called “smart materials”, namely, Absorbent Polymer Balls (APBs), was developed (Jensen, 2013). These polymer spheres have high absorptivity as they can hold up to 100–400% of their dry weight in water and release it progressively when the surrounding cement matrix gets dried out (Esteves, 2011). With the introduction into concrete, the spheres swell creating additional reservoirs of water in the composition. This water gets released gradually throughout the hydration process, performing an internal curing function and eliminating shrinkage without damaging other qualities of concrete (Jensen, 2013; Al-Mulla, 2026). (Ahmed & Abdual Ameer, 2015), directed their study on the incorporation of the water-absorbent polymer balls into concrete. The volumetric changes of these polymer-modified mixes were considered in comparison with a reference mix that had no polymers. Specimen curing was done both in air and in water, enabling the drawing of an appropriate comparison on performance. Their results indicated that specimens that were cured in air expanded while the ones in water tended to shrink. This contrasts with the behaviour highlighted, which underlines how large an effect the curing conditions have on the dimensional stability of concretes incorporating water-absorbing polymers. However, despite thorough examination of the effect of the composition of APBs particles on rheological characteristics (Adams et al., 2022; Huang et al., 2022; Morinaga et al., 2022), there exists a lack of literature studies examining the effects of incorporation method on the aforementioned parameters and the mechanical behaviour of concrete. Much research has been carried out in recent times regarding the behaviour of concretes using APBs. Most of the past studies have concentrated on studying the effect of various amounts of APBs on the mechanical properties and autogenous shrinkage (Ahmed & Abdul Ameer, 2015). Recently, innovations made in sustainable building materials and internal curing technology continue to emphasize the significance of admixtures in such developments (Bentz & Weiss, 2011; Al-Mulla & Aziz, 2026; AL-Mulla & AL-Rihimy 2026). According to the comprehensive review by Bentz and Weiss (2011), internal curing serves as a vital mechanism for maintaining internal relative humidity in high-performance concrete. Their study emphasized that the gradual release of water from internal reservoirs significantly enhances the quality of the Interfacial Transition Zone (ITZ), thereby reducing autogenous shrinkage and mitigating the development of micro-cracks. Hashimoto et al. (2006) investigated the application of Superabsorbent Polymers in cementitious materials, demonstrating that these additives play a crucial role in densifying the concrete matrix. Their findings indicated that controlled moisture delivery through polymers leads to a more uniform hydration process, resulting in improved compressive strength and a more resilient pore structure. (Yu et al. 2022), found that with the increase of APBs content, shrinkage and tensile strength of UHPC increased firstly and then decreased. They carried out three-point bending test of a notched beam, single-crack tensile test and mercury porosimetry, they concluded that the optimum dosage of APBs was between 0.1% and 0.15%. (De Meyst et al. 2021), carried out tests in a restrained ring and bellow, and it was noticed that an APBs can reduce shrinkage of a mortar mixture by more than 80% for the first 7 days, but this effectiveness decreases considerably beyond this. The action of APBs on drying shrinkage and relative humidity distribution in concrete slabs was studied by (Yang et al. 2019). It showed that APBs performed best to curb shrinkage during the first initial 7 days and significantly diminished the differences in humidity at several depths in pavement slabs, too. (Kakinuma et al. 2022), developed delayed-absorption APBs, which provided shrinkage with no additional water and with no adverse effects on compressive strength. Considering the different ways of APBs incorporation, most of the recent research has focused on the effect of APBs on the rheological behaviour of the concrete. (Ma et al. 2019) It presents the case of cement-based materials whose study focused on the influence of the content of dried APBs on maximum shear stress and yield stress. It was found that, as the addition of dry APBs was increased, enhancement of both yield stress and plastic viscosity could be recognized. Next, the authors (Adams et al. 2022), developed an easy mixing design method for proportioning 0.42 w/c ordinary Portland cement mortars and stated that in the case of use of 0.2% by weight of cement APBs extra water is needed, or it needs to be combined with a high range of water-reducing agents. Generally, the studies have focused on how the type and content of APBs influence shrinkage performance. In a different context, research on various methods of incorporation has mainly put emphasis on the optimum amount of additional water that is needed by APBs to attain desirable rheological improvements in cement-based materials. In such a way, different APBs incorporation methods, particularly with partial pre-absorption of water, show only limited influence in both mechanical and shrinkage respects in the properties of concrete (Adams et al. 2022). (Huang et al. 2022). presents an investigation into APBs on internal curing in early shrinkage, with the aim of developing very low shrinkage and low-crack bridge levelling layers. The major tests consisted of determinations of mechanical properties, ring restraint shrinkage performance, and SEM. It has been observed that affects APBs of the cementitious material mass marginally affect compressive strength. APBs delays hydration of cement and improves the overall hydration to enhance the strength of concrete. APBs reduce shrinkage considerably compared to dry addition alone. Concretes without APBs are more vulnerable to early cracking before day 28, while the incorporation of APBs enhances the microstructure and density to resist cracking.
2. Methodology
2.1. Materials
2.1.1. Cement
The Ordinary Portland cement O.P.C used in this research is conforming to Iraqi Specifications I.Q.S No. 5/1984. Its chemical compositions are given in Table 1 and physical properties are given in Table 2. The cement test results were obtained from the factory.
Table 1:
Chemical composition of O.P.C
| Oxide | Test result [%] | I.Q.S. 5:1984 Limits |
|---|---|---|
| CaO | 64.04 | _ |
| SiO2 | 20.8 | _ |
| Al2O3 | 4.0 | _ |
| Fe2O3 | 4.82 | _ |
| MgO | 1.43 | <5.0 |
| SO3 | 2.52 | <2.8 |
| Loss On Ignition (L.O.I.) | 1.73 | <4.0 |
| Lime Saturation Factor (L.S.F.) | 0.91 | 0.66 – 1.02 |
| Insoluble Residue (I.R.) | 0.67 | 1.5 [%] |
| Free Lime (F.L.) total | 99.42 | _ |
| Compound composition | ||
| C3S% | 54.0 | _ |
| C2S% | 19.12 | _ |
| C3A% | 6.0 | _ |
| C4AF% | 12.17 | _ |
2.1.2. Aggregate
Coarse Aggregate
In this work, crushed gravel of maximum size 14 mm was used and confirm to Iraqi specification No.45/1984. The aggregate was first washed and then air-dried; afterwards, it was sieved into different particle sizes that were later remixed. See Tables 3 & 4. Grading, chemical, and physical analyses of the Coarse aggregate were carried out in the Concrete Laboratory of the Engineering Technical College in Najaf.
Fine Aggregate
Natural sand of Al-Najaf region was used as the fine aggregate. Table 5 and 6 with the limits allowed by Iraqi Standard No. 45/1984. In addition, some physical and chemical properties of the fine aggregate and grading of fine aggregate are given in Tables 5 and 6. Grading, chemical, and physical analyses of the Coarse aggregate were carried out in the Concrete Laboratory of the Engineering Technical College in Najaf.
2.2. Internal Curing Agent
2.2.1. Absorbent Polymer Balls (APBs)
The internal curing agent used in this study consisted of highly crosslinked sodium acrylate produced from aqueous solution polymerization known as absorbent resin (APBs). The percentage of the cross-linking agent added was 0.06 %. The average diameter of the APBs particles was 150 μm. The dry APBs particles were immersed in water for a day prior to being used in the concrete (Esteves, 2011), as depicted in Figure 1.
In the current study, concrete mixes consisted of 0.5% to 5.0% of polymer balls by weight of cement. The mentioned range of the APBs percentage was found to be suitable in several initial experiments on trial mixes. It was revealed that at least 0.5% is needed for initiating a noticeable decrease in shrinkage, while the higher value than 5.0% leads to a dramatic decline in compressive strength because of excessive swelling of APBs (100–300 times). Different methods of incorporation of APBs in concrete mixes were tested including:
Pre-soaking: Soaking of APBs in water prior to the mixing.
Dry blending: Mixing of APBs with dry components before water addition.
Surface coating: Application of a thin layer of cement paste on APBs particles.
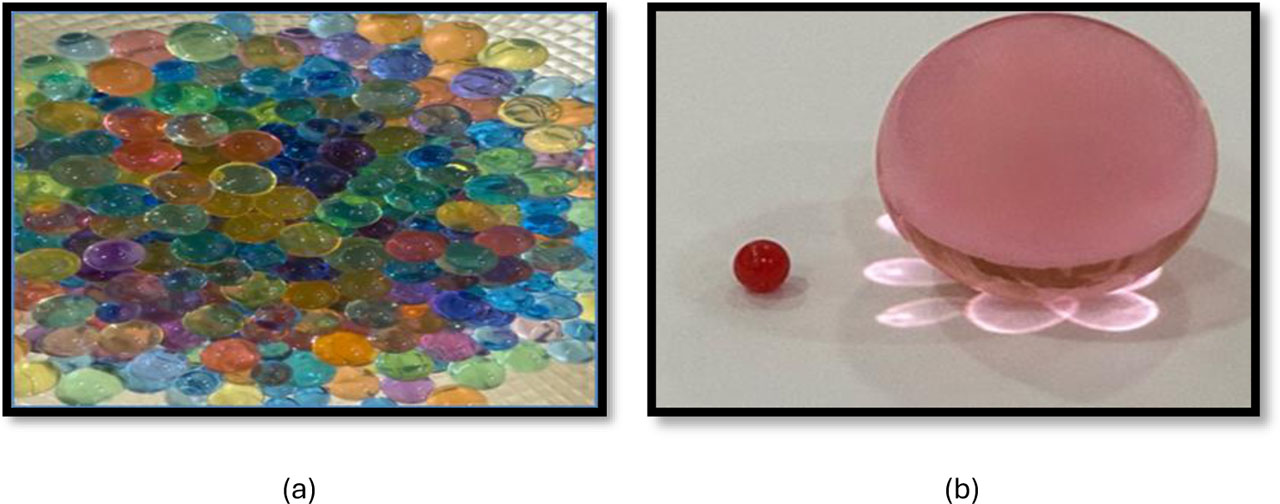
Figure 1:
(a) APBs after soaking 24hrs, (b) comparison between APBs before and after soaking in water 24 hrs
2.3. Mix Design
A target of compressive strength of about 30 MPa after 28 days was considered when formulating the concrete mixes. During the testing period, an unvarying water-to-cement (w/c) ratio of 0.45 was used in the mixes. Superplasticizer were incorporated in order to ensure that any variation in the mechanical characteristics of the concrete mixes will be due to the presence of the polymer only. Various quantities of APB (0.5% to 5.0%) were incorporated in the mixes following Table 7.
Table 7:
Mix design proportions
| Component | Control | 0.5% APBs | 1% APBs | 1.5% APBs | 2% APBs | 2.5% APBs | 3% APBs | 3.5% APBs | 4% APBs | 4.5% APBs | 5% APBs |
|---|---|---|---|---|---|---|---|---|---|---|---|
| Cement [Kg/m3] | 400 | 400 | 400 | 400 | 400 | 400 | 400 | 400 | 400 | 400 | 400 |
| Sand [Kg/m3] | 600 | 600 | 600 | 600 | 600 | 600 | 600 | 600 | 600 | 600 | 600 |
| Gravel [Kg/m3] | 1200 | 1200 | 1200 | 1200 | 1200 | 1200 | 1200 | 1200 | 1200 | 1200 | 1200 |
| Water [Kg/m3] | 180 | 180 | 180 | 180 | 180 | 180 | 180 | 180 | 180 | 180 | 180 |
| APBs [Kg/m3] | 0 | 2 | 4 | 6 | 8 | 10 | 12 | 14 | 16 | 18 | 20 |
2.4. Specimen Preparations
Cubes with dimension of (100×100×100) mm as per B.S 1881: 116: 1989 were employed for compressive strength test. Three replicate cubes were prepared and tested for each age group (7, 14, 28, 56, and 90 days) for each mix design and their mean values were calculated. In a similar fashion, cylindrical specimens with dimensions (100×200) mm were prepared as per ASTM C496-04 standards for splitting tensile test, where three replicates were tested for each age and mix design.
The volumetric variation was determined using concrete prisms with dimensions (75×75×285) mm as per ASTM C490-07, which consisted of three prisms for each mix design. Stainless steel demec points were fixed on the surface of freshly prepared concrete and after 24 hours were fixed with epoxy resin. Using mechanical dial gauge (150 mm length and 0.002 mm/division), the distance between the two points was measured to determine the volumetric change. After curing for 14 days in water, the prisms were extracted and allowed to air dry. The measurements were made at 7, 14, 28, 56 and 90 days, as shown in Figure 2. Table 8 Summary of the experimental testing program.
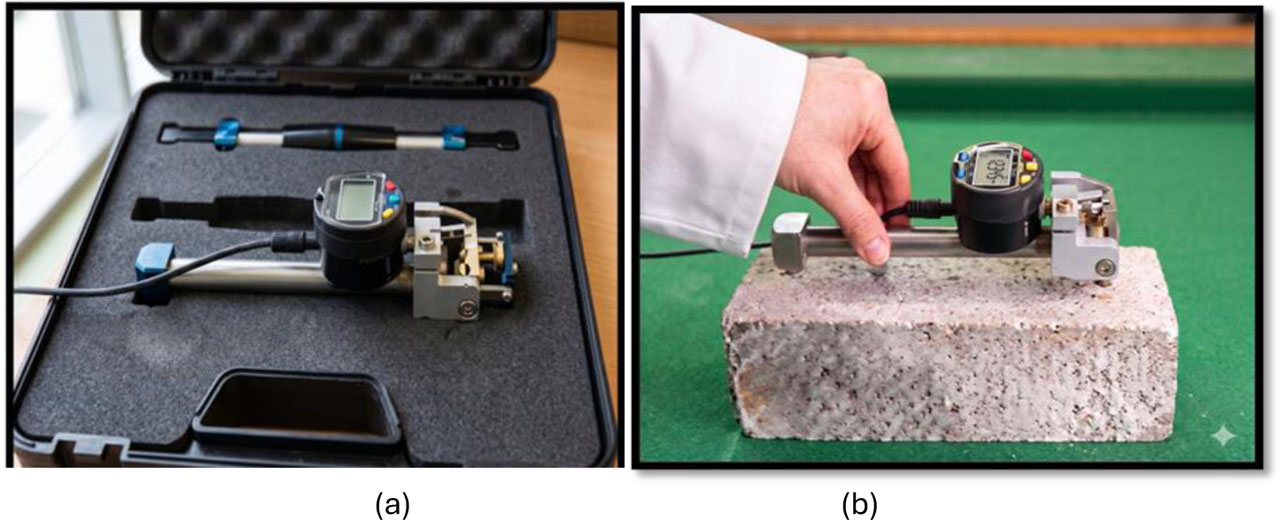
Figure 2:
(a) The apparatus used, (b) Drying shrinkage test
Table 8:
Experimental testing program
| Test category | Property evaluated | Standard specification | Specimen size [mm] | Testing ages [Days] | Replicates per age | Total specimens |
|---|---|---|---|---|---|---|
| Fresh concrete | Workability (Slump) | ASTM C143 | N/A | Fresh state | 1 | 11 |
| Mechanical properties | Compressive strength | B.S. 1881: Part 116 | 100 × 100 × 100 | 7, 14, 28, 56, 90 | 3 | 165 |
| Splitting tensile strength | ASTM C496 | 100 (dia.) × 200 | 7, 14, 28, 56, 90 | 3 | 165 | |
| Volume stability | Drying shrinkage | ASTM C490 | 75 × 75 × 285 | Continuous (up to 90) | 2 | 22 |
| Grand total | 363 |
3. Results and Discussion
3.1. Fresh Properties
Slump test was measured for the workability of the mixes according to (ASTM C143). Slump values for concrete mixes with different percentages of APBs show the effects that different incorporation methods have on workability. This result follows the general trend of most tests, which shows an improvement of slump due to the incorporation of APBs, hence improving the workability of concrete. Figure 3 and Table 9 summary of slump results for different APBs content. It follows that slump varies between 0.5% and 3.5%, the slump values usually rise, reflecting improved workability. The minimum slump of 75 mm is recorded for the control mix without APBs, while the maximum slump value of 92 mm is attained for the mix with 3.5% APBs with pre-soaking. Pre-soaking constantly yields the highest slump values for all APBs contents. This would indicate that pre-soaking enhances the capacity of APBs to absorb more water and, hence, makes the mix more workable. Dry blending results in slump values that are a bit lower compared to those of pre-soaking, probably because of the lack of an initial boost due to hydration in APBs. Surface coating gives intermediary results, which seems to indicate that while coating enhances the particle dispersion, workability is not as good when pre-soaking is used. Starting from 3.5% APBs content onwards, slump values for higher percentages (4.0% and above) fall off appreciably.
This may indicate that at too high APBs content, the mix is denser, possibly compromising workability, or the polymers are taking up a great deal of water with it, reducing the general fluidity. The optimum APBs content for maximum slump is around 3.5%. The optimum level of APBs, resulting in the highest slump values, occurs when the dose reaches around 3.5%. For a higher concentration, however, a lower improvement in workability is achieved.
From a scientific point of view, such phenomenon can be explained by the competitive process of water absorption within the wet matrix. When the concentration does not exceed 3.5%, the already pre-soaked APBs allow the mobility of aggregates through the physical ball-bearing effect. However, for concentrations above 3.5%, the situation results in a local “supersaturation” of water within the polymer structure. Due to this reason, APBs absorb more mixing water, thus raising its plastic viscosity and decreasing slump (Adams et al., 2022; Huang et al., 2022).
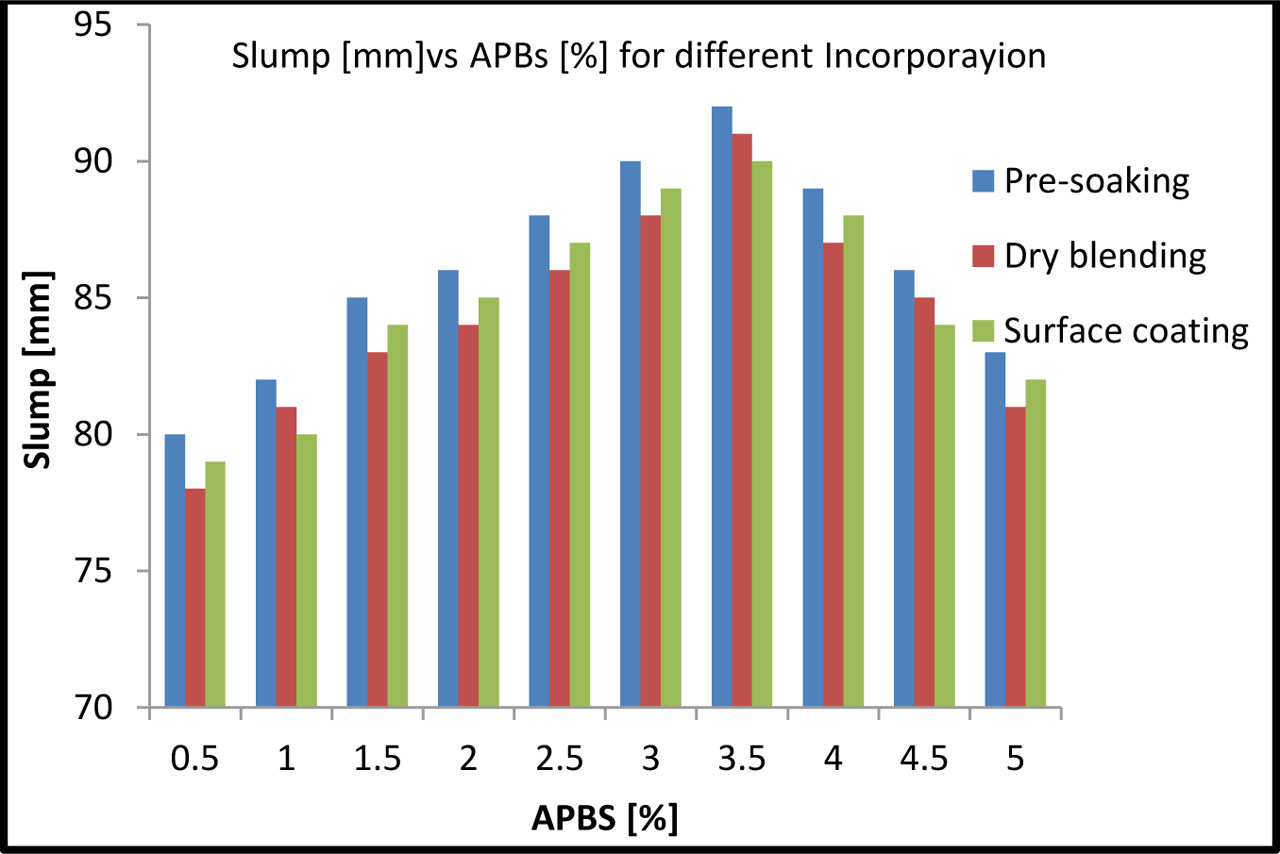
Figure 3:
Slump [mm] vs APBs [%] for different incorporation methods
Table 9:
Result slump [mm] vs APBs [%] for different incorporation methods
| APBs [%] | Incorporation method | Slump [mm] |
|---|---|---|
| Control | - | 75 |
| 0.5 | Pre-soaking | 80 |
| Dry blending | 78 | |
| Surface coating | 79 | |
| 1.0 | Pre-soaking | 82 |
| Dry blending | 81 | |
| Surface coating | 80 | |
| 1.5 | Pre-soaking | 85 |
| Dry blending | 83 | |
| Surface coating | 84 | |
| 2 | Pre-soaking | 86 |
| Dry blending | 84 | |
| Surface coating | 85 | |
| 2.5 | Pre-soaking | 88 |
| Dry blending | 86 | |
| Surface coating | 87 | |
| 3.0 | Pre-soaking | 90 |
| Dry blending | 88 | |
| Surface coating | 89 | |
| 3.5 | Pre-soaking | 92 |
| Dry blending | 91 | |
| Surface coating | 90 | |
| 4.0 | Pre-soaking | 89 |
| Dry blending | 87 | |
| Surface coating | 88 | |
| 4.5 | Pre-soaking | 86 |
| Dry blending | 85 | |
| Surface coating | 84 | |
| 5.0 | Pre-soaking | 83 |
| Dry blending | 81 | |
| Surface coating | 82 |
3.2. Mechanical Properties
3.2.1. Compressive Strength
The test results of the compressive strength of the cubes 100mm concrete specimens according to (B.S1881:part 116:1989), which were tested at the age of (7, 14, 28, 56 and 90 days), are summarized in Figures 4, 5, 6 and Table 10 for various ages for the different methods of APBs content incorporation.
It is evident from the results presented in Figures 4, 5, 6 and Table 10 that, compared to the control mix, the compressive strength increases with the incorporation of APBs. For example, at 90 days, the control mix reaches only 34 MPa, while in mixes with different percentages of APBs, compressive strengths up to 42 MPa are realized, such as 4.0 % APBs with pre-soaking. In case of maximum compressive strength, it attains a value of 42 MPa when there is an incorporation of 4.0 % APBs via pre-soaking method. Scientifically speaking, this drastic improvement can be attributed to the fact that internal curing happens continuously.
Due to the reduction of moisture content from external sources, as well as self-desiccation, the pre-soaked APBs will continue to give out moisture content to the capillary network that surrounds it.
Since there is always continuous moisture available, it will ensure continued hydration of underrated cement grains. This will eventually result in an increase in number of C-S-H gel formations, enhancing porosity structure and ITZ densification (Jensen, 2013; Al-Mulla I. F. et al. 2024; AL-Shammari & AL-Mulla, 2026). Among all APBs contents and curing ages, the pre-soaking method has the highest compressive strength.
This confirms that pre-soaked APBs support the hydration and moisture retention process, thus enabling superior development of strength.
Dry blending and surface coating methods give relatively lower strengths and may indicate that these methods do not favour hydration as effectively as pre-soaking does. Strength values obtained are trending upward with the inclusion of APBs until a certain point is reached; from 3.5% to 4.0%, however, it reflects a particularly good result.
The compressive strength values stabilized beyond 4.0%, which has, in general, indicated nearly diminished gain in strength. The peak compressive strength attains a value of 42 MPa for the 4.0% APBs mix by the method of pre-soaking, the improvement in the compressive strength of up to 42 MPa at dosage levels of 4.0% may be explained by the internal curing effect of APBs.
This is based on the findings by Bentz & Weiss (2011) where the availability of water in internal pools allows for a more expansive hydration process within the cement matrix especially in the ITZ zone.
This leads to a formation of denser matrix structures with reduced micro-cracks. The results are also consistent with the findings of Hashimoto et al. (2006) where the controlled release of water in SAP causes densification of concrete matrix structures.
The internal structure and failure appearance of the specimens containing APBs are illustrated in Figure 7. The compressive strength for all mixes increases with curing time, reflecting the expected maturity behaviour of concrete. In fact, the gain rate is relatively high during the first couple of weeks-that is, between 7 and 14 days. 5.0% APBs content has a relatively low compressive strength, as it is out of the general optimum range of 3.5 – 4.0%.
This may be because higher quantities of polymer could have an adverse effect on general matrix integrity or the distribution of water inside the mixture.
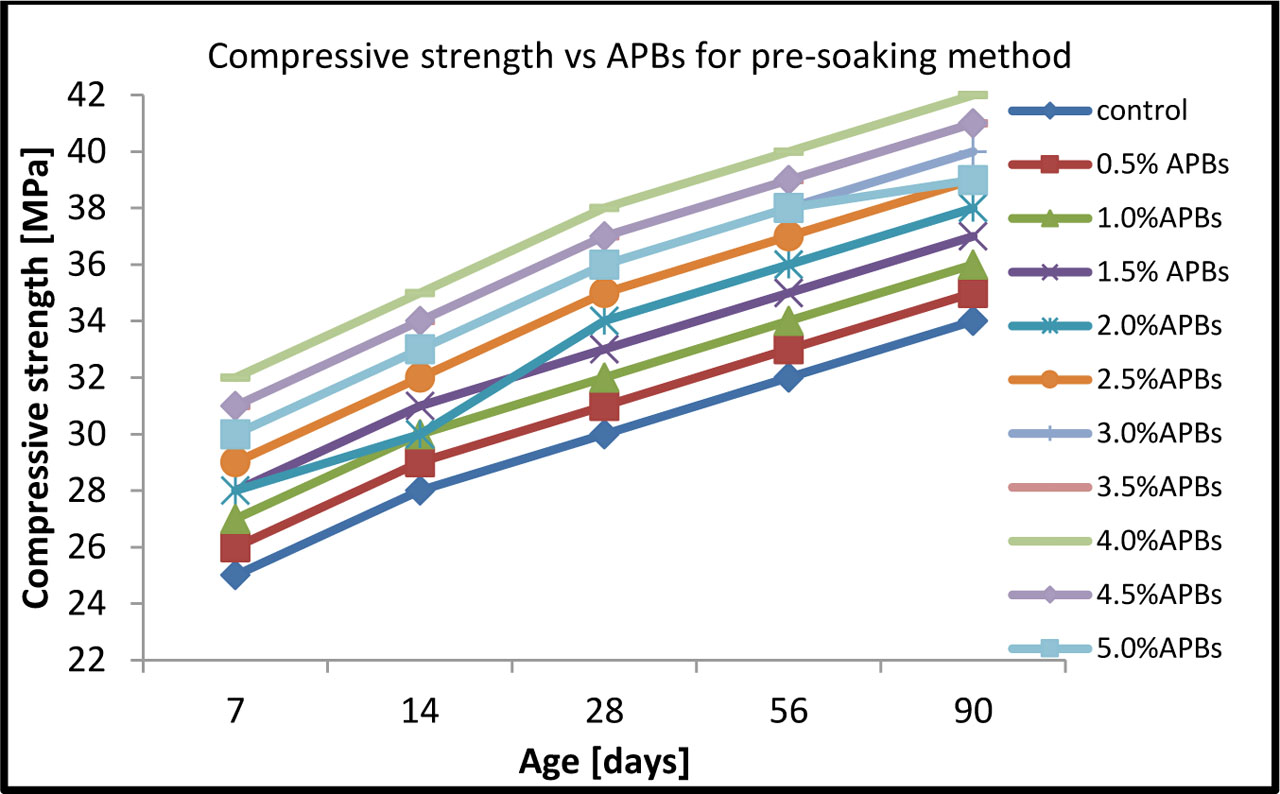
Figure 4:
Compressive strength vs APBs for pre-soaking method
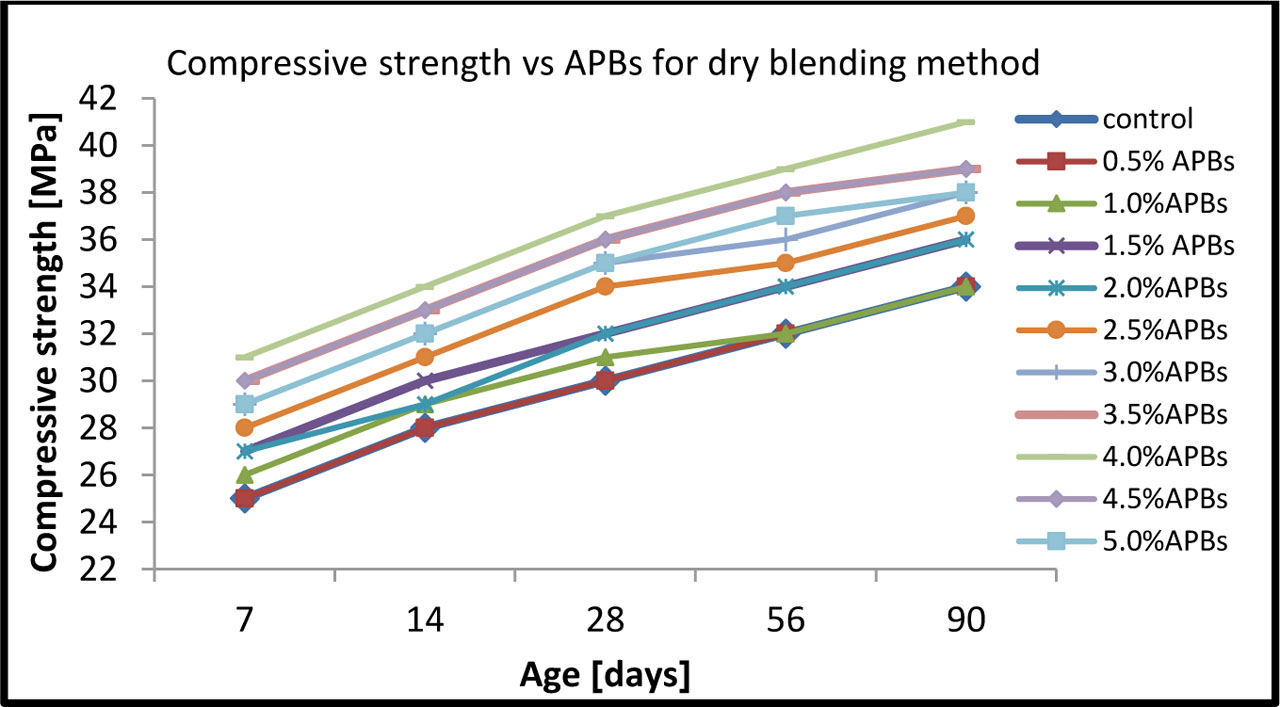
Figure 5:
Compressive strength vs APBs for dry blending method
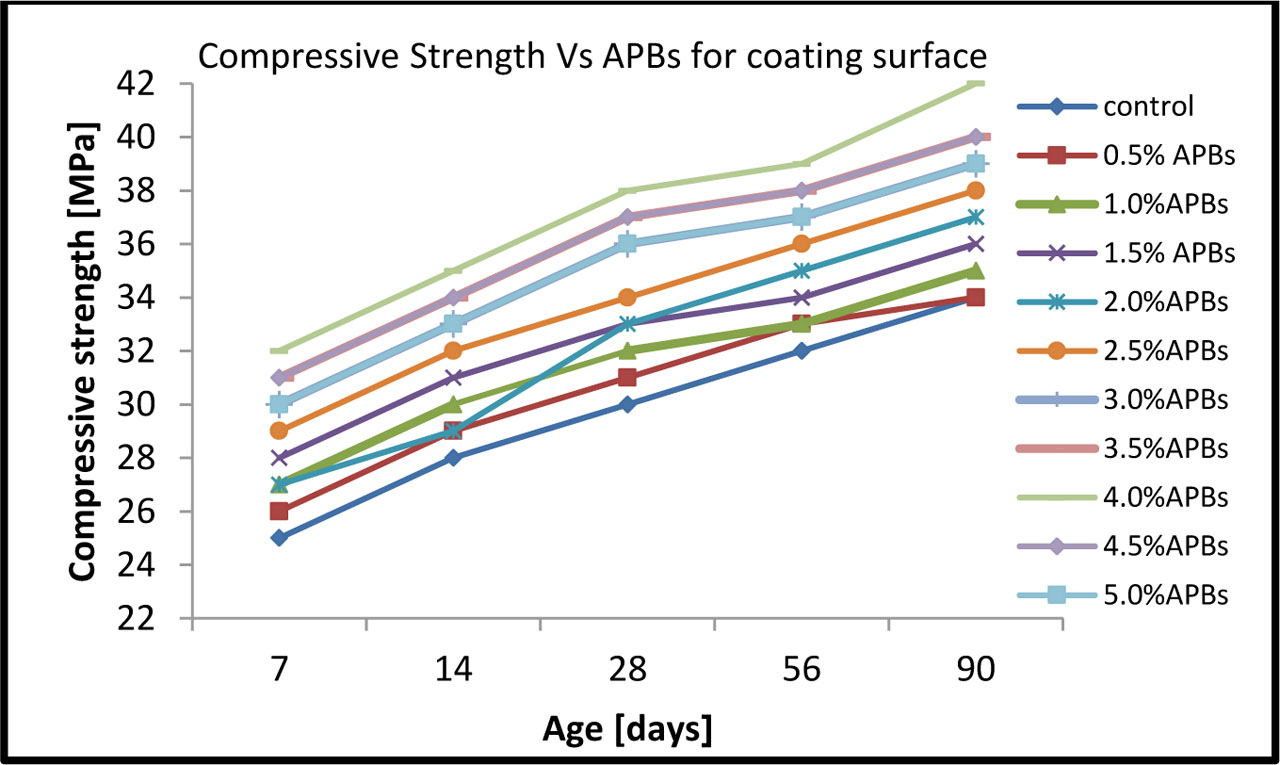
Figure 6:
Compressive strength vs APBs for coating surface method
Table 10:
Results of the compressive strength [MPa] vs APBs content
| APBs content [%] | Incorporation method | 7 days [MPa] | 14 days [MPa] | 28 days [MPa] | 56 days [MPa] | 90 days [MPa] |
|---|---|---|---|---|---|---|
| Control | 25 | 28 | 30 | 32 | 34 | |
| 0.5 | Pre-soaking | 26 | 29 | 31 | 33 | 35 |
| Dry blending | 25 | 28 | 30 | 32 | 34 | |
| Surface coating | 26 | 29 | 31 | 33 | 34 | |
| 1.0 | Pre-soaking | 27 | 30 | 32 | 34 | 36 |
| Dry blending | 26 | 29 | 31 | 32 | 34 | |
| Surface coating | 27 | 30 | 32 | 33 | 35 | |
| 1.5 | Pre-soaking | 28 | 31 | 33 | 35 | 37 |
| Dry blending | 27 | 30 | 32 | 34 | 36 | |
| Surface coating | 28 | 31 | 33 | 34 | 36 | |
| 2.0 | Pre-soaking | 28 | 30 | 34 | 36 | 38 |
| Dry blending | 27 | 29 | 32 | 34 | 36 | |
| Surface coating | 27 | 29 | 33 | 35 | 37 | |
| 2.5 | Pre-soaking | 29 | 32 | 35 | 37 | 39 |
| Dry blending | 28 | 31 | 34 | 35 | 37 | |
| Surface coating | 29 | 32 | 34 | 36 | 38 | |
| 3.0 | Pre-soaking | 30 | 33 | 36 | 38 | 40 |
| Dry blending | 29 | 32 | 35 | 36 | 38 | |
| Surface coating | 30 | 33 | 36 | 37 | 39 | |
| 3.5 | Pre-soaking | 31 | 34 | 37 | 39 | 41 |
| Dry blending | 30 | 33 | 36 | 38 | 39 | |
| Surface coating | 31 | 34 | 37 | 38 | 40 | |
| 4.0 | Pre-soaking | 32 | 35 | 38 | 40 | 42 |
| Dry blending | 31 | 34 | 37 | 39 | 41 | |
| Surface coating | 32 | 35 | 38 | 39 | 42 | |
| 4.5 | Pre-soaking | 31 | 34 | 37 | 39 | 41 |
| Dry blending | 30 | 33 | 36 | 38 | 39 | |
| Surface coating | 31 | 34 | 37 | 38 | 40 | |
| 5.0 | Pre-soaking | 30 | 33 | 36 | 38 | 40 |
| Dry blending | 29 | 32 | 35 | 37 | 38 | |
| Surface coating | 30 | 33 | 36 | 37 | 39 |
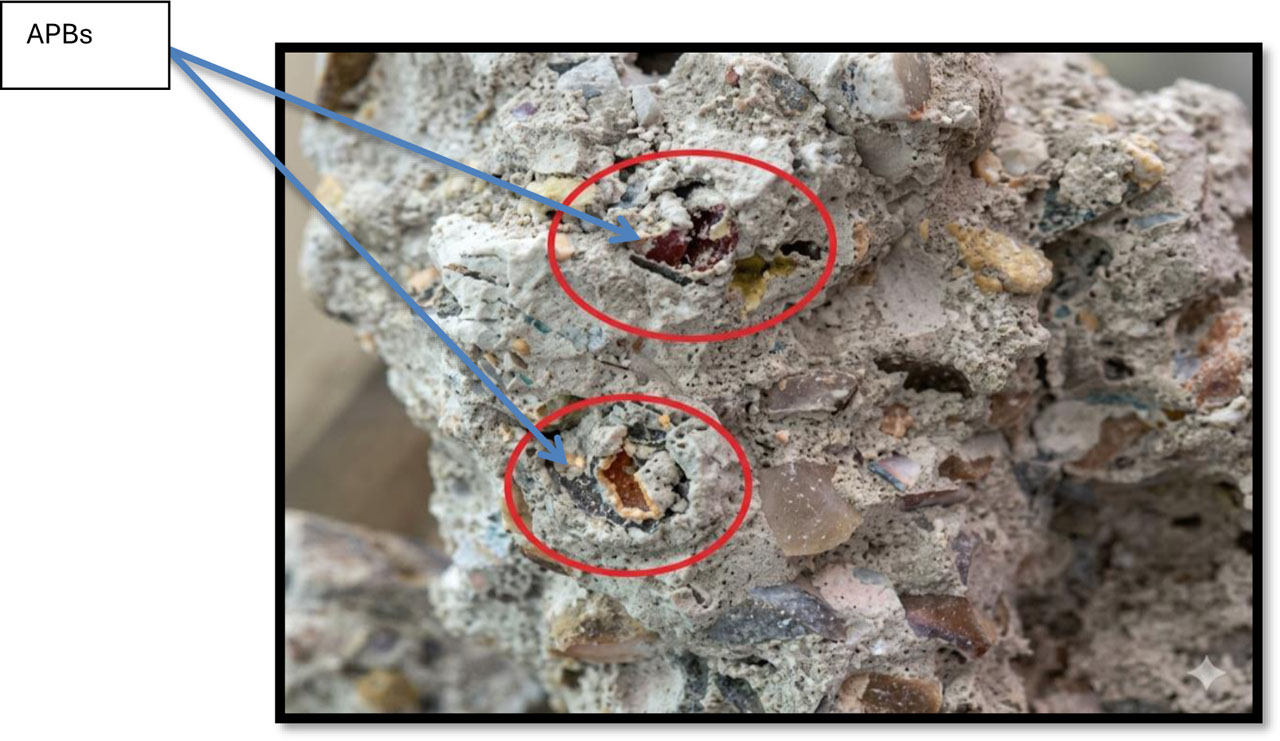
Figure 7:
Absorbent Polymer Balls explosion during test
3.2.2. Splitting Tensile Strength
Tensile strength may be measured directly by tensile tests or indirectly through flexural or split cylinder tests (Carrasquillo et al., 1987). It has been noted that the splitting tensile strength can be as high as 10% of the compressive strength (Dewar, 1964).
The tests were conducted in accordance with (ASTM C496, 2004). In this study, the splitting tensile strength tests were conducted on cylindrical specimens (100 mm diameter and 200 mm height) in accordance with ASTM C496/C496M-04. For each mixture and curing age (7, 14, 28, 56, and 90 days), three replicate cylinders were tested to ensure statistical consistency.
The specimens were placed horizontally between the plywood strips of the testing machine to ensure a uniform distribution of the applied load along the length of the cylinder. A continuous diametral compressive load was applied at a constant rate within the range of 0.7 to 1.4 MPa/min until failure occurred. The maximum load (P) was recorded, and the splitting tensile strength (fct) was calculated using the following equation:
Where:
fct - the splitting tensile strength (MPa),
P - the maximum applied load (N),
L - the length of the specimen (mm),
D - the diameter (mm).
The failure patterns were monitored, and in most cases, a vertical fracture plane passing through the centre of the specimen was observed, indicating a valid tensile failure. Figure 8 illustrates the cylindrical specimen after the completion of the test.
The test results at ages 7, 14, 28, 56, and 90 days are summarized in Table 11 and plotted graphically in Figures 8, 9, and 10. Similar to the compressive strength trends, the inclusion of APBs, particularly via the pre-soaking method, demonstrated a positive impact on tensile capacity, which can be attributed to the enhanced hydration and internal curing effect that strengthens the bond within the cementitious matrix. Figure 11 shows a sample of a tested cylinder splitting.
Table 11:
Results of the splitting tensile strength (MPa) vs APBs content
| APBs content [%] | Incorporation method | 7 days [MPa] | 14 days [MPa] | 28 days [MPa] | 56 days [MPa] | 90 days [MPa] |
|---|---|---|---|---|---|---|
| Control | - | 2.4 | 2.5 | 2.5 | 2.6 | 2.7 |
| 0.5 | Pre-soaking | 2.5 | 2.6 | 2.7 | 2.8 | 2.9 |
| Dry blending | 2.4 | 2.5 | 2.5 | 2.6 | 2.7 | |
| Surface coating | 2.5 | 2.6 | 2.7 | 2.8 | 2.8 | |
| 1.0 | Pre-soaking | 2.6 | 2.7 | 2.8 | 2.9 | 3.0 |
| Dry blending | 2.5 | 2.6 | 2.7 | 2.8 | 2.9 | |
| Surface coating | 2.6 | 2.7 | 2.8 | 2.9 | 3.0 | |
| 1.5 | Pre-soaking | 2.7 | 2.8 | 2.9 | 3.0 | 3.1 |
| Dry blending | 2.6 | 2.7 | 2.8 | 2.9 | 3.0 | |
| Surface coating | 2.7 | 2.8 | 2.9 | 3.0 | 3.1 | |
| 2.0 | Pre-soaking | 3.0 | 3.5 | 4.0 | 4.5 | 4.8 |
| Dry blending | 2.8 | 3.3 | 3.8 | 4.3 | 4.6 | |
| Surface coating | 2.9 | 3.4 | 3.9 | 4.4 | 4.5 | |
| 2.5 | Pre-soaking | 2.8 | 2.9 | 3.0 | 3.1 | 3.2 |
| Dry blending | 2.7 | 2.8 | 2.9 | 3.0 | 3.1 | |
| Surface coating | 2.8 | 2.9 | 3.0 | 3.1 | 3.2 | |
| 3.0 | Pre-soaking | 2.9 | 3.0 | 3.1 | 3.2 | 3.3 |
| Dry blending | 2.8 | 2.9 | 3.0 | 3.1 | 3.2 | |
| Surface coating | 2.9 | 3.0 | 3.1 | 3.2 | 3.4 | |
| 3.5 | Pre-soaking | 3.0 | 3.1 | 3.2 | 3.3 | 3.4 |
| Dry blending | 2.9 | 3.0 | 3.1 | 3.2 | 3.3 | |
| Surface coating | 3.0 | 3.1 | 3.2 | 3.3 | 3.4 | |
| 4.0 | Pre-soaking | 3.1 | 3.2 | 3.3 | 3.4 | 3.5 |
| Dry blending | 3.0 | 3.1 | 3.2 | 3.3 | 3.4 | |
| Surface coating | 3.1 | 3.2 | 3.3 | 3.4 | 3.5 | |
| 4.5 | Pre-soaking | 3.0 | 3.1 | 3.2 | 3.3 | 3.4 |
| Dry blending | 2.9 | 3.0 | 3.1 | 3.2 | 3.3 | |
| Surface coating | 3.0 | 3.1 | 3.2 | 3.3 | 3.4 | |
| 5.0 | Pre-soaking | 2.9 | 3.0 | 3.1 | 3.2 | 3.3 |
| Dry blending | 2.8 | 2.9 | 3.0 | 3.1 | 3.2 | |
| Surface coating | 2.9 | 3.0 | 3.1 | 3.2 | 3.3 |
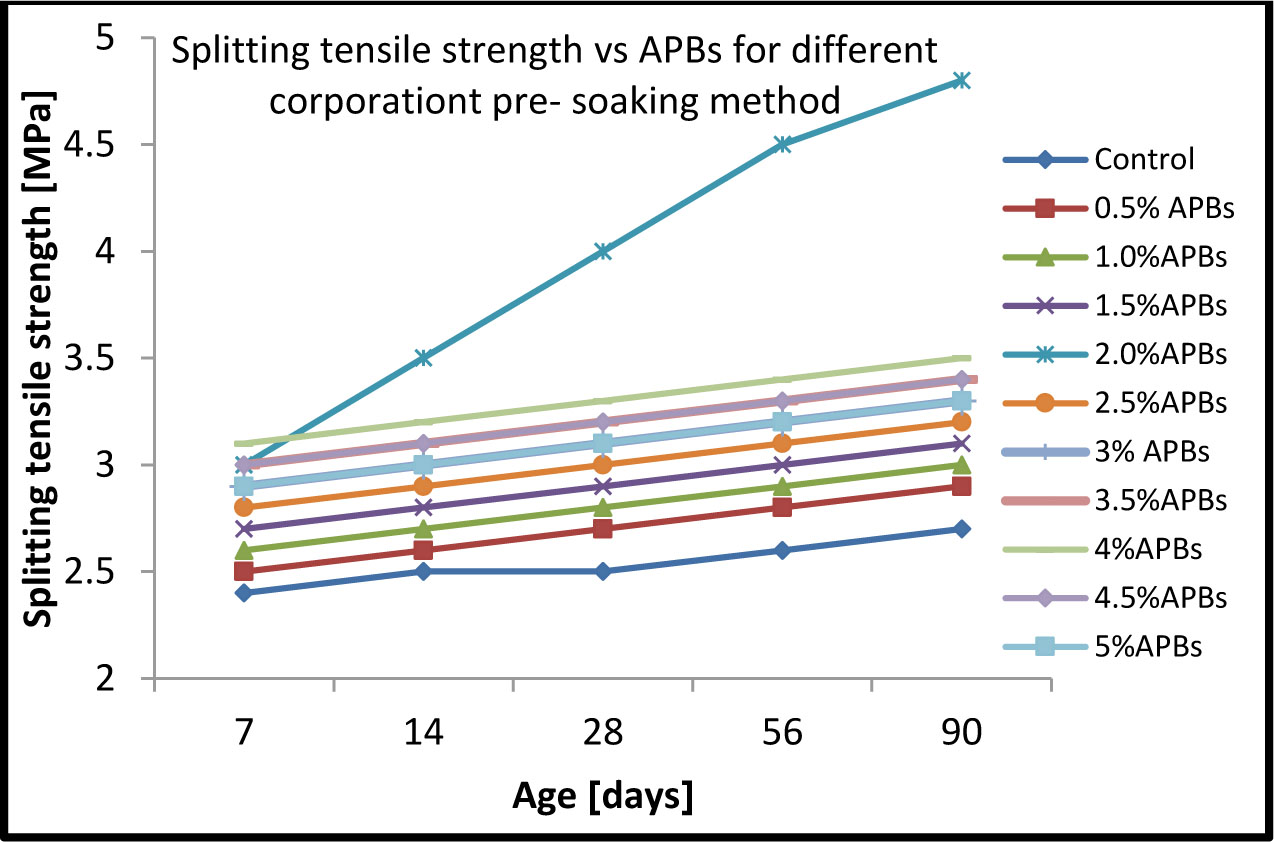
Figure 8:
Splitting tensile strength vs APBs for different corporation (pre-soaking) method
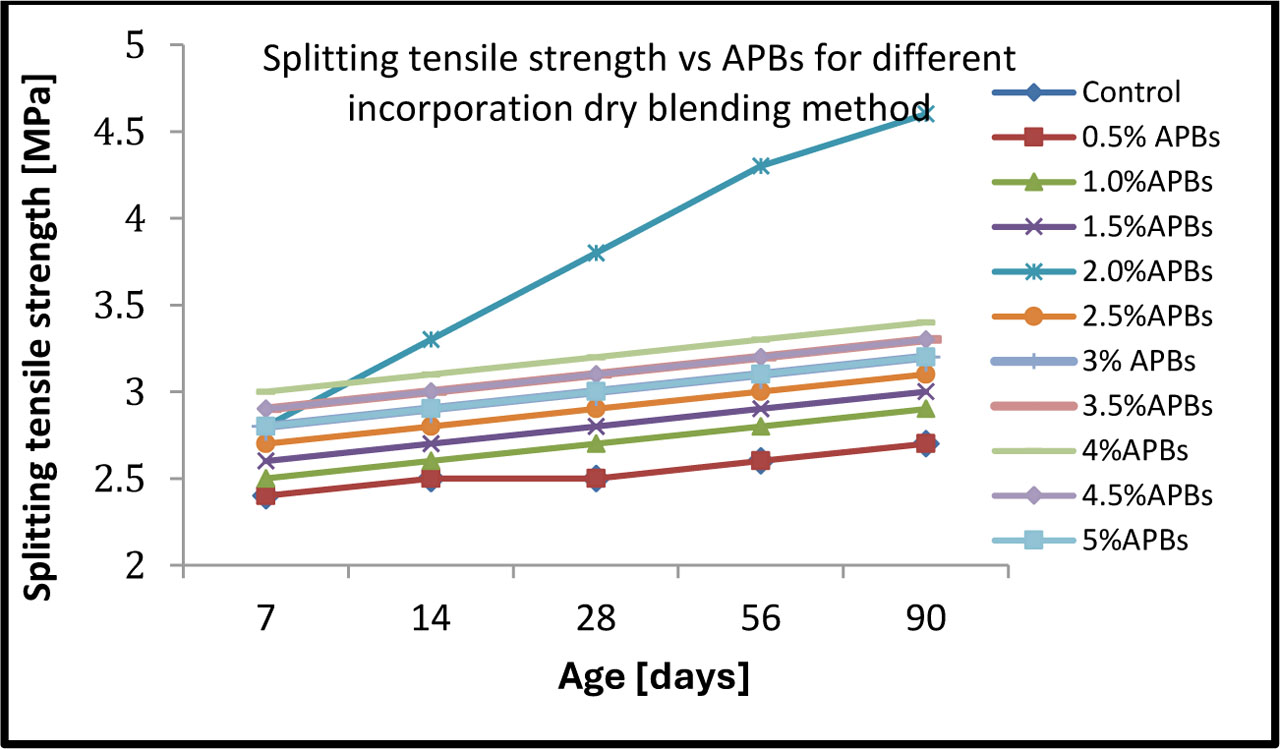
Figure 9:
Splitting tensile strength vs APBs for different incorporation (dry blending) method
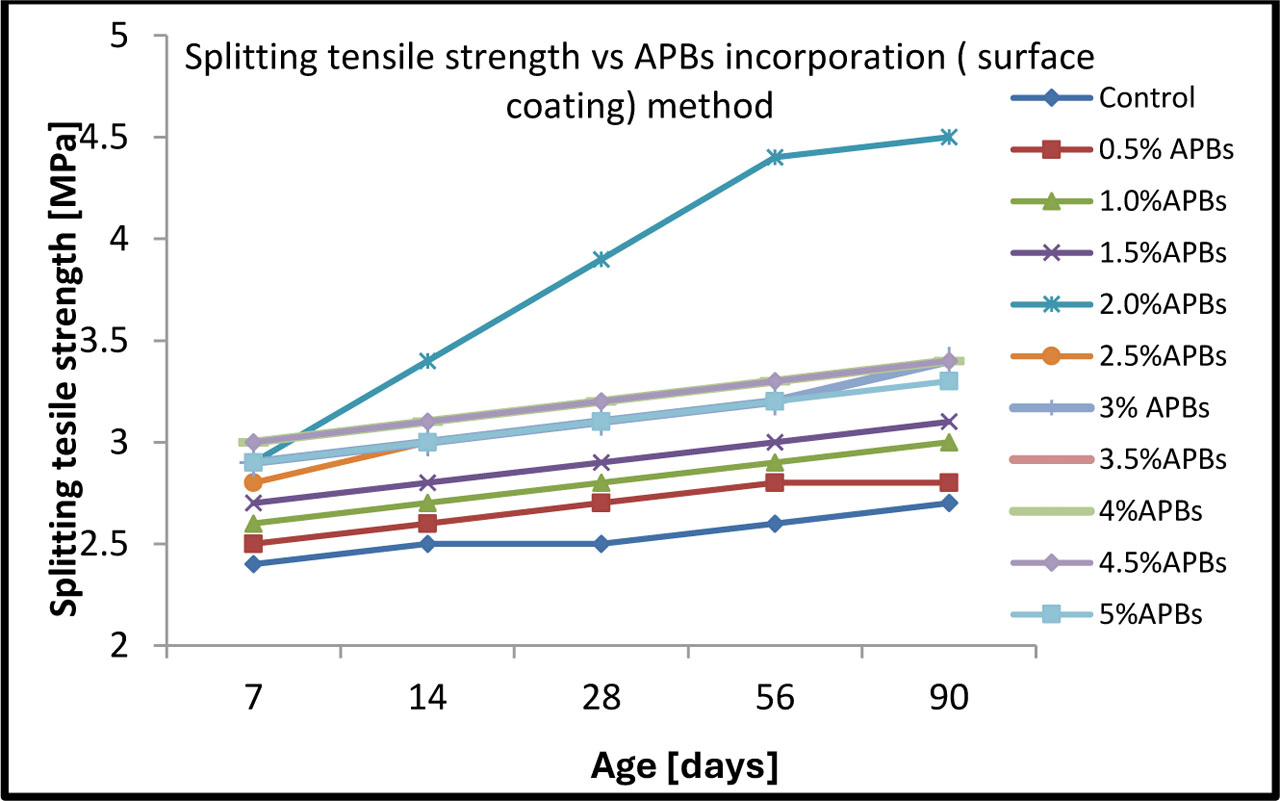
Figure 10:
Splitting tensile strength vs APBs incorporation (surface coating) method
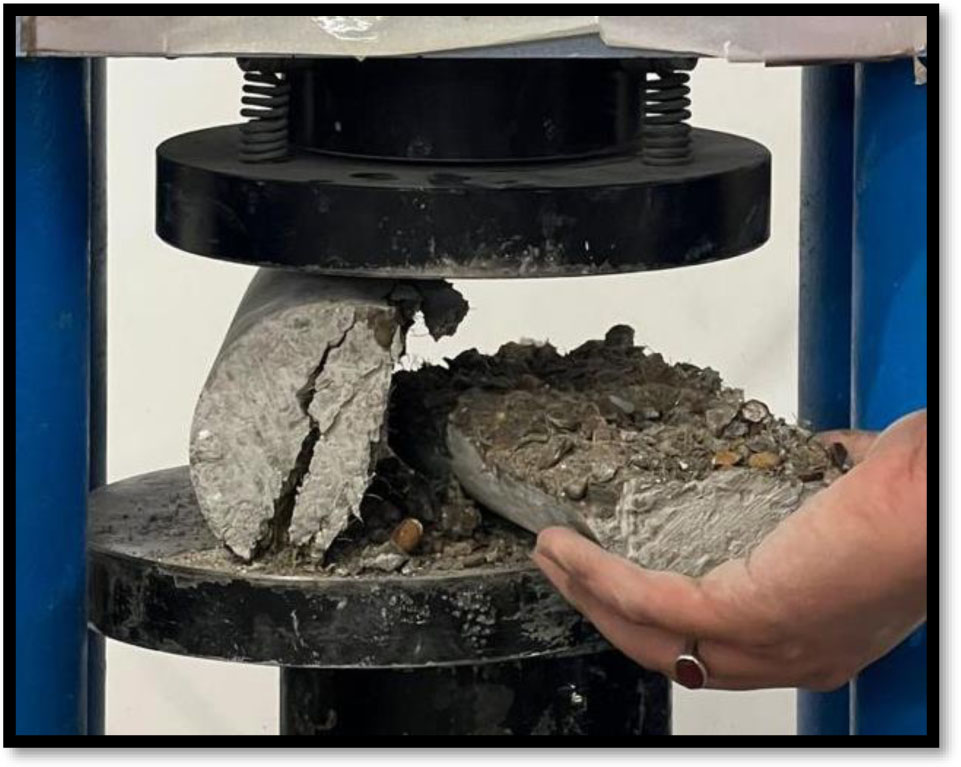
Figure 11:
Sample of tested cylinder splitting
With the addition of APBs, the tensile splitting strength has increased, especially at 2.0% APBs, where significant improvements are observed in all curing ages, indicating that APBs tend to enhance the capability of concrete in resisting tensile forces. Pre-soaking always presents the highest values of tensile strength in all percentages and ages. This is because it optimizes the retention of moisture and supports hydration.
Whereas the soaking method results in higher tensile strength, dry blending and surface coating methods have generally demonstrated lower tensile strengths throughout the specimens made in this study, hence indicating a weaker hydration effect by these two methods. At 2.0%, tensile strength increases more significantly with the soaking method to a maximum of 4.8 MPa at 90 days, which would therefore seem to be an optimum percentage to develop the tensile properties. Greater percentages are 2.5% and 3.0%, which demonstrate losses in tensile strength compared to 2.0%. The tendency may be that while some APBs act to improve workability and hydration, their excess might lead to weaker bonding and/or uneven distribution of moisture.
Tensile strength values in the series are the lowest for the control mix with no APBs, peaking at 2.7 MPa at 90 days, therefore, supplementing the effect brought about by APBs inclusions into the concrete mix. All mixes have shown a gradual increase of the tensile strength with time, which normally is an indication of on-going hydration and strength development as the concrete cures.
3.3. Shrinkage Measurement
The results obtained in this investigation of drying shrinkage up to 90 days of air drying, after 14 days of initial moist curing, for control mix and APBs, at 7, 14, 28, 56 and 90 days of air drying, are useful in providing information about the performance of concrete mixes. The results are presented in Table 12, Figures 12, 13 and 14.
Results indicated that, in the case of the control mix without APBs, shrinkage increased regularly to 630 μ at 90 days and can be considered as a reference for water management. From Table 12 and Figures 12, 13 and 14 when APBs content increases from 0.5% to 5%, the shrinkage tends to decrease for all curing periods but with an accent for 56 and 90 days. However, the pre-soaking method has the least shrinkage, indicating that it retains moisture effectively. Dry blending records relatively higher shrinkage than pre-soaking but is still superior to the control. Wet surface coating gives the highest shrinkage values to imply that this is the least effective in retaining moisture. For 4.0% APBs, the 90-day shrinkage stands at 430 με for pre-soaking, 440 με for dry blending, and 445 με for surface coating, indicating increased benefits resulting from the APBs. In terms of the minimal shrinkage, the APBs content is about 3.5 to 4.0%, especially for pre-soaking, which can balance moisture retention and performance quite well.
Table 12:
Shrinkage vs APBs content
| APBs content [%] | Incorporation method | Shrinkage (µε) at 7 days | Shrinkage (µε) at 14 days | Shrinkage (µε) at 28 days | Shrinkage (µε) at 56 days | Shrinkage (µε) at 90 days |
|---|---|---|---|---|---|---|
| Control | - | 350 | 400 | 500 | 550 | 630 |
| 0.5 | Pre-soaking | 340 | 380 | 480 | 530 | 570 |
| Dry blending | 345 | 390 | 490 | 540 | 590 | |
| Surface coating | 348 | 395 | 495 | 545 | 595 | |
| 1.0 | Pre-soaking | 330 | 360 | 460 | 510 | 550 |
| Dry blending | 335 | 365 | 470 | 520 | 560 | |
| Surface coating | 337 | 368 | 475 | 525 | 565 | |
| 1.5 | Pre-soaking | 320 | 340 | 440 | 490 | 530 |
| Dry blending | 325 | 345 | 450 | 500 | 540 | |
| Surface coating | 327 | 348 | 455 | 505 | 545 | |
| 2.0 | Pre-soaking | 310 | 320 | 420 | 470 | 510 |
| Dry blending | 315 | 325 | 430 | 480 | 500 | |
| Surface coating | 317 | 328 | 435 | 485 | 505 | |
| 2.5 | Pre-soaking | 300 | 310 | 400 | 450 | 490 |
| Dry blending | 305 | 315 | 410 | 460 | 496 | |
| Surface coating | 307 | 318 | 415 | 465 | 500 | |
| 3.0 | Pre-soaking | 290 | 300 | 380 | 430 | 470 |
| Dry blending | 295 | 305 | 390 | 440 | 477 | |
| Surface coating | 297 | 308 | 395 | 445 | 480 | |
| 3.5 | Pre-soaking | 280 | 290 | 360 | 410 | 450 |
| Dry blending | 285 | 295 | 370 | 420 | 455 | |
| Surface coating | 287 | 298 | 375 | 425 | 460 | |
| 4.0 | Pre-soaking | 270 | 280 | 350 | 400 | 430 |
| Dry blending | 275 | 285 | 360 | 410 | 440 | |
| Surface coating | 277 | 288 | 365 | 415 | 445 | |
| 4.5 | Pre-soaking | 280 | 290 | 360 | 410 | 440 |
| Dry blending | 285 | 298 | 378 | 427 | 455 | |
| Surface coating | 287 | 307 | 375 | 432 | 467 | |
| 5.0 | Pre-soaking | 290 | 300 | 370 | 420 | 454 |
| Dry blending | 295 | 305 | 380 | 430 | 461 | |
| Surface coating | 297 | 309 | 385 | 437 | 468 |
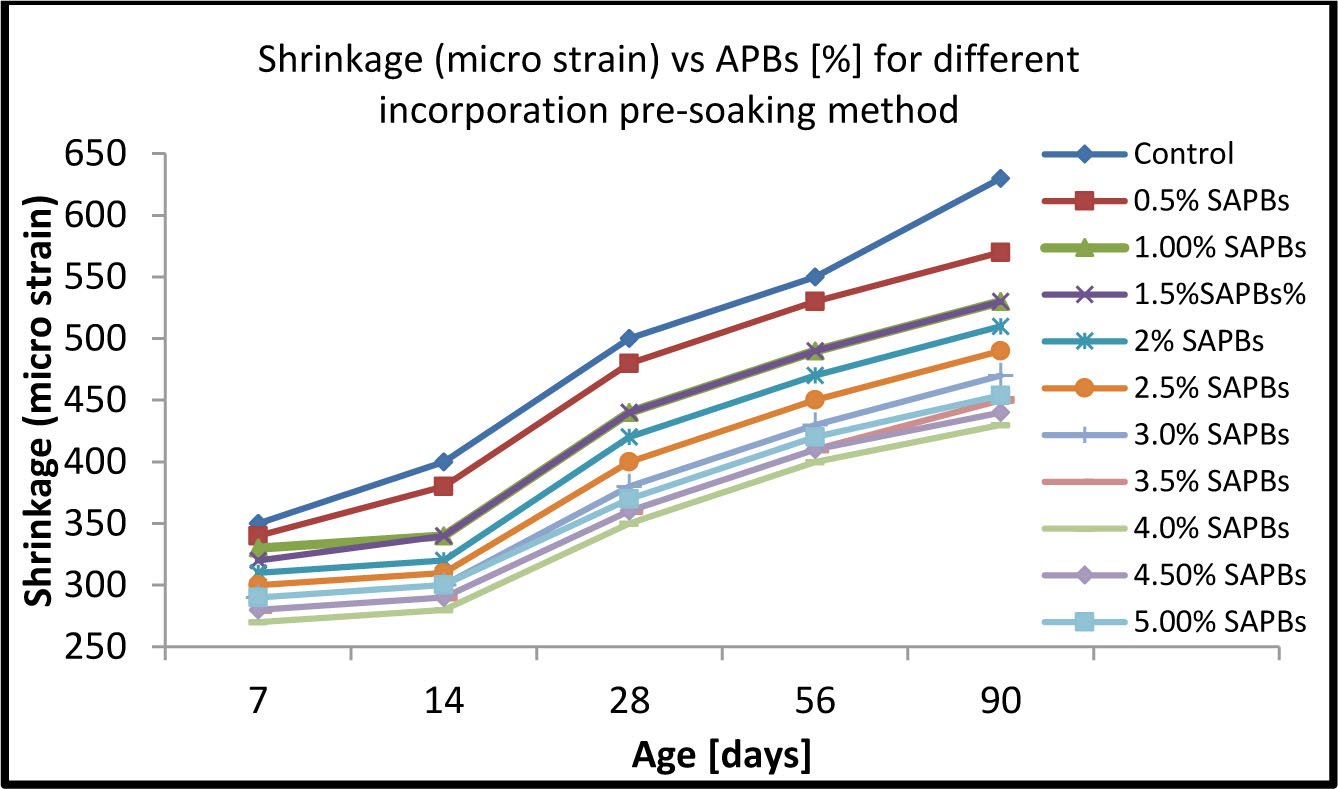
Figure 12:
Shrinkage (micro strain) vs APBs for different incorporation (pre-soaking)
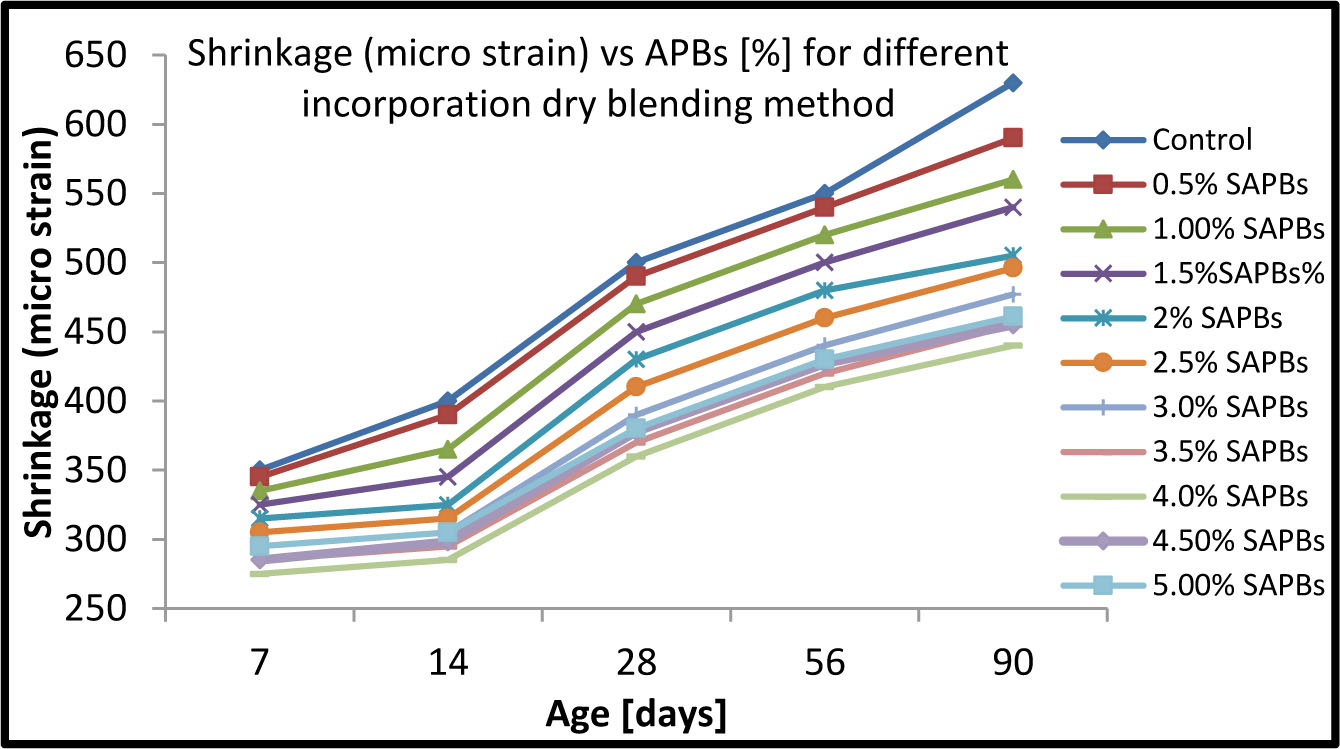
Figure 13:
Shrinkage (micro strain) vs APBs for different incorporation (dry blending) method
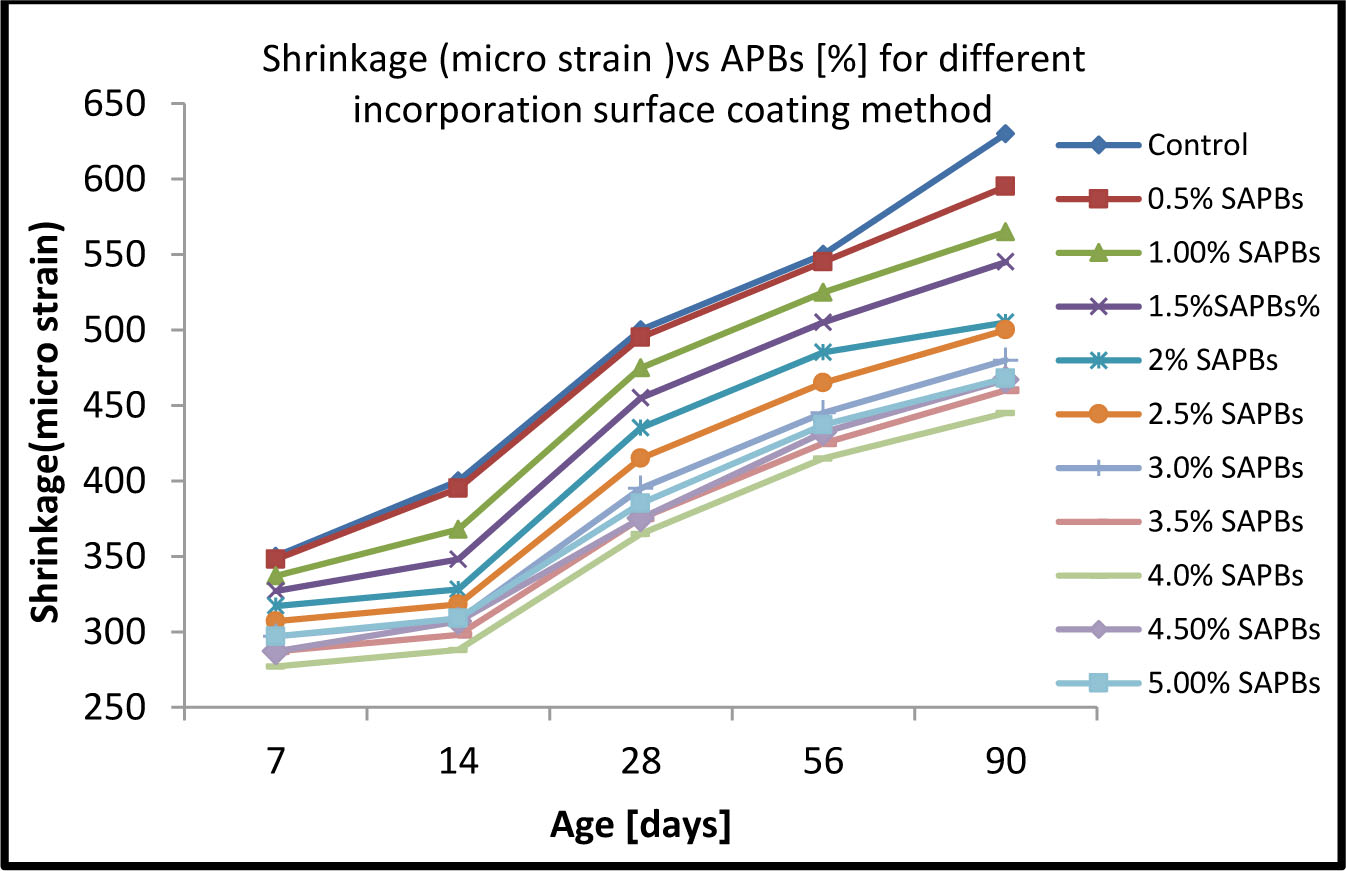
Figure 14:
Shrinkage (micro strain) vs APBs for different incorporation surface coating method conclusion
Based on the investigation into the performance characteristics of concrete incorporated with Absorbent Polymer Balls (APB), the following additional conclusions are drawn:
Enhancement of Workability and Rheological Properties: The incorporation of APB significantly optimizes the rheological behaviour of the concrete. Furthermore, the study identifies pre-soaking as the optimal methodology for integrating this material into the concrete matrix to achieve maximum performance.
This is the only way to create the internal sources of polymeric ball bearings, thereby providing additional mobility. The optimal values of slumps occurred when 3.5% APB was added. Further increase of concentration led to the development of supersaturation and, therefore, the increase in plastic viscosity of the matrix. Optimization of the Parameters of Compressive Strength: From the analysis of the obtained results, it could be seen that the optimal number of APBs was equal to 4.0% (compression strength equal to 42 MPa).
This could be attributed to the constant presence of moisture, allowing for hydration of undervalued cement particles and obtaining the dense ITZ. Peak Splitting Tensile Stress: It could be noted that peak splitting tensile stress appeared when APB concentration amounted to 2.0%. Thus, while positive effect on bonding strength due to internal curing occurs, increasing the concentration can disrupt the integrity of the matrix.