

Table 1:
Chemical composition of the SKK490 steel coupons (Nguyen & Le Trung, 2025)
| Composition | SKK490 bare steel |
|---|---|
| Carbon [C] | 0.17% |
| Silicon [Si] | 0.30% |
| Manganese [Mn] | 1.40% |
| Phosphorus [P] | 0.035% |
| Sulfur [S] | 0.03% |
| Niobium [Nb] | - |
| Vanadium [V] | - |
| Titanium [Ti] | - |
Table 2:
Initial mechanical properties of the SKK490 steel coupons (Nguyen & Le Trung, 2025)
| Property | SKK490 bare steel |
|---|---|
| Yield strength [MPa] | 325 |
| Tensile strength [MPa] | 510 |
| Elongation [%] | 17 |
Table 3:
Geometry and exposed area of the SKK490 steel coupons (Nguyen & Le Trung, 2025)
| Sample | Length, l [cm] | Cross-section, a [cm] | Cross-section, b [cm] | Immersed length [cm] | Exposed area [cm2] |
|---|---|---|---|---|---|
| Bare steel SKK490 | 20 | 1.6 | 2 | 10 | 75.2 |
Table 4:
Composition of the simulated seawater solution (Nguyen & Le Trung, 2025)
| Component | Amount / Volume | Unit |
|---|---|---|
| Deionized water | 1 | L |
| NaCl | 32.48 | g |
| NaHCO3 | 11.87 | g |
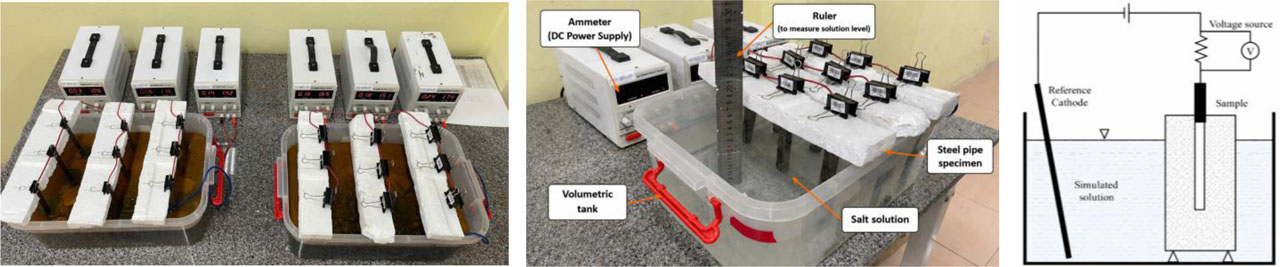
Figure 1:
Accelerated corrosion test setup for the SKK490 steel coupons under simulated Vietnamese marine conditions (Nguyen & Le Trung, 2025)
Table 5:
Laboratory test duration and adopted equivalent exposure duration (Nguyen & Le Trung, 2025)
| Test stage | Test duration [hours] | Equivalent exposure duration [years] | Number of specimens | Applied current [mA] |
|---|---|---|---|---|
| 01 | 72 | 4.5 | 30 | 160 |
| 02 | 120 | 7.5 | 30 | |
| 03 | 240 | 15 | 30 | |
| 04 | 320 | 20 | 3 | |
| 05 | 480 | 30 | 3 | |
| 06 | 800 | 50 | 3 | |
| 07 | 1200 | 75 | 3 | |
| 08 | 1600 | 100 | 3 |
Table 6:
Statistical summary of pre-processed corrosion data
| Years | Trimmed Mean [%] | SD [%] | COV [%] | 95% CI Lower [%] | 95% CI Upper [%] |
|---|---|---|---|---|---|
| 4.5 | 3.78 | 0.26 | 6.9933 | 3.68 | 3.88 |
| 7.5 | 5.77 | 0.39 | 6.7339 | 5.62 | 5.91 |
| 15 | 14.18 | 1.04 | 7.3116 | 13.80 | 14.57 |
| 20 | 15.72 | 0.17 | 1.1055 | 15.29 | 16.15 |
| 30 | 22.21 | 0.17 | 0.7745 | 21.78 | 22.64 |
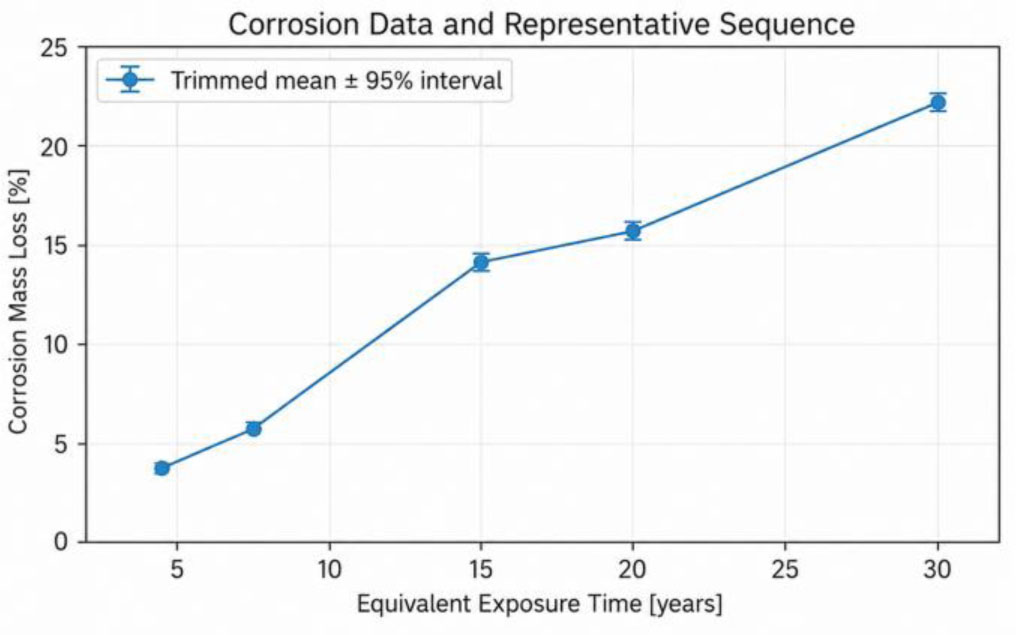
Figure 2:
Experimental corrosion mass-loss ratio with trimmed mean and 95% confidence interval
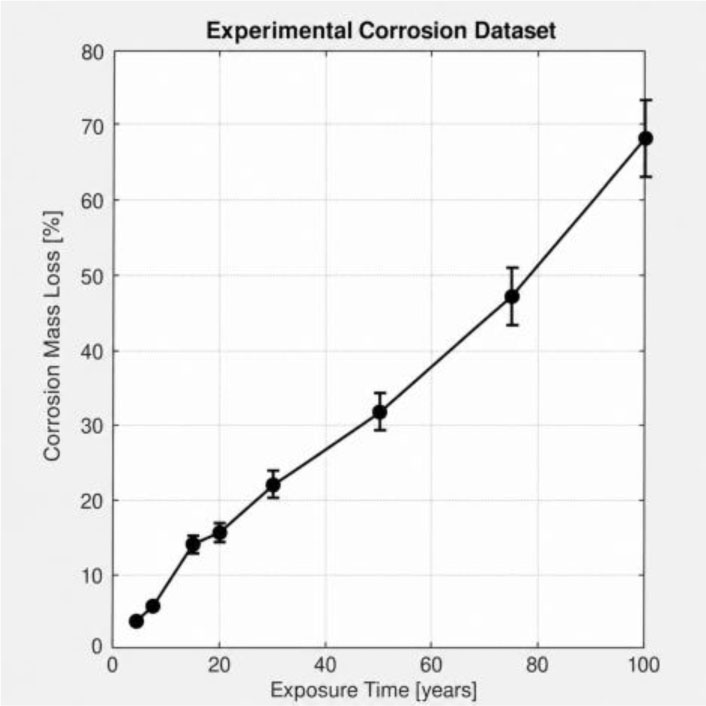
Figure 3:
Experimental corrosion mass-loss ratio over equivalent exposure time
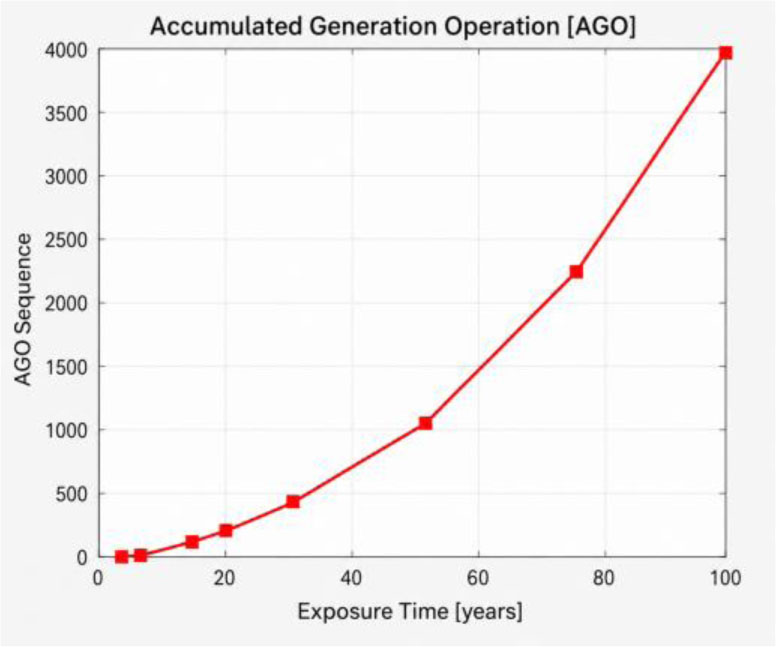
Figure 4:
Smoothed corrosion sequence generated by the non-equidistant accumulated generation operation (AGO)
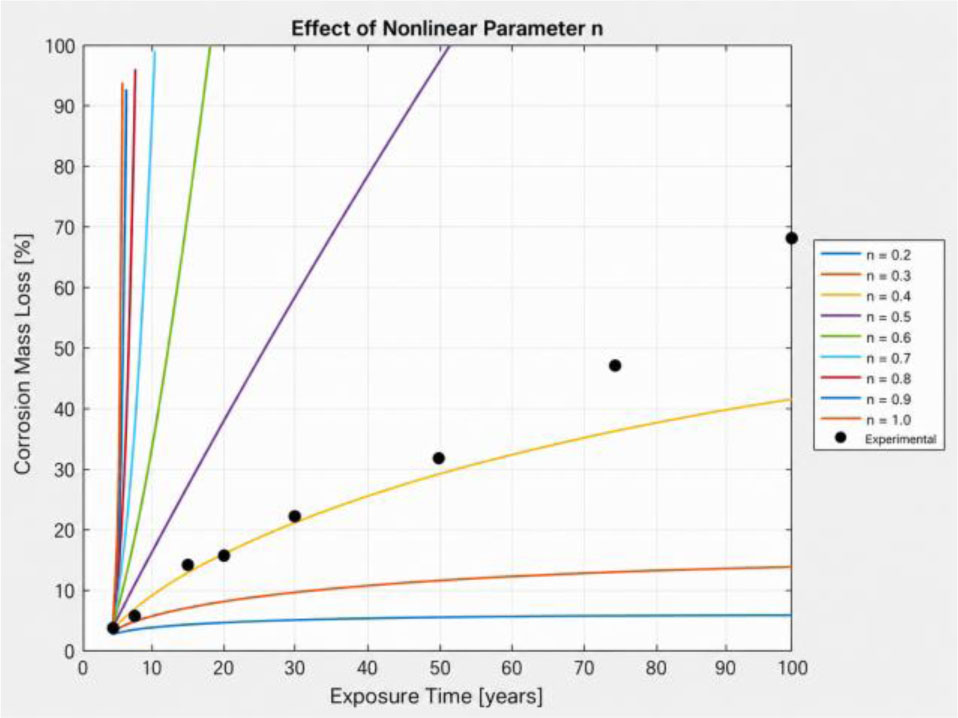
Figure 5:
Sensitivity of the long-term NGBM response to prescribed values of the nonlinear exponent n; the optimized value n = 0.419 is reported separately and used for forecasting
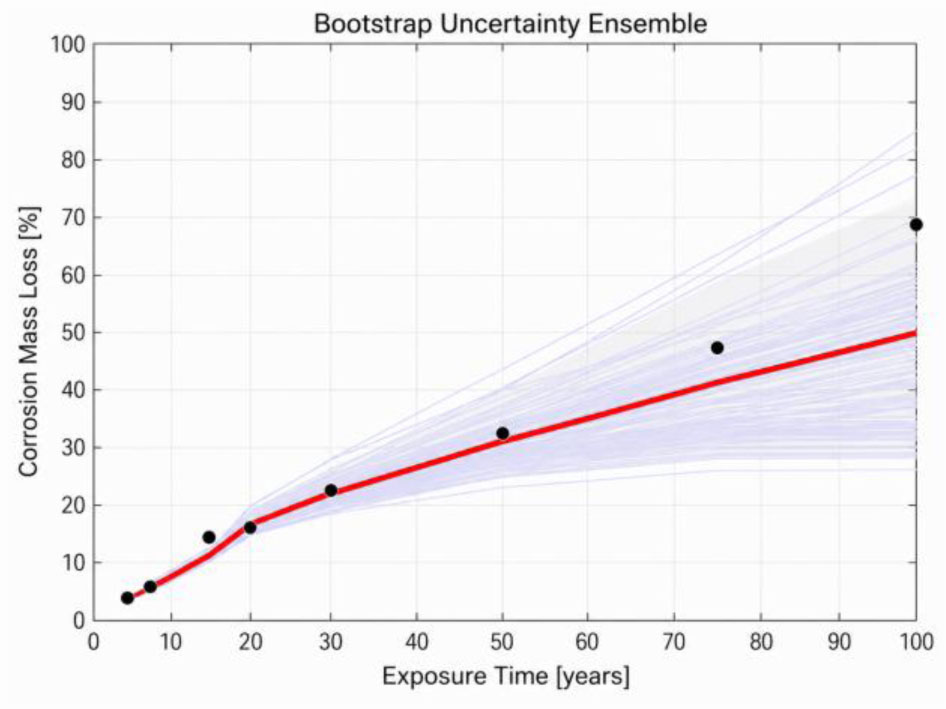
Figure 6:
Parametric-bootstrap ensemble, mean NGBM forecast, and 95% uncertainty interval
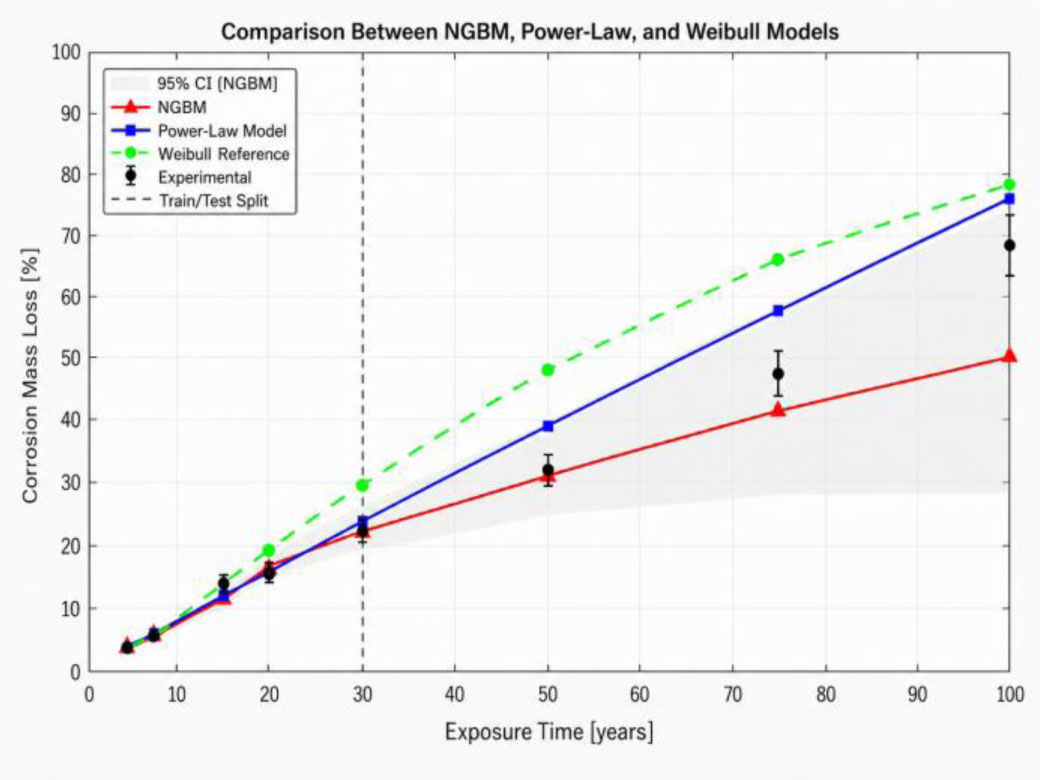
Figure 7:
Comparison of the NGBM forecast and 95% uncertainty interval with experimental observations and the calibrated Weibull and power-law benchmarks