

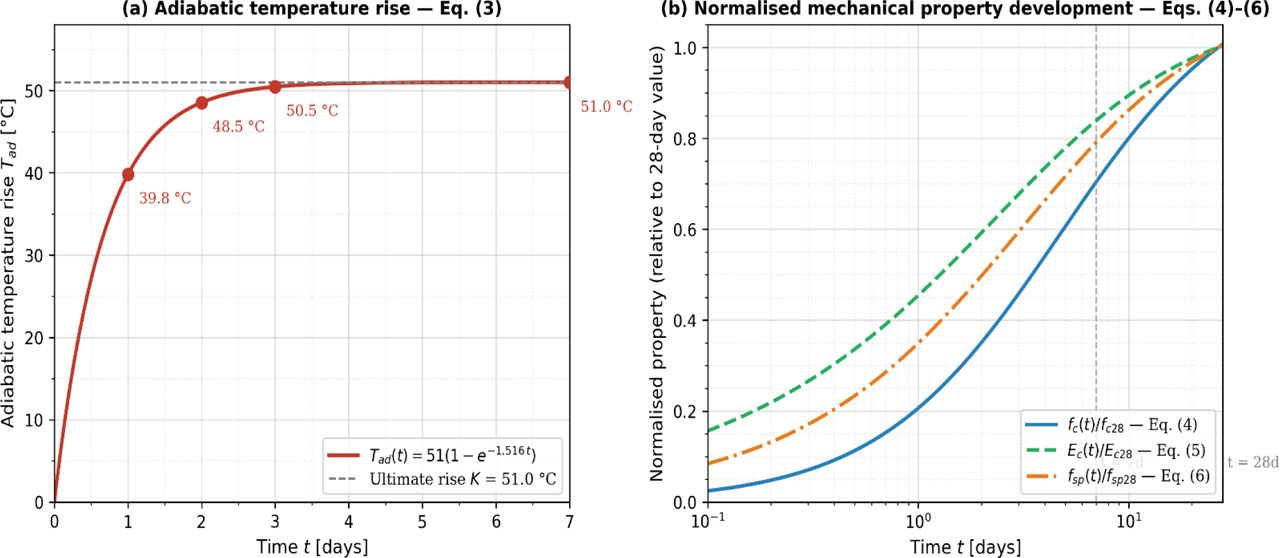
Figure 1:
Time-dependent baseline relationships for the hydration-heat and mechanical-property models (K = 51 °C, α = 1.516 day−1, a = 4.0, b = 0.85, fc′(28) = 35 MPa). Values in (b) are normalised to the 28-day reference
Table 1:
Thermal crack-index acceptance bands (Korea Concrete Institute, 2009)
| Criterion | Thermal crack index Icr |
|---|---|
| To prevent cracks | Icr ≥ 1.5 |
| To limit cracks | 1.2 ≤ Icr < 1.5 |
| To allow cracks | 0.7 ≤ Icr < 1.2 |
Table 2:
Baseline material and thermal properties
| Property | Concrete | Sub-soil | Unit |
|---|---|---|---|
| Specific heat c | 0.25 | 0.20 | kcal·kgf(−1) °C(−1) |
| Density ρ | 2400 | 1800 | kgf·m(−3) |
| Thermal conductivity k | 2.3 | 1.7 | kcal·m(−1)·hr(−1)·°C(−1) |
| Convection (atm / steel form) | 4.5 / 4.5 (vary) | 12 | kcal·m(−2)·hr(−1)·°C(−1) |
| Ambient Tamb | 27.1 (vary) | – | °C |
| Casting T0 | 15 (vary) | – | °C |
| 28-day compressive strength f′c(28) | 350 | – | kgf·cm(−2) |
| Strength gain (a, b) | 4.0, 0.85 | – | – |
| 28-day modulus Ec | 2.99×10⁵ | 1.0×10⁻⁵ | kgf·cm(−2) |
| Thermal expansion αth | 1.0×10⁻5 | 1.0×10⁻5 | °C(−1) |
| Poisson’s ratio | 0.18 | 0.20 | – |
| Cement content | 350 | – | kg·m(−3) |
| Heat source (K; α) | 51.0; 1.516 | – | °C; day(−1) |
Table 3:
Surface-modulus parametric matrix (G-series)
| ID | Geometry | Dimensions [m] | Acool [m2] | V [m3] | M [m−1] |
|---|---|---|---|---|---|
| G1 | Small cube | 2 × 2 × 2 | 20 | 8 | 2.50 |
| G2 | Reference cube | 3 × 3 × 3 | 45 | 27 | 1.67 |
| G3 | Large cube | 4 × 4 × 4 | 80 | 64 | 1.25 |
| G4 | Very large cube | 5 × 5 × 5 | 125 | 125 | 1.00 |
| G5 | Thin slab | 6 × 6 × 1.5 | 72 | 54 | 1.33 |
| G6 | Thick slab | 6 × 6 × 3 | 108 | 108 | 1.00 |
| G7 | Column | 2 × 2 × 6 | 52 | 24 | 2.17 |
| G8 | Pile cap | 4 × 4 × 2 | 48 | 32 | 1.50 |
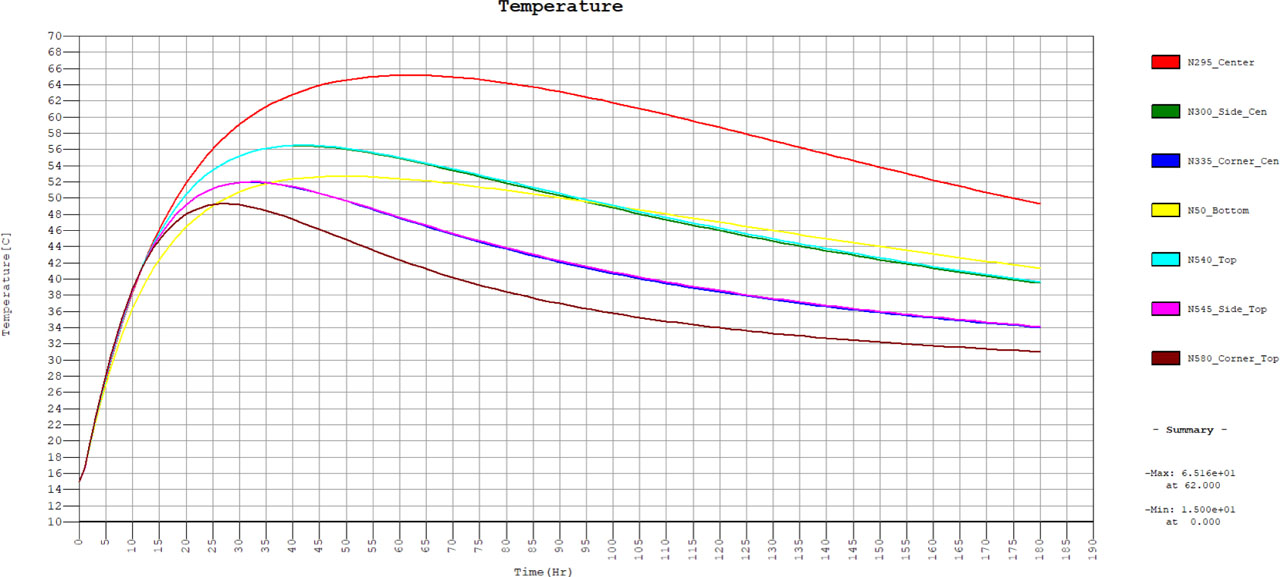
Figure 2:
Temperature–time histories at the seven monitoring nodes for the baseline case
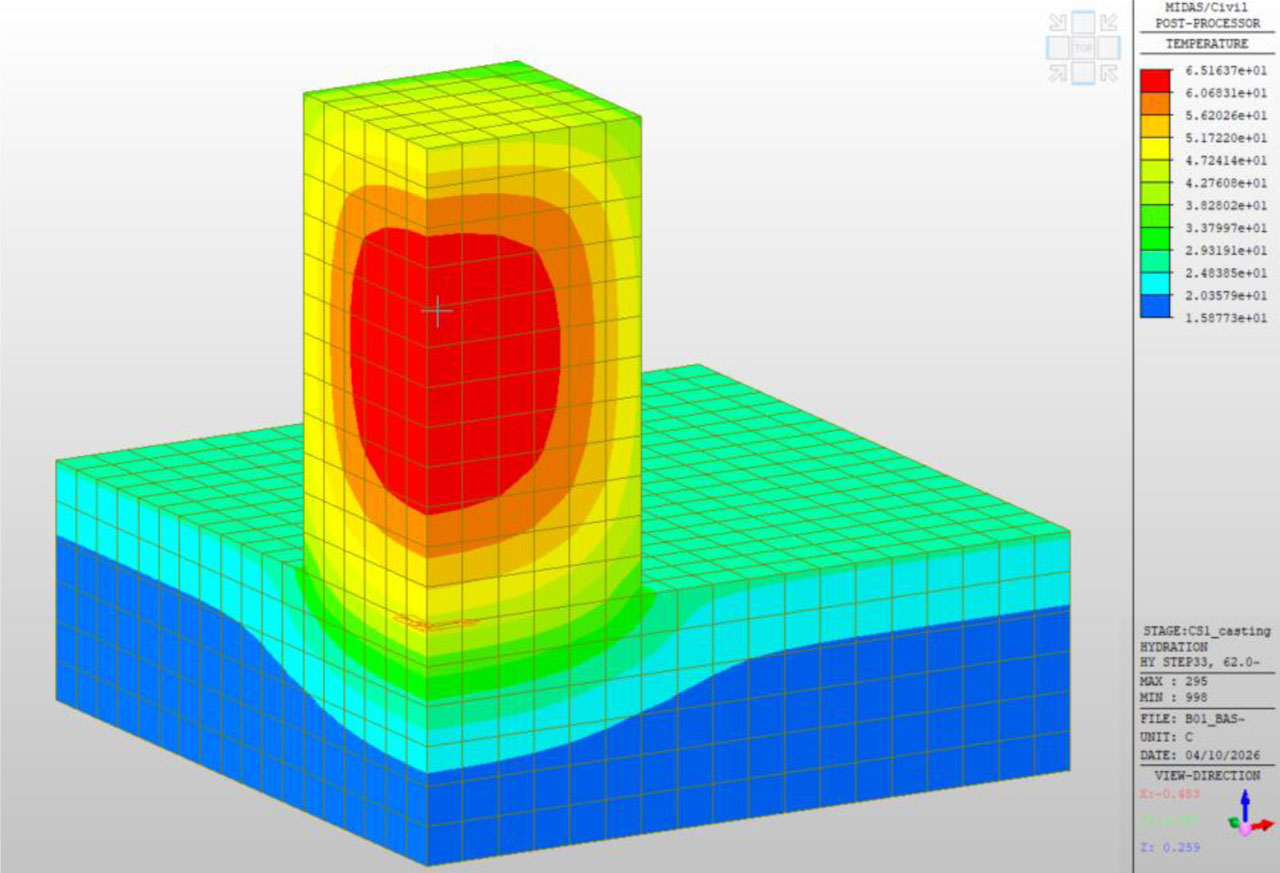
Figure 3:
Temperature contour of the quarter model at the instant of peak core temperature
Table 4:
Effect of time step Δt
| Case | Δt [h] | Steps | Tmax,core [°C] | ΔTcs,max [°C] | Icr,min | CPU [min] |
|---|---|---|---|---|---|---|
| A1 | 0.5 | 360 | 63.93 | 25.22 | 1.688 | 10 |
| A2 | 1.0 | 180 | 63.84 | 24.21 | 1.735 | 07 |
| A3 | 2.0 (ref) | 90 | 65.16 | 26.17 | 1.793 | 03 |
| A4 | 4.0 | 45 | 67.73 | 27.97 | 1.519 | 02 |
| A5 | 8.0 | 23 | 72.69 | 31.41 | 1.284 | 01 |
Table 5:
Effect of element size
| Case | Edge [mm] | Grid cells | Tmax,core [°C] | ΔTcs,max [°C] | Icr,min | CPU [min] |
|---|---|---|---|---|---|---|
| B1 | 500 | 3 | 64.77 | 17.50 | 1.464 | 01 |
| B2 | 375 | 4 | 64.98 | 21.89 | 1.456 | 01 |
| B3 | 300 | 5 | 65.10 | 24.49 | 1.543 | 02 |
| B4 | 250 (ref) | 6 | 65.16 | 26.17 | 1.793 | 03 |
| B5 | 187.5 | 8 | 65.23 | 28.23 | 1.470 | 08 |
| B6 | 150 | 10 | 65.27 | 29.38 | 1.396 | 17 |
Table 6:
Effect of convection coefficient hc.
| Case | hc [kcal m−2 h−1 °C−1] | Tmax,core [°C] | ΔTcs,max [°C] | Icr,min |
|---|---|---|---|---|
| C1 | 1.5 | 65.64 | 16.55 | 2.471 |
| C2 | 4.5 (ref) | 65.16 | 26.17 | 1.793 |
| C3 | 8.0 | 64.87 | 29.49 | 1.612 |
| C4 | 12.0 | 64.68 | 31.03 | 1.537 |
Table 7:
Effect of placement temperature T0
| Case | T0 [°C] | Tmax,core [°C] | ΔTcs,max [°C] | Icr,min |
|---|---|---|---|---|
| D1 | 15 (ref) | 65.16 | 26.17 | 1.793 |
| D2 | 20 | 69.92 | 29.57 | 1.647 |
| D3 | 25 | 74.69 | 32.97 | 1.518 |
| D4 | 30 | 79.48 | 36.39 | 1.404 |
| D5 | 35 | 84.28 | 39.80 | 1.302 |
Table 8:
Effect of ambient temperature Tamb
| Case | Tamb [°C] | Tmax,core [°C] | ΔTcs,max [°C] | Icr,min |
|---|---|---|---|---|
| E1 | 20 | 64.82 | 31.02 | 1.614 |
| E2 | 25 | 65.06 | 27.60 | 1.737 |
| E3 | 27.1 (ref) | 65.16 | 26.17 | 1.793 |
| E4 | 30 | 65.31 | 24.20 | 1.876 |
| E5 | 35 | 65.59 | 20.84 | 2.033 |
Table 9:
Effect of cement content (F-series)
| Case | C [kg m−3] | K [°C] | Tmax,core [°C] | ΔTcs,max [°C] | Icr,min |
|---|---|---|---|---|---|
| F1 | 300 | 43.7 | 58.07 | 21.26 | 2.16 |
| F2 | 350 (ref) | 51.0 | 65.16 | 26.17 | 1.79 |
| F3 | 400 | 58.3 | 72.25 | 31.10 | 1.53 |
| F4 | 450 | 65.6 | 79.35 | 36.02 | 1.33 |
Table 10:
Effect of surface modulus M on the thermal response (G-series)
| Case | Geometry | M [m−1] | Tmax,core [°C] | ΔTcs,max [°C] | Icr,min | t(Tmax,core) [h] | Pcr,JCI [%] |
|---|---|---|---|---|---|---|---|
| G1 | 2 × 2 × 2 cube | 2.50 | 61.54 | 21.15 | 2.103 | 44 | 2.8 |
| G2 | 3 × 3 × 3 cube (ref) | 1.67 | 65.16 | 26.17 | 1.79 | 62 | 5.6 |
| G3 | 4 × 4 × 4 cube | 1.25 | 66.52 | 30.92 | 1.295 | 78 | 20.6 |
| G4 | 5 × 5 × 5 cube | 1.00 | 67.01 | 33.67 | 1.095 | 94 | 37.7 |
| G5 | 6 × 6 × 1.5 slab | 1.33 | 58.82 | 13.56 | 4.523 | 45 | 0.1 |
| G6 | 6 × 6 × 3 slab | 1.00 | 64.40 | 23.00 | 2.553 | 71 | 1.2 |
| G7 | 2 × 2 × 6 column | 2.17 | 61.82 | 24.69 | 1.743 | 50 | 6.2 |
| G8 | 4 × 4 × 2 pile cap | 1.50 | 63.23 | 23.41 | 1.778 | 54 | 5.7 |
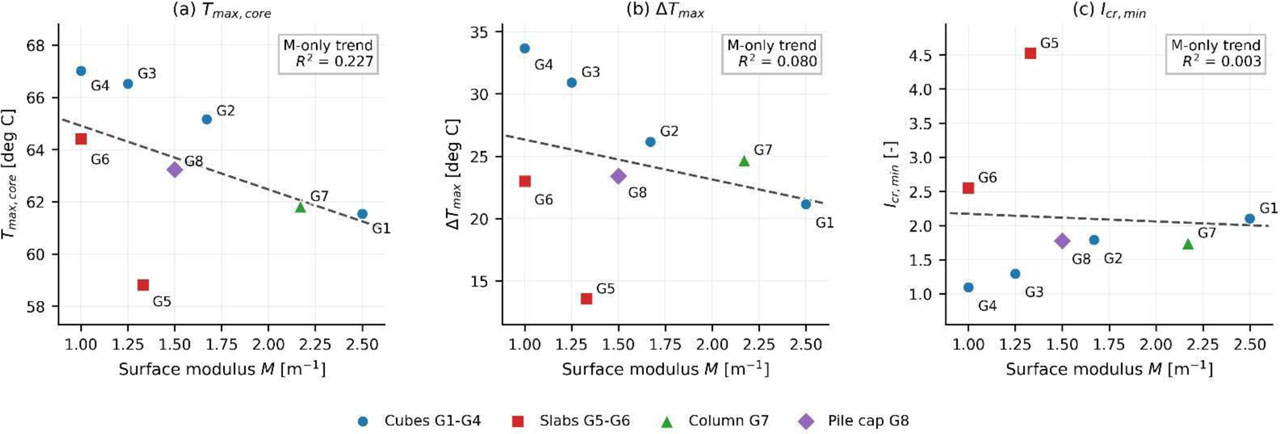
Figure 4:
Diagnostic M-only plots for (a) Tmax,core, (b) ΔTcs,max, and (c) Icr,min
Table 11:
Regression-model performance for geometry descriptors and crack-index response
| Response | Candidate model | Predictors | R2 | RMSE | MAE | LOOCV RMSE | Interpretation |
|---|---|---|---|---|---|---|---|
| Tmax,core | M-only | M | 0.227 | 2.276 °C | 1.623 °C | 2.742 °C | Weak mixed-geometry descriptor |
| Tmax,core | Quadratic heat-flow model | dmin, dmin2 | 0.940 | 0.633 °C | 0.449 °C | 1.108 °C | Strong screening relation |
| ΔTcs,max | M-only | M | 0.080 | 5.494 °C | 4.195 °C | 6.824 °C | Not adequate |
| ΔTcs,max | Two-variable model | M, dmin | 0.869 | 2.073 °C | 1.710 °C | 3.788 °C | Acceptable for screening |
| Icr,min | M-only | M | 0.003 | 1.002 | 0.717 | 1.220 | Invalid for crack-index prediction |
| Icr,min | Inverse gradient model | ΔTcs,max | 0.951 | 0.223 | 0.177 | 0.302 | Best performing and physically interpretable |
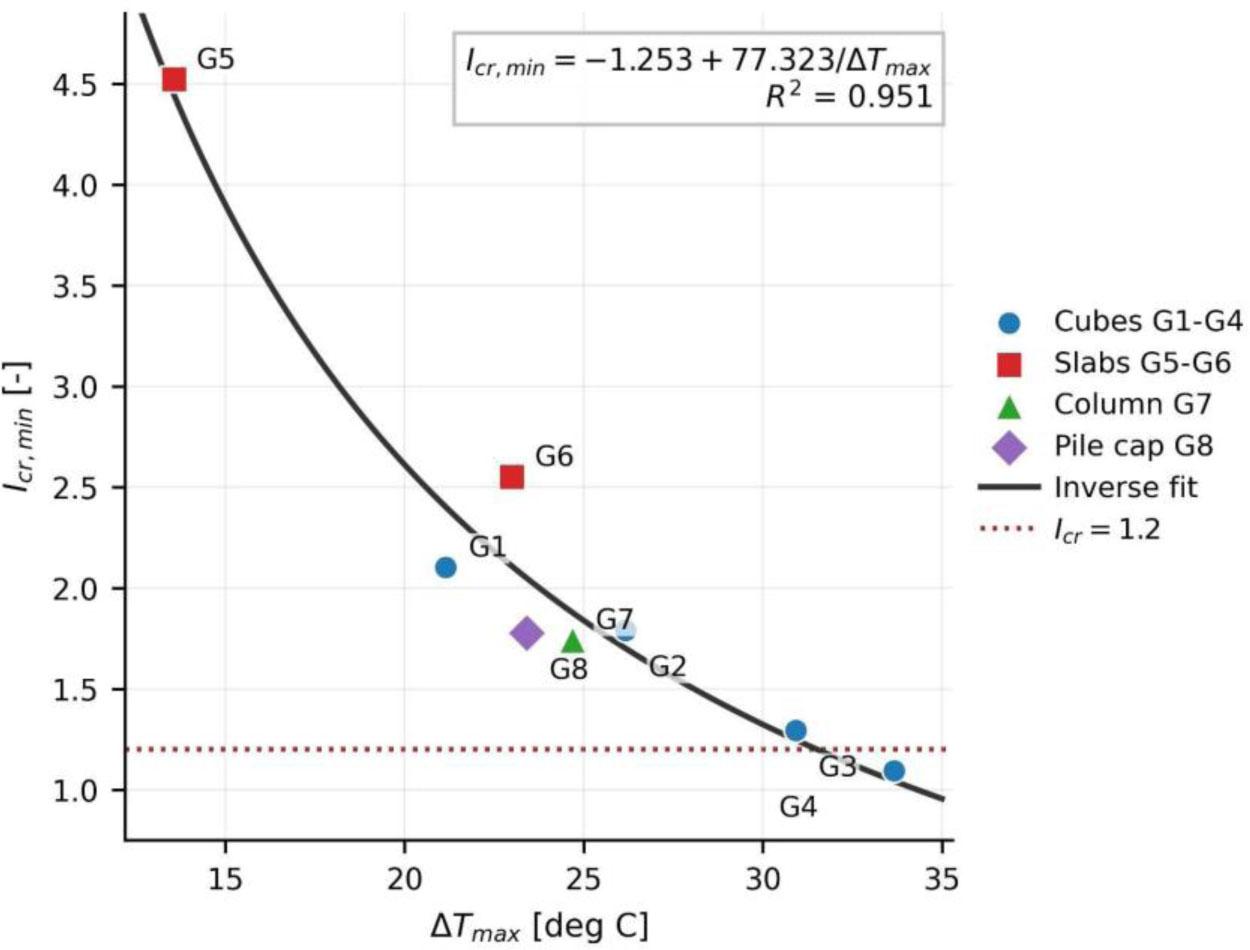
Figure 5:
Relationship between Icr,min and ΔTcs,max for the updated G-series
Table 12:
Comparative sensitivity of peak core temperature Tmax,core and minimum crack index Icr,min
| Parameter | Range studied | ΔTmax,core [°C] | ΔIcr,min | Dominant response |
|---|---|---|---|---|
| Time step Δt | 0.5–8 h | 8.79 | 0.51 | Numerical stability |
| Element size | 150–500 mm | 0.50 | 0.39 | Numerical resolution |
| Convection coefficient hc | 1.5–12 kcal m−2 h−1 °C−1 | 0.96 | 0.93 | Icr,min |
| Placement temperature T0 | 15–35 °C | 19.14 | 0.49 | Tmax,core |
| Ambient temperature Tamb | 20–35 °C | 0.77 | 0.42 | Icr,min |
| Cement content C | 300–450 kg m−3 | 21.28 | 0.83 | Tmax,core |
| Surface modulus M (cubic subset G1–G4) | 1.00–2.50 m−1 | 5.47 | 1.008 | Icr,min |
| Geometry/surface-modulus portfolio (full G-series) | 1.00–2.50 m−1 | 8.19 | 3.428 | Shape-dependent Icr,min response |