

1. Introduction
Large concrete pours used in wind-turbine-generator (WTG) bases, raft footings, bridge pile caps, and dam blocks dissipate a considerable amount of cement-hydration heat during the first three to seven days after casting. The resulting non-uniform cooling drives two competing failure mechanisms: surface cracking induced by the core-to-surface temperature gradient, and the long-term risk of delayed ettringite formation (DEF), which emerges when the peak core temperature Tmax exceeds approximately 70–80 °C (ACI PRC 207.2R-07, 2007; Bamforth, 2018; Chiniforush et al., 2022; Grabowski & Mitew-Czajewska, 2021). Both modes degrade durability and may, in tropical climates, be amplified by high ambient temperatures and intense solar radiation (V. M. Le et al., 2025; Tasri, 2025).
Current design codes confront this hazard through two distinct but complementary strategies. The first strategy is based on deterministic threshold dimensions: ACI 301 (ACI 301-20, 2020) designates any element whose smallest dimension is at least 1.2 m (4 ft) as mass concrete, and the Vietnamese standard TCVN 14334:2025 (TCVN 14334:2025, 2025), classifies slabs thicker than 0.8 m and other elements thicker than 1.2 m as mass concrete. The second approach uses probabilistic frameworks that translate a thermal crack index Icr into a thermal-cracking probability through a reliability (R–S) formulation (Ahorro & Estores, 2024; Ashizawa et al., 2019). An alternative, geometry-independent classification employs the surface modulus M, defined as the ratio of environment-exposed cooling area to total concrete volume. CIRIA C766 (Flaga & Klemczak, 2016) and the related contributions of Klemczak and co-workers (Klemczak & Smolana, 2024; Klemczak & Żmij, 2021) consider structures with M < 2 m−1 as mass concrete and link this threshold to a self-heating temperature rise greater than 20 °C. Despite its conceptual generality, the surface modulus has received limited attention in parametric finite-element studies of thermal cracking, and its quantitative correlation with the stress-based crack index across different member shapes has not been systematically established.
Three-dimensional finite-element (FE) simulation of hydration-heat evolution, including implementations available in MIDAS Civil, has become a standard tool for evaluating early-age thermal stress in mass concrete (Ali & Urgessa, 2012; J. K. Kim et al., 2001; Riding et al., 2006; Schindler & Folliard, 2005). The available literature documents a broad range of mitigation strategies for early-age thermal cracking, spanning both material design and construction practice. Recent review studies classify these strategies into two main groups: (i) material optimisation through low-heat Portland cement (LHC), supplementary cementitious materials (SCMs) such as fly ash and ground-granulated blast-furnace slag (GGBFS), chemical admixtures, and phase-change materials (PCMs) that attenuate the hydration-heat peak through latent-heat exchange; and (ii) construction-process measures including appropriate placement sequencing, embedded cooling-pipe systems (Bobko et al., 2014; T. C. Nguyen et al., 2019), staged or layered placement (V. M. Le et al., 2025), and surface insulation or other curing strategies that reduce near-surface cooling rates (Abdel-Raheem et al., 2018; Grabowski & Mitew-Czajewska, 2021; H. H. Le et al., 2020; Zhang et al., 2024). Tasri (Tasri, 2025) presented an explicit volume-to-exposed-surface (V/A) parametric study and proposed a non-linear relation between the maximum allowable casting temperature and V/A, showing that thinner sections (low V/A, or equivalently high M) can tolerate higher placement temperatures while maintaining ΔTcore-surface ≤ 20 °C. Le, Vu, and Ho (V. M. Le et al., 2025) extended the A/V framework to two-layer continuously cast foundations through a 57-case FE design of experiments and reported that different shapes sharing the same A/V produced comparable Tmax and ΔTmax over the range A/V = 0.84–2.8 m−1. Klemczak and Smolana (Klemczak & Smolana, 2024) further proposed an enhanced massivity index mcor that augments M with binder-, content-, and temperature-correction factors. Probabilistic crack-index studies based on Monte Carlo simulation (Ahorro & Estores, 2024) complement deterministic FE analysis by quantifying cracking likelihood for a given combination of mixture and curing conditions.
These contributions collectively indicate that the surface modulus is a useful preliminary geometric descriptor; however, they do not demonstrate that it is, by itself, a sufficient predictor of stress-based cracking risk. Two issues therefore remain unresolved. First, A/V or M correlations established within a single shape family may not remain valid for mixed geometries when the response variable changes from Tmax to Icr,min. Second, the qualitative CIRIA C766 criterion M < 2 m−1 is not a design-level crack-control criterion and should not be interpreted as such without explicit linkage to thermal-stress analysis and crack-index evaluation.
The present study addresses these gaps by examining whether massivity descriptors can be extended beyond preliminary screening. Specifically, the objectives are: (i) to quantify Tmax, the maximum core-to-surface temperature differential ΔTcs,max, and Icr,min through a multi-geometry parametric campaign; (ii) to estimate a condition-specific local Mcrit for the cubic subset only; (iii) to evaluate response-specific regression forms based on M, the minimum heat-flow dimension dmin, and ΔTcs,max; and (iv) to demonstrate why non-cubic members require shape-aware three-dimensional thermal-stress assessment rather than a single M-only acceptance rule.
The remainder of this paper is organised as follows. Section 2 presents the heat-transfer formulation, convective boundary conditions, age-dependent constitutive models for concrete, and the surface-modulus definition adopted in the parametric campaign. Section 3 reports the numerical results, including the baseline thermal response, the time-step and mesh-convergence studies, the parametric sensitivity analyses, the shape-aware regressions of Eqs. (12)–(14), and the additional Icr,min–ΔTcs,max relationship. Section 4 discusses the overall sensitivity ranking, the practical engineering implications for mass-concrete construction under tropical conditions, and the limitations of the present study. Section 5 summarises the principal conclusions, including the distinction between M-only screening and response-specific regression models.
2. Methodology
2.1. Transient Heat Conduction with Internal Heat Source
The three-dimensional transient temperature field T(x, y, z, t) in hydrating concrete is governed by the Fourier heat equation with an internal heat-generation term (Carslaw & Jaeger, 1959):
Where:ρ - the density (kg m−3),
c - the specific heat (J kg−1 K−1),
k - the thermal conductivity (W m−1 K−1),
q - the volumetric heat-generation rate.
The volumetric heat q is obtained from an adiabatic temperature-rise curve of exponential form, widely adopted in MIDAS Civil and in the Korean Concrete Institute specifications (Korea Concrete Institute, 2009):
Where:K - the ultimate adiabatic temperature rise (°C),
α - the reaction-rate coefficient (day−1),
t - the time (day).
In this study, K = 51.0 °C and α = 1.516 day−1 are adopted, consistent with a mix containing 350 kg m−3 of ordinary Portland cement (OPC). For the cement-content sensitivity study (Section 3.7), K is scaled proportionally to the binder content following K = Kref(C/Cref), with α held constant. This proportional scaling is consistent with the maturity-based formulation of Ballim and Graham (2004), who derive total heat release from adiabatic-calorimeter binder fingerprints and report peak heat rates of approximately 3 W kg−1 at t20 ≈ 12 h for typical Portland cements. The adopted α gives a heat-release time scale of 1/α = 0.66 day, so its maximum heat-production window falls within the same first-day hydration interval rather than implying a later or slower heat source.
2.2. Boundary Conditions
Convective heat exchange with the surrounding environment is imposed on each exposed face through Newton's law of cooling:
Two distinct convection regimes are prescribed in the present model. The first (Type-1) corresponds to free surfaces that exchange heat directly with the ambient air, while the second (Type-2) corresponds to surfaces in contact with formwork or curing mats. The reference convection coefficients are sourced from the Korean Concrete Institute specifications (Korea Concrete Institute, 2009): hc = 12 kcal m−2 h−1 °C−1 for steel formwork in contact with water and hc = 4.5 kcal m−2 h−1 °C−1 for curing mats. The latter is equivalent to hc ≈ 5 W m−2 °C−1, in close agreement with the timber-formwork value reported by Ballim and Graham (Ballim & Graham, 2004) under light-wind conditions. For surfaces exposed to direct air, Ali and Urgessa (Ali & Urgessa, 2012) proposed a wind-dependent expression hc = 20 + 14w (kJ m−2 h−1 °C−1) for wind speeds w ≤ 5 m s−1, which is consistent with the Korean reference range used here.
2.3. Mechanical Properties and Thermal Stress
To capture the strong age dependence of early-age concrete mechanical properties, the compressive-strength gain follows the ACI 2092R formula (ACI 209.2R-08, 2008):
The elastic modulus and the splitting tensile strength are derived from the ACI 318 (ACI 318-19, 2022) correlations:
with a = 4.0, b = 0.85 (Type-I cement under moist curing), W = 2400 kg m−3 and fc'(28) = 35 MPa. Whereas simplified one-dimensional models estimate thermal stress through an empirical restraint factor R (e.g. σth = Ec · αth · ΔT · R), the present work employs a full three-dimensional finite-element formulation. The thermal stress tensor is assembled directly from the global stiffness matrix and the maximum principal tensile stress σt,max(t) is extracted at every time step (ACI PRC 207.2R-07, 2007). The applicability of the ACI 209/318 models to tropical-climate concrete is discussed further in Section 4.3.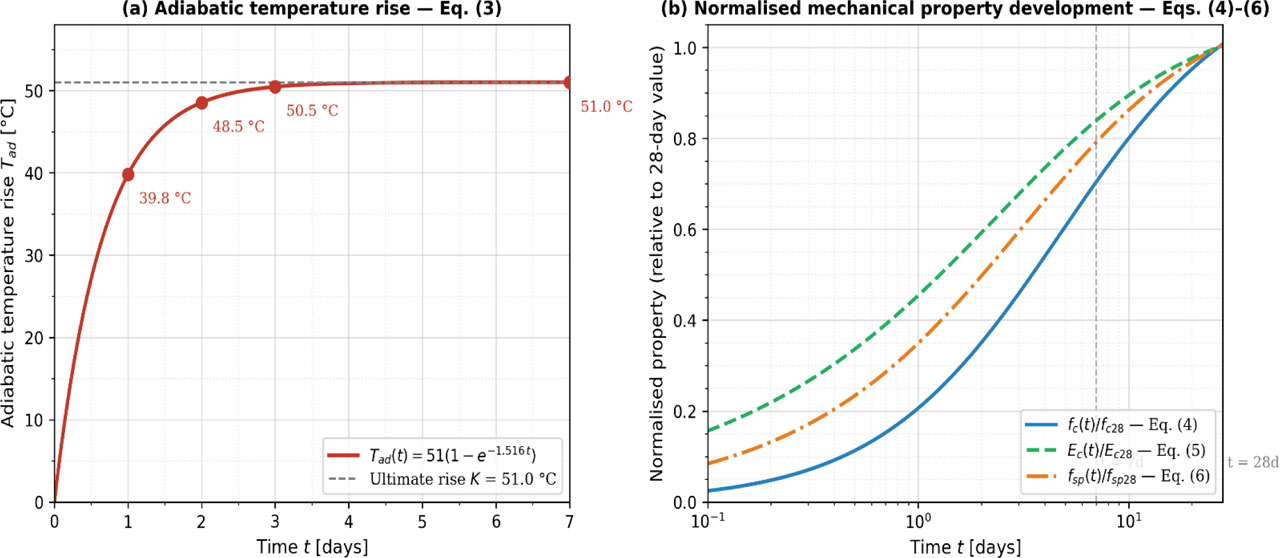
Figure 1:
Time-dependent baseline relationships for the hydration-heat and mechanical-property models (K = 51 °C, α = 1.516 day−1, a = 4.0, b = 0.85, fc′(28) = 35 MPa). Values in (b) are normalised to the 28-day reference
Figure 1 illustrates the two principal time-dependent relationships underlying the hydration-heat and mechanical-property sub-models. Subplot (a) shows the exponential adiabatic temperature-rise curve Tad(t) = 51(1 − e−1.516t), which reaches 90 % of the ultimate heat release K = 51 °C within approximately 1.5 days. Subplot (b) shows the normalised evolution of compressive strength fc(t)/fc28, elastic modulus Ec(t)/Ec28, and splitting tensile strength fsp(t)/fsp28 per Equations (4) – (6); all three properties develop rapidly in the first three days, confirming that the thermal-cracking window (typically 12–120 h) coincides with the steepest gradient of mechanical-property gain.
2.4. Thermal Crack Index and Acceptance Criteria
The KCI Standard Specifications (Korea Concrete Institute, 2009) define the thermal crack index as:
Where:fsp(t) – the age-dependent splitting tensile strength from Eq. (6) (or, when available, from a best-fit regression of laboratory data),
σth(t) ≡ σt,max(t) – the maximum principal tensile stress at age t extracted directly from the 3-D thermal–stress analysis.
The Korean code adopts the three-band acceptance criterion summarised in Table 1.
Table 1:
Thermal crack-index acceptance bands (Korea Concrete Institute, 2009)
| Criterion | Thermal crack index Icr |
|---|---|
| To prevent cracks | Icr ≥ 1.5 |
| To limit cracks | 1.2 ≤ Icr < 1.5 |
| To allow cracks | 0.7 ≤ Icr < 1.2 |
The same three-band acceptance scheme has been adopted by the Japan Concrete Institute (Japan Concrete Institute, 2016; Sato et al., 2013), whose Guidelines further translate the crack index into a quantitative thermal-cracking probability through the Weibull-type expression P(Icr) = [1 − exp{−(Icr/0.92)−4.29}] × 100, calibrated on 65 mass-concrete structures and 728 individual members. The 5% probability threshold corresponds approximately to Icr ≈ 1.85, broadly consistent with the Icr ≥ 1.5 “prevent cracks” band employed in the Korean code (Korea Concrete Institute, 2009), and is supported empirically by Ashizawa et al. (Ashizawa et al., 2019), whose 130-section field survey of box-culvert side walls reported a mean Icr of 1.07 in cracked sections versus 1.10 in uncracked sections, with overall coefficients of variation of 13.4% for tensile stress and 7.4% for tensile strength. Based on project requirements and engineering judgement for WTG foundations, the following combined acceptance limits are adopted herein:
This acceptance table establishes the interpretation framework used throughout the Results and Discussion sections. In particular, the distinction between the prevent-cracks, limit-cracks, and allow-cracks bands provides the basis for evaluating whether the simulated responses remain acceptable under variations in geometry, placement temperature, ambient conditions, convection, and binder content. The subsequent discussion of Icr,min therefore refers to Table 1 as the common acceptance benchmark.
2.5. Surface Modulus Definition
The surface modulus M is defined as the ratio of the area of surfaces subjected to environmental cooling Acool (m2) to the total concrete volume V (m3) (Flaga & Klemczak, 2016; Klemczak & Żmij, 2021):
The cooling surface area is the area of faces that can exchange heat with the surrounding environment under the adopted boundary conditions. Faces cast against soil, against previously hardened concrete, or against heavily insulated boundaries are excluded from Acool. For a cube of side length L resting on soil with five exposed faces, M = 5L2 / L3 = 5/L. The same convention is applied consistently in Table 3: the bottom face is excluded for the slab and pile-cap cases (G5, G6 and G8), while the column case G7 includes the four vertical faces and one exposed end face, giving Acool = 52 m2. This convention keeps Acool tied to the thermal boundary condition rather than to the geometric face count alone. The metric allows cubes, slabs, pile caps and columns to be compared on a common scale and is consistent with the CIRIA C766 mass-concrete classification M < 2 m−1 (Flaga & Klemczak, 2016). Physically, M represents the heat-dissipation area available per unit concrete volume; lower M indicates a thermally massive member with greater core heat retention.
The enhanced massivity index of Klemczak and Smolana (Klemczak & Smolana, 2024), mcor = ms/(kf·kb·kΔT), augments Eq. (9) with binder-, content- and temperature-correction factors kf, kb and kΔT. The present study deliberately retains the simpler geometric form of M because T0, Tamb and cement content are swept explicitly in separate parametric series, allowing their influence on Icr,min to be observed rather than embedded in correction coefficients. Consequently, the proposed Mcrit should be read as a condition-specific threshold for the stated mix, T0, Tamb and convection assumptions, not as a universal constant. In applications where binder type, binder content or initial temperature depart substantially from the baseline, the mcor framework provides a useful complementary screening variable.
2.6. Post-processing Pipeline and Reference Setup
All MIDAS Civil analyses reported in this paper use SI units throughout: lengths in metres (m), forces in kilonewtons (kN), temperatures in degrees Celsius (°C), thermal conductivity in W m−1 K−1, and convection coefficients in kcal m−2 h−1 °C−1 as required by the Korean Concrete Institute input format (1 kcal m−2 h−1 °C−1 ≈ 1.163 W m−2 K−1). The Python post-processor converts all MIDAS Civil outputs to SI before computing derived quantities. The post-processing routine, implemented in Python, parses each MIDAS Civil output dataset and reports four quantities at every solver step: (a) the temperatures recorded at the seven monitoring nodes, (b) the maximum principal tensile stress within the concrete domain, (c) the instantaneous core-to-surface temperature differential ΔTcs(ti) and its temporal maximum ΔTcs,max, and (d) the crack index Icr(t) evaluated using the time-dependent material models in Eqs. (4)–(7). The notation ΔTcs,max is adopted to distinguish the governing core-to-surface temperature differential from a generic thermal gradient.
A 3 × 3 × 3 m concrete block resting on a 9 × 9 × 1.5 m sub-soil layer is modelled as the reference mock-up, representative of WTG foundations constructed in Vietnam (V. Q. Nguyen et al., 2022). Exploiting symmetry, only one quarter (1.5 × 1.5 × 3 m concrete and 4.5 × 4.5 × 1.5 m soil) is meshed into 2376 eight-node solid elements at a 250 mm cubic reference element size. Table 2 reports the baseline material and thermal properties.
Mechanical restraint and soil-foundation interaction are represented through an explicit sub-soil layer beneath the concrete block so that early-age stress develops from the coupled stiffness of the concrete and its support rather than from a free-standing body. Symmetry planes are restrained in the normal direction, the base of the soil layer is restrained vertically, and the lateral soil boundaries are constrained only to the extent required to eliminate rigid-body motion. Perfect thermal contact and bonded mechanical interaction are assumed at the concrete-soil interface; interface slip, uplift, creep relaxation, and construction-joint debonding are not modelled explicitly. These assumptions are appropriate for comparative screening, but they may influence σt,max and, consequently, Icr in design cases involving weak subgrade restraint or intentionally introduced sliding layers.
Table 2:
Baseline material and thermal properties
| Property | Concrete | Sub-soil | Unit |
|---|---|---|---|
| Specific heat c | 0.25 | 0.20 | kcal·kgf(−1) °C(−1) |
| Density ρ | 2400 | 1800 | kgf·m(−3) |
| Thermal conductivity k | 2.3 | 1.7 | kcal·m(−1)·hr(−1)·°C(−1) |
| Convection (atm / steel form) | 4.5 / 4.5 (vary) | 12 | kcal·m(−2)·hr(−1)·°C(−1) |
| Ambient Tamb | 27.1 (vary) | – | °C |
| Casting T0 | 15 (vary) | – | °C |
| 28-day compressive strength f′c(28) | 350 | – | kgf·cm(−2) |
| Strength gain (a, b) | 4.0, 0.85 | – | – |
| 28-day modulus Ec | 2.99×10⁵ | 1.0×10⁻⁵ | kgf·cm(−2) |
| Thermal expansion αth | 1.0×10⁻5 | 1.0×10⁻5 | °C(−1) |
| Poisson’s ratio | 0.18 | 0.20 | – |
| Cement content | 350 | – | kg·m(−3) |
| Heat source (K; α) | 51.0; 1.516 | – | °C; day(−1) |
The baseline properties in Table 2 combine a moderate-strength concrete, explicit sub-soil support, and reference thermal boundary conditions representative of practical foundation casting. Because all later sensitivity studies modify only one parameter group at a time relative to this baseline, Table 2 is essential for maintaining internal consistency when comparing Tables 4–10 and for ensuring that observed changes in Tmax,core, ΔTcs,max, and Icr,min can be attributed to the intended variable rather than to simultaneous shifts in the reference setup.
Seven monitoring nodes are extracted from each MIDAS Civil run: N295 (core centre), N300 (side centre), N335 (corner centre), N540 (top centre), N545 (side-top), N580 (corner-top) and N50 (base centre). At every time step ti, the instantaneous maximum gradient is computed as:
For the baseline case, the post-processor returns Tmax,core = 65.16 °C at t = 62 h (node N295) and ΔTcs,max = 26.17 °C at t = 86 h, governed by the core-to-corner-top node pair (N295–N580). The seven-node check confirms that the corner-top node, rather than the geometric side face, governs the critical surface temperature, consistent with the bell-shaped temperature distribution reported by Klemczak and Żmij (Klemczak & Żmij, 2021) for restrained foundation slabs.
2.7. Surface-modulus Parametric Matrix
Eight representative geometries spanning M = 1.00–2.50 m−1 are defined in Table 3. Each geometry uses the same baseline material properties, boundary conditions, and mesh density (250 mm reference element size), so differences in Tmax,core, ΔTcs,max, and Icr,min can be attributed to the combined effects of geometric scale, aspect ratio, and cooling-surface layout. The updated matrix provides overlapping-M comparisons rather than exact same-M pairs: G4 and G6 both have M = 1.00 m−1, G3 and G5 are close at M = 1.25 and 1.33 m−1, G8 and G2 lie at M = 1.50 and 1.67 m−1, and G7 and G1 occupy the high-M range at M = 2.17 and 2.50 m−1. These comparisons allow a direct test of whether the surface modulus alone captures geometry effects or whether an additional shape- or aspect-ratio-related descriptor is required.
Table 3:
Surface-modulus parametric matrix (G-series)
| ID | Geometry | Dimensions [m] | Acool [m2] | V [m3] | M [m−1] |
|---|---|---|---|---|---|
| G1 | Small cube | 2 × 2 × 2 | 20 | 8 | 2.50 |
| G2 | Reference cube | 3 × 3 × 3 | 45 | 27 | 1.67 |
| G3 | Large cube | 4 × 4 × 4 | 80 | 64 | 1.25 |
| G4 | Very large cube | 5 × 5 × 5 | 125 | 125 | 1.00 |
| G5 | Thin slab | 6 × 6 × 1.5 | 72 | 54 | 1.33 |
| G6 | Thick slab | 6 × 6 × 3 | 108 | 108 | 1.00 |
| G7 | Column | 2 × 2 × 6 | 52 | 24 | 2.17 |
| G8 | Pile cap | 4 × 4 × 2 | 48 | 32 | 1.50 |
The G-series matrix in Table 3 is structured to test whether geometries with similar or identical surface modulus values also produce similar thermal responses. The matrix is therefore not intended as a simple size sequence, but as a deliberate cross-geometry comparison set in which cubes, slabs, columns, and pile caps partially overlap in M. This design is important because it allows the later analysis in Section 3.8 to separate the effect of massivity from the effect of shape and heat-flow path length.
3. Results
3.1. Baseline Thermal Response
The baseline configuration (T0 = 15 °C, Tamb = 27.1 °C, hc = 4.5 kcal m−2 h−1 °C−1, Δt = 2 h, element size 250 mm) predicts Tmax,core = 65.16 °C at t ≈ 62 h and ΔTcs,max = 26.17 °C at t ≈ 86 h. Figure 2 shows the temperature–time histories at the seven monitoring nodes, and Figure 3 illustrates the temperature contour of the quarter model at the instant of peak core temperature.
The interior node N295 attains its maximum at approximately 62 h and then cools gradually, whereas the top-face and corner-top nodes heat up and cool more rapidly because of convective heat loss to the ambient air. The separation between the warmest curve (N295) and the coolest curve (N580) represents the instantaneous core-to-surface temperature differential defined in Eq. (10), and its maximum at approximately 86 h corresponds to ΔTcs,max. Figure 3 confirms the expected bell-shaped temperature distribution: the highest temperature is concentrated in the core of the block, while the steepest gradient develops towards the exposed top corner. This response pattern is broadly consistent with the experimental observations of Le et al. (H. H. Le et al., 2020) on a 2.5 m cubic mock-up and with the field-instrumented diaphragm-wall study of Grabowski and Mitew (Grabowski & Mitew-Czajewska, 2021).
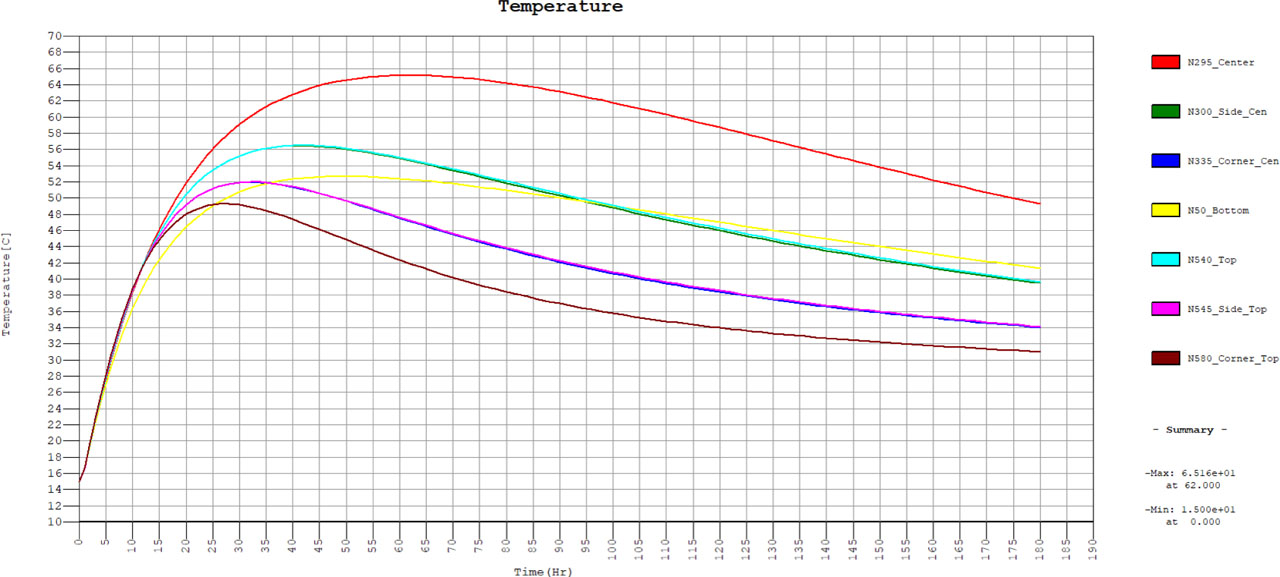
Figure 2:
Temperature–time histories at the seven monitoring nodes for the baseline case
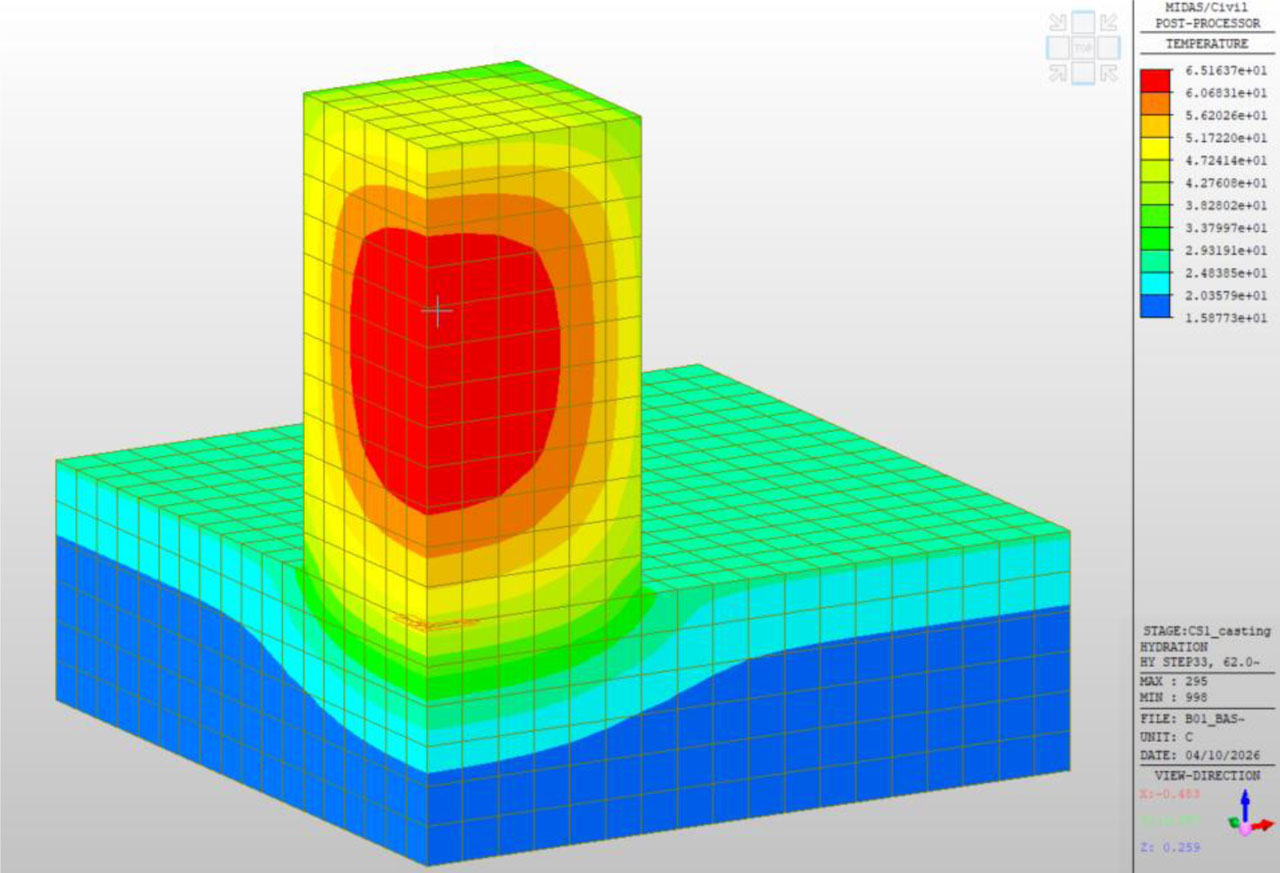
Figure 3:
Temperature contour of the quarter model at the instant of peak core temperature
3.2. Effect of Time Step Δt
To assess temporal convergence, the analysis was repeated with five-time steps from 0.5 h to 8 h (cases A1–A5). Table 4 reports Tmax,core, ΔTcs,max, and Icr, min..
Table 4:
Effect of time step Δt
| Case | Δt [h] | Steps | Tmax,core [°C] | ΔTcs,max [°C] | Icr,min | CPU [min] |
|---|---|---|---|---|---|---|
| A1 | 0.5 | 360 | 63.93 | 25.22 | 1.688 | 10 |
| A2 | 1.0 | 180 | 63.84 | 24.21 | 1.735 | 07 |
| A3 | 2.0 (ref) | 90 | 65.16 | 26.17 | 1.793 | 03 |
| A4 | 4.0 | 45 | 67.73 | 27.97 | 1.519 | 02 |
| A5 | 8.0 | 23 | 72.69 | 31.41 | 1.284 | 01 |
Results with Δt ≤ 2 h are effectively converged: cases A1 and A2 differ by only 0.09 °C in Tmax,core. Coarser time steps overpredict the peak response; the 8 h case (A5) overestimates Tmax,core by almost 9 °C and reduces Icr,min from 1.793 to 1.284, thereby shifting the assessment from the “prevent cracks” band to the “limit cracks” band. A time step of 2 h is therefore recommended for this class of problem and is consistent with the implicit-explicit stability condition reported by Ballim and Graham (Ballim & Graham, 2004), who require Δt ≤ ρcpΔ2/[4k(1 + Bi)] at surface nodes.
3.3. Effect of Element Size
Spatial-discretisation convergence was investigated using six characteristic element sizes ranging from 500 mm to 150 mm (cases B1–B6; Table 5). The peak core temperature Tmax,core is nearly insensitive to mesh size, with only 0.5 °C separating the 500 mm and 150 mm meshes. By contrast, ΔTcs,max and Icr,min remain mesh-sensitive because the governing corner-top gradient is highly localised. Mesh refinement increases ΔTcs,max from 17.50 °C (B1) to 29.38 °C (B6), while Icr,min decreases from 1.793 at B4 to 1.396 at B6. The 250 mm mesh should therefore be regarded as a practical reference mesh for the comparative parametric campaign rather than as a fully converged crack-index solution. The B6 result indicates that final design checks for cases close to the Icr = 1.2 or 1.5 acceptance limits should be repeated with an element size of approximately 150 mm, or with an explicit mesh-convergence correction applied to ΔTcs,max and Icr,min. Comparable mesh-density requirements were also reported by Ahorro and Estores (Ahorro & Estores, 2024) for probabilistic thermal-cracking simulations, who used 100 mm hexahedral elements for 0.5 m cube analyses in DIANA 10.3.
3.4. Effect of Convection Coefficient hc
The convection coefficient on the exposed top face was varied from 1.5 to 12 kcal m−2 h−1 °C−1 (cases C1–C4; Table 6). The results show an inverse relation between surface-cooling intensity and thermal-crack safety. Increasing hc reduces Tmax,core only marginally, by 0.96 °C between C1 and C4, because peak core temperature is governed primarily by internal heat generation. In contrast, ΔTcs,max increases from 16.55 °C (C1) to 31.03 °C (C4), while Icr,min decreases from 2.471 to 1.537, shifting the response from the “prevent cracks” band to the “limit cracks” band. This indicates that passive thermal insulation, achieved for example through insulated formwork or curing mats, is a more reliable crack-control measure than aggressive surface convection. Su et al. (Su et al., 2018) similarly recommended limiting the core-to-surface temperature differential to approximately 25 °C through a combination of insulation, controlled cooling, and low-heat materials.
3.5. Effect of Placement Temperature T0
The placement (fresh) concrete temperature was swept from 15 °C up to 35 °C in five increments (cases D1–D5), with Tamb = 27.1 °C fixed (Table 7).
Table 7:
Effect of placement temperature T0
| Case | T0 [°C] | Tmax,core [°C] | ΔTcs,max [°C] | Icr,min |
|---|---|---|---|---|
| D1 | 15 (ref) | 65.16 | 26.17 | 1.793 |
| D2 | 20 | 69.92 | 29.57 | 1.647 |
| D3 | 25 | 74.69 | 32.97 | 1.518 |
| D4 | 30 | 79.48 | 36.39 | 1.404 |
| D5 | 35 | 84.28 | 39.80 | 1.302 |
Increasing the placement temperature by 20 °C produces an almost one-to-one increase of 19.12 °C in Tmax,core, because the adiabatic hydration contribution remains approximately unchanged while the initial temperature shifts the entire thermal history upward by T0. For T0 ≥ 25 °C, the 70 °C DEF threshold is exceeded and Icr,min falls below 1.5. At T0 = 35 °C, Icr,min = 1.302, only marginally satisfying the project requirement Icr ≥ 1.2. Pre-cooling of aggregates or the use of ice-water mixing should therefore be regarded as necessary measures for hot-weather mass-concrete pours in tropical climates. The sensitivity obtained here is also consistent with Le, Vu and Ho (V. M. Le et al., 2025), whose 57-case FE regression identified placement temperature as the dominant first-order term for Tmax and the second most influential term for ΔTcs, max.. Tasri (Tasri, 2025) independently reached a comparable placement-temperature limit from a V/A-based analysis.
3.6. Effect of Ambient Temperature Tamb
Ambient temperature was varied from 20 °C to 35 °C while keeping T0 = 15 °C constant (cases E1–E5; Table 8). The influence of Tamb on Tmax,core is negligible, with a total variation of only 0.77 °C between E1 and E5. Its effect on ΔTcs,max, however, is substantial: the governing temperature differential decreases from 31.02 °C at 20 °C ambient temperature to 20.84 °C at 35 °C. The corresponding Icr,min increases from 1.614 to 2.033. Cold-weather pours therefore remain a non-trivial cracking risk even when Tmax remains acceptable, because the larger ambient-to-core differential induces higher tensile stress near the surface. This outcome is consistent with Abdel et al. (Abdel-Raheem et al., 2018), who recommended additional surface protection under cooler ambient conditions to prevent thermal-shock cracking caused by rapid surface cooling.
3.7. Effect of Cement Content
To probe the role of internal heat-generation intensity, the binder dosage was swept across four levels covering 300 to 450 kg m−3 (cases F1–F4, Table 9). The adiabatic temperature-rise parameter K was adjusted proportionally according to K = Kref(C/Cref) with α = αref and Cref = 350 kg m−3.
Table 9:
Effect of cement content (F-series)
| Case | C [kg m−3] | K [°C] | Tmax,core [°C] | ΔTcs,max [°C] | Icr,min |
|---|---|---|---|---|---|
| F1 | 300 | 43.7 | 58.07 | 21.26 | 2.16 |
| F2 | 350 (ref) | 51.0 | 65.16 | 26.17 | 1.79 |
| F3 | 400 | 58.3 | 72.25 | 31.10 | 1.53 |
| F4 | 450 | 65.6 | 79.35 | 36.02 | 1.33 |
The F-series demonstrates that binder content is among the strongest physical drivers of thermal-cracking risk in mass concrete. Over the parametric range investigated, a near-linear increase in Tmax,core is observed, with a sensitivity of approximately 7.1 °C per 50 kg m−3 increment. At C = 350 kg m−3, Tmax,core = 65.16 °C is comfortably below the 70 °C DEF threshold; at C = 400 kg m−3 the peak reaches 72.25 °C, exceeding the threshold even at T0 = 15 °C; at C = 450 kg m−3 it reaches 79.35 °C. The minimum crack index follows a corresponding decrease, from Icr,min = 2.16 at C = 300 kg m−3 down to 1.33 at C = 450 kg m−3. Linear interpolation places the Icr,min = 1.5 limit at C ≈ 405 kg m−3 and the Icr,min = 1.2 limit at C ≈ 470 kg m−3.
This finding is highly consistent with the case-study evidence reported for high-performance mass concrete columns and slabs. Kim and Lee (J.-H. Kim & Lee, 2004) documented two 2.4 m diameter Petronas Twin Tower column mock-ups: a binary OPC + silica-fume blend at 535 kg m−3 produced Tmax = 91.6 °C and a core–corner gradient ΔT = 57.5 °C that resulted in visible thermal cracks, whereas a ternary OPC + 20 % PFA + silica fume blend at the same total binder content produced Tmax = 87.0 °C, ΔT = 52.9 °C and no cracking. Woo et al. (Woo et al., 2010) developed a low-heat ternary cement (OPC + GGBS + FA) for a 4 × 4 × 4 m mock-up that achieved Tmax = 60.0–64.0 °C and ΔT = 13.7–15.0 °C — both below the JCI 20 °C limit. For thermally critical mass-concrete pours, the present F-series therefore provides a quantitative upper bound: cement content should be capped at C ≤ 400 kg m−3 unless paired with low-heat binders or active cooling.
3.8. Effect of Surface Modulus M
All eight geometries in Table 3 were analysed using the baseline material properties and boundary conditions. Table 10 reports the key thermal outputs, and Figure 4 plots M against Tmax,core, ΔTcs,max, and Icr,min. The 3 × 3 × 3 m reference cube (G2) reuses the baseline values from Section 3.1.; the remaining cases (G1, G3–G8) are additional MIDAS Civil runs generated through the automated framework described in Section 2.6.
Table 10:
Effect of surface modulus M on the thermal response (G-series)
| Case | Geometry | M [m−1] | Tmax,core [°C] | ΔTcs,max [°C] | Icr,min | t(Tmax,core) [h] | Pcr,JCI [%] |
|---|---|---|---|---|---|---|---|
| G1 | 2 × 2 × 2 cube | 2.50 | 61.54 | 21.15 | 2.103 | 44 | 2.8 |
| G2 | 3 × 3 × 3 cube (ref) | 1.67 | 65.16 | 26.17 | 1.79 | 62 | 5.6 |
| G3 | 4 × 4 × 4 cube | 1.25 | 66.52 | 30.92 | 1.295 | 78 | 20.6 |
| G4 | 5 × 5 × 5 cube | 1.00 | 67.01 | 33.67 | 1.095 | 94 | 37.7 |
| G5 | 6 × 6 × 1.5 slab | 1.33 | 58.82 | 13.56 | 4.523 | 45 | 0.1 |
| G6 | 6 × 6 × 3 slab | 1.00 | 64.40 | 23.00 | 2.553 | 71 | 1.2 |
| G7 | 2 × 2 × 6 column | 2.17 | 61.82 | 24.69 | 1.743 | 50 | 6.2 |
| G8 | 4 × 4 × 2 pile cap | 1.50 | 63.23 | 23.41 | 1.778 | 54 | 5.7 |
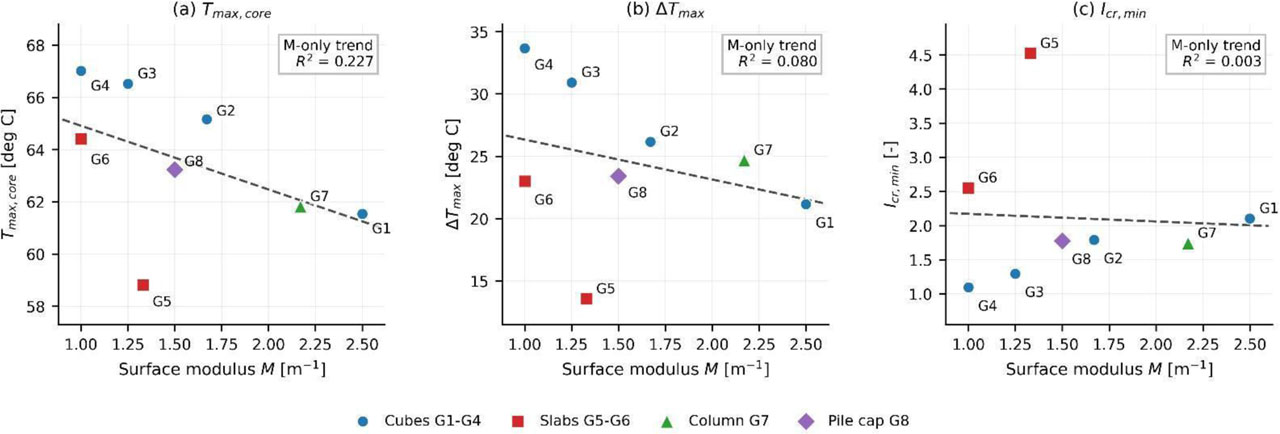
Figure 4:
Diagnostic M-only plots for (a) Tmax,core, (b) ΔTcs,max, and (c) Icr,min
Dashed lines represent simple one-variable M trends fitted to the updated full G-series dataset in Table 10. The low R2 values indicate that M alone is not a reliable shape-independent predictor across mixed geometries.
The G-series results in Table 10 link the cooling-surface definition in Table 3 to the stress-based crack index in Eq. (7), and the Pcr,JCI column converts each Icr,min value into the JCI thermal-cracking probability using P(Icr) = 1 − exp[−(Icr/0.92)−4.29] × 100. M-only regressions were examined first because the surface modulus is widely used as a massivity descriptor; however, their R2 values are low for the mixed G-series dataset (0.227 for Tmax,core, 0.080 for ΔTcs,max, and 0.003 for Icr,min). This indicates that higher-order polynomials in M would merely fit scatter without capturing the missing physical controls. A more defensible set of response-specific regressions is therefore adopted.
Table 11:
Regression-model performance for geometry descriptors and crack-index response
| Response | Candidate model | Predictors | R2 | RMSE | MAE | LOOCV RMSE | Interpretation |
|---|---|---|---|---|---|---|---|
| Tmax,core | M-only | M | 0.227 | 2.276 °C | 1.623 °C | 2.742 °C | Weak mixed-geometry descriptor |
| Tmax,core | Quadratic heat-flow model | dmin, dmin2 | 0.940 | 0.633 °C | 0.449 °C | 1.108 °C | Strong screening relation |
| ΔTcs,max | M-only | M | 0.080 | 5.494 °C | 4.195 °C | 6.824 °C | Not adequate |
| ΔTcs,max | Two-variable model | M, dmin | 0.869 | 2.073 °C | 1.710 °C | 3.788 °C | Acceptable for screening |
| Icr,min | M-only | M | 0.003 | 1.002 | 0.717 | 1.220 | Invalid for crack-index prediction |
| Icr,min | Inverse gradient model | ΔTcs,max | 0.951 | 0.223 | 0.177 | 0.302 | Best performing and physically interpretable |
RMSE, MAE, and leave-one-out cross-validation errors are reported because the G-series contains only N = 8 geometries; accordingly, the models should be interpreted as empirical screening relationships rather than universal design equations. In Equations (12) – (13), dmin denotes the smallest member dimension and represents the shortest characteristic heat-flow path. The quadratic term in Eq. (12) captures the expected saturation of Tmax,core with increasing thickness, whereas Eq. (13) combines heat-flow length (dmin) with cooling-area density (M). Equation (14) adopts an inverse form in ΔTcs,max because Icr is defined as a strength-to-stress ratio and the thermally induced tensile stress is approximately proportional to the governing temperature differential. This form is also physically more defensible than a purely empirical second-order polynomial fitted to Icr,min versus M and provides the strongest interpretable fit for the present G-series (R2 = 0.951).
The model-performance comparison in Table 11 confirms that the best-performing models are also the most physically interpretable. In particular, the strong performance of the dmin-based and ΔTcs,max-based relations, together with the weak LOOCV performance of the M-only fits, reinforces the central argument of the paper: the surface modulus is useful for preliminary screening, but design-relevant crack assessment must remain response-specific and shape-aware. The consistency between statistical performance and mechanistic interpretation strengthens the credibility of Eqs. (12) – (14) as screening tools.
The non-cubic shapes deviate markedly from the M-only cube trend even when their M values overlap the cubic range. At the same M = 1.00 m−1, the very large cube G4 yields Icr,min = 1.095, whereas the thick slab G6 yields Icr,min = 2.553; the corresponding ΔTcs,max values are 33.67 °C and 23.00 °C, respectively. A similar divergence is observed between the large cube G3 (M = 1.25 m−1, Icr,min = 1.295) and the thin slab G5 (M = 1.33 m−1, Icr,min = 4.523). The stronger Icr,min–ΔTcs,max relation in Eq. (14) therefore indicates that the crack index is governed more directly by the realised thermal differential than by M alone.
These updated regressions refine the earlier A/V-based interpretation of Le, Vu and Ho (V. M. Le et al., 2025). Their conclusion that Tmax and ΔTcs,max are governed primarily by A/V is consistent with the cubic subset; however, the full G-series shows that combining cubes, slabs, columns, and pile caps require at least one additional geometric scale descriptor such as dmin. When the response variable changes to Icr,min, the controlling correlation becomes gradient-based rather than M-based. This observation is consistent with the JCI/KCI crack-index framework and with enhanced massivity approaches such as that of Klemczak and Smolana (Klemczak & Smolana, 2024), in which the simple surface modulus is used as a pre-design screening parameter rather than as a complete predictor of cracking risk.
The inverse model Icr,min = −1.253 + 77.323/ΔTcs,max gives R2 = 0.951 and is physically consistent with the crack-index definition as a strength-to-thermal-stress ratio.
This relationship further clarifies why the crack index is more consistently interpreted through the realised thermal differential than through the surface modulus alone (Figure 5). The data follow a clear monotonic inverse trend: geometries with larger ΔTcs,max consistently exhibit lower Icr,min, indicating lower thermal-cracking safety. From a practical standpoint, once the governing core-to-surface temperature differential has been obtained from three-dimensional analysis, Equation (14) offers a more direct and physically interpretable screening estimate of crack risk than an M-only rule for mixed geometries.
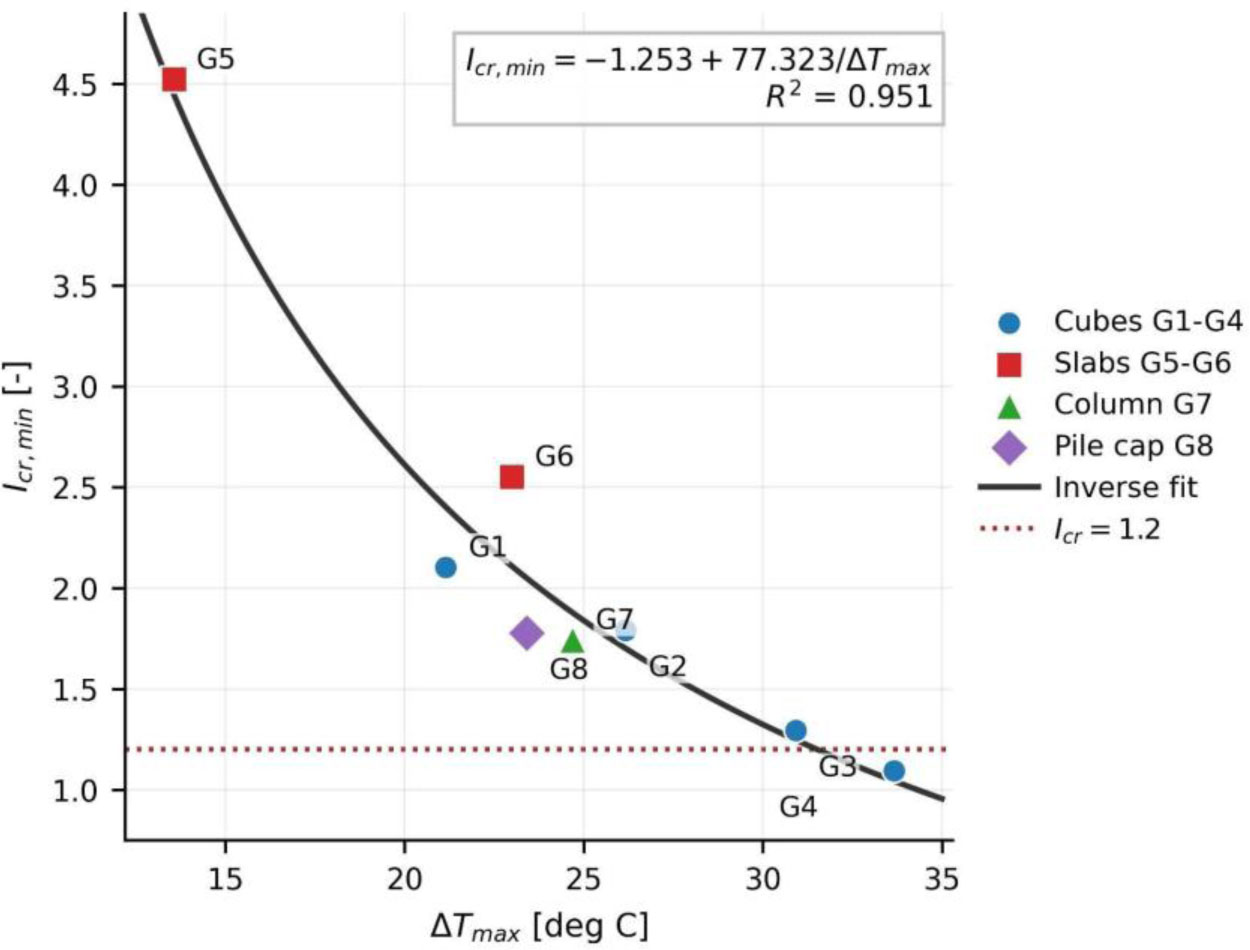
Figure 5:
Relationship between Icr,min and ΔTcs,max for the updated G-series
4. Discussion
4.1. Overall Sensitivity Ranking
The sensitivity ranking in Table 12 summarises the influence of all investigated parameters on Tmax,core and Icr, min.. The metrics ΔTmax,core and ΔIcr,min denote the maximum absolute variation in peak core temperature and minimum crack index over each parameter range. The G-series is reported separately for the cubic-only M trend and for the full geometry/surface-modulus portfolio so that the screening regressions are not overgeneralised.
Among the physically controllable inputs, binder content and placement temperature emerge as the dominant drivers of Tmax,core, whereas the convection coefficient and geometry-related effects dominate Icr,min. The large variation, ΔIcr,min = 3.428, in the full G-series is driven mainly by the non-cubic slab response, particularly G5. The revised regressions clarify this behaviour: Tmax,core is controlled primarily by dmin, ΔTcs,max by the combined M–dmin descriptor, and Icr,min by the realised ΔTcs,max rather than by M alone.
This sensitivity ranking aligns broadly with Le, Vu and Ho (V. M. Le et al., 2025), who reported F-values for Tmax in the order Tp > rt > Tc > Wc,u in their two-layer DOE, and with Zhang et al. (Zhang et al., 2024), who showed that moulding temperature, wind speed and insulation thickness control thermal stress in super-long mass slabs. The present ranking extends those findings by adding a 3-D geometry sweep at fixed material parameters and by separating the cubic M trend from the full cross-geometry response of Icr, min..
Table 12:
Comparative sensitivity of peak core temperature Tmax,core and minimum crack index Icr,min
| Parameter | Range studied | ΔTmax,core [°C] | ΔIcr,min | Dominant response |
|---|---|---|---|---|
| Time step Δt | 0.5–8 h | 8.79 | 0.51 | Numerical stability |
| Element size | 150–500 mm | 0.50 | 0.39 | Numerical resolution |
| Convection coefficient hc | 1.5–12 kcal m−2 h−1 °C−1 | 0.96 | 0.93 | Icr,min |
| Placement temperature T0 | 15–35 °C | 19.14 | 0.49 | Tmax,core |
| Ambient temperature Tamb | 20–35 °C | 0.77 | 0.42 | Icr,min |
| Cement content C | 300–450 kg m−3 | 21.28 | 0.83 | Tmax,core |
| Surface modulus M (cubic subset G1–G4) | 1.00–2.50 m−1 | 5.47 | 1.008 | Icr,min |
| Geometry/surface-modulus portfolio (full G-series) | 1.00–2.50 m−1 | 8.19 | 3.428 | Shape-dependent Icr,min response |
The ranking in Table 12 also helps reconcile the different roles of M, dmin, and ΔTcs,max across the manuscript. No single scalar descriptor captures every response equally well: Tmax,core is governed mainly by heat-generation intensity and characteristic thickness, whereas Icr,min is linked more directly to the realised temperature differential and the associated restraint-sensitive stress state. This interpretation is consistent with the regression hierarchy in Table 11 and supports the use of M as a screening parameter rather than as a stand-alone crack-control criterion.
Accordingly, Tables 11 and 12 should be read as evidence for the relative usefulness of different screening descriptors, not as a substitute for explicit three-dimensional thermal-stress analysis when acceptance decisions depend on project-specific geometry, restraint, and material behaviour. Physically, the contrasting roles of M, dmin, and ΔTcs,max can be understood from the governing heat-transfer and stress mechanisms. The peak core temperature Tmax,core is set by the balance between internal heat generation (proportional to binder content and K) and heat dissipation through the minimum dimension dmin; once the characteristic diffusion length exceeds roughly 1.5–2 m, the core becomes effectively insulated and Tmax,core saturates, which explains the quadratic form of Eq. (12). The core-to-surface temperature differential ΔTcs,max, by contrast, is governed by the competition between the heat source intensity in the core and the convective heat loss at the surface: a larger cooling-surface density (higher M) accelerates surface cooling, while a longer heat-flow path (larger dmin) delays heat arrival at the surface, so both descriptors appear in Eq. (13). The crack index Icr,min is a strength-to-stress ratio in which the tensile stress is driven primarily by the thermal incompatibility between the contracting surface and the expanding core; because this incompatibility is quantified directly by ΔTcs,max, the inverse relation in Eq. (14) is not merely empirical but mechanistically grounded. Shape enters as a second-order effect through the restraint stiffness and the three-dimensional stress redistribution: a squat pile cap and a slender column can share the same M yet generate very different stress fields because their aspect ratios, free-face boundaries, and restraint configurations differ. This is why M alone cannot serve as a crack-control criterion for mixed-geometry design.
4.2. Practical Engineering Implications
Based on the parametric results obtained herein, the following practical recommendations are proposed for mass-concrete foundations cast under hot-humid tropical conditions. These recommendations should be regarded as screening-level guidance only, because the regression equations were calibrated on N = 8 geometry cases with a single baseline material system; project-specific or commercial application therefore requires recalibration using additional geometries, refined meshes, and locally measured material properties.
(a) For the reference 3 × 3 × 3 m geometry, placement temperature should be limited to T0 ≤ 25 °C. Above this level, the 70 °C DEF threshold is exceeded, and pre-cooling of aggregates or ice-water mixing becomes necessary. This operational limit is also consistent with Tasri (Tasri, 2025), whose V/A = 1.5 m−1 curve gives a maximum allowable casting temperature of approximately 27.2 °C for ΔT ≤ 20 °C.
(b) For thermally critical pours, cement content should preferably be limited to C ≤ 400 kg m−3 when placement temperature is at or above 15 °C. Beyond this level, Icr,min falls below 1.5 in the present parametric study. Additional strength demand should therefore be satisfied, where possible, through supplementary cementitious materials such as GGBS, fly ash, or silica fume, which reduce the effective heat of hydration, as illustrated in (J.-H. Kim & Lee, 2004; Woo et al., 2010).
(c) Insulated formwork, for example a steel form combined with a curing mat and an effective hc of approximately kcal m−2 h−1 °C−1, is one of the most effective passive measures for controlling ΔTcs,max and maintaining Icr above 1.5. Increasing surface convection may slightly reduce Tmax, but it can simultaneously increase the core-to-surface temperature differential and reduce Icr,min; aggressive surface cooling should therefore not be assumed to improve crack control automatically.
(d) For cold-weather concreting, additional surface protection should be specified because lower ambient temperature increases the core-to-surface temperature differential even when Tmax remains acceptable, reducing Icr,min by as much as 0.42 over the 20–35 °C ambient range.
(e) For nominally cubic foundation geometries, the local cubic-subset estimate of Mcrit may be used as a preliminary screen under the baseline mixture and boundary-condition assumptions. For mixed or non-cubic geometries, however, Eqs. (12)–(14) should be used only as response-specific screening relations: Eq. (12) for peak temperature, Eq. (13) for ΔTcs,max, and Eq. (14) for crack-index response. Final acceptance should still be based on explicit three-dimensional analysis following the framework described in Sections 2.1–2.6.
(f) A 250 mm element size is suitable for comparative screening across the parametric campaign, but design checks near an acceptance boundary should be repeated with an element size of approximately 150 mm because Table 5 shows that Icr,min remains mesh-sensitive between cases B4 and B6.
Pre-submission consistency check. The notation is used consistently as follows: Tmax,core denotes peak core temperature; ΔTcs,max denotes the maximum core-to-surface temperature differential used in Tables 4–10 and Eqs. (13)–(14); and ΔTmax,core in Table 12 denotes the range of Tmax,core over each sensitivity series, not a core-to-surface differential. The response-specific regressions are reported as empirical screening relationships calibrated on the G-series dataset and should not be read as stand-alone code equations.
4.3. Limitations and Future Work
Several limitations constrain the generality of the proposed workflow. First, the regression models were calibrated on a limited G-series dataset (N = 8) and should therefore be interpreted as condition-specific screening relationships rather than universal design equations. Second, the reference 250 mm mesh is adequate for comparative parametric ranking but does not fully converge the localised corner-gradient response governing Icr,min; cases close to Icr = 1.2 or 1.5 should therefore be reassessed using refined meshes or a documented convergence correction. Third, the early-age mechanical properties were estimated from ACI 209 and ACI 318 (ACI 209.2R-08, 2008; ACI 318-19, 2022) relations rather than direct measurements of the actual Vietnamese mixture; project applications should therefore incorporate locally measured Ec(t), fsp(t), and, where possible, creep- or relaxation-related properties. Fourth, the model assumes perfect mechanical bond at the concrete–subgrade interface and does not account for viscoelastic phenomena such as creep relaxation or interface slip. In field conditions, partial bond and early-age creep typically reduce peak tensile stress relative to the fully restrained elastic estimate; conversely, weak or soft subgrade can shift the restraint pattern and alter the critical stress location. The current idealised boundary conditions are appropriate for comparative screening across geometries, but design cases involving soft subgrade, intentional sliding layers, or long-duration loading should incorporate creep-modified constitutive models. Fifth, the model has not yet been validated against a full-scale instrumented foundation with measured temperature, strain, and cracking data. These limitations do not affect the internal comparative logic of the present parametric study, but they do limit external generalisation and should be kept in mind when interpreting the proposed screening equations.
The present surface-modulus study is also limited to block-, slab-, pile-cap-, and column-type geometries. More complex configurations, such as tapered WTG foundations with haunches, embedded ducts, or staged lifts, will require additional parametric analyses. Direct validation against field data from the BT1 Wind Farm foundation should therefore be regarded as a priority before the proposed screening equations are adopted for project-level design use.
A useful next step would be to define an explicit applicability envelope for Equations (12) – (14), for example in terms of geometry family, dmin range, convection level, mesh density, and source of material properties. Stating these bounds more formally in an expanded dataset would help distinguish screening use from design-level use and reduce the risk of interpreting the proposed regressions as universal code-type equations.
Three extensions are proposed for future work. First, the workflow should be applied to a full-scale WTG foundation at the BT1 Wind Farm project (V. Q. Nguyen et al., 2022) using thermocouple histories for quantitative validation of Tmax, ΔTcs,max, and Icr,min. Second, Monte Carlo simulation can be incorporated to convert deterministic crack-index histories into thermal-cracking probability distributions, following the probabilistic framework of Ahorro and Estores (Ahorro & Estores, 2024). Third, the methodology may be extended to concrete containing coarse recycled aggregate, for which reduced thermal conductivity may lower peak core temperature while simultaneously increasing near-surface temperature gradients. Fourth, automated parametric scaling – for example via design-of-experiments sampling coupled with machine learning surrogate models such as Gaussian process regression or gradient-boosted trees – could substantially expand the geometry coverage beyond the present eight-case G-series and enable data-driven generalisation of the proposed screening relationships to a broader class of foundation shapes and boundary conditions.
A fourth avenue for future work is a systematic comparison with the European EN 1992-3:2006 restraint-factor framework (Bamforth, 2018), which addresses early-age cracking through an external-restraint formulation complementary to the internal-restraint crack-index method adopted herein. Such a comparison would clarify conditions under which each framework is more conservative and would enhance the applicability of the proposed workflow for structures designed to European standards.
5. Conclusion
This paper presents a shape-aware numerical investigation of early-age thermal-cracking risk in mass-concrete foundations using a coupled MIDAS Civil three-dimensional thermal-stress workflow, Python-based post-processing, and the KCI/JCI crack-index framework. Across the manuscript, the principal response variables are the peak core temperature Tmax,core, the maximum core-to-surface temperature differential ΔTcs,max, and the minimum thermal crack index Icr,min. The principal conclusions are summarised below.
For nominally cubic foundation blocks, the surface modulus M remains useful for preliminary massivity screening; however, the updated mixed-geometry dataset indicates that M alone is not an adequate predictor of crack-index response. Within the present dataset and modelling assumptions, the adopted response-specific relations are Tmax,core = 50.653 + 7.110dmin − 0.774dmin2 (R2 = 0.940), ΔTcs,max = 3.000 + 3.824M + 5.559dmin (R2 = 0.869), and Icr,min = −1.253 + 77.323/ΔTcs,max (R2 = 0.951).
Across slabs, columns, and pile caps, the same M value can produce markedly different crack-index responses because the realised core-to-surface temperature differential depends on both heat-flow dimension and restraint configuration. For example, G4 and G6 both have M = 1.00 m−1, yet Icr,min changes from 1.095 to 2.553. Non-cubic elements therefore require explicit shape-aware three-dimensional thermal-stress assessment.
The seven-node ΔTcs,max post-processing procedure is essential for identifying the governing thermal differential. For the 3 × 3 × 3 m reference cube, the critical node pair is the core node N295 and the corner-top node N580 at approximately 86 h, yielding ΔTcs,max = 26.17 °C.
Among the controllable construction parameters, placement temperature and cement content dominate Tmax and the associated DEF risk, whereas convection and geometry dominate ΔTcs,max and Icr,min. Increasing hc from 1.5 to 12 kcal m−2 h−1 °C−1 reduces Tmax only slightly but increases ΔTcs,max from 16.55 to 31.03 °C and lowers Icr,min from 2.47 to 1.54, confirming that surface insulation is a primary crack-control measure.
The 250 mm reference mesh is acceptable for comparative screening, but Icr,min remains sensitive to refinement down to 150 mm; final design checks near the Icr = 1.2 or 1.5 limits should therefore use a finer mesh or a documented convergence correction.
The proposed MIDAS Civil–Python workflow provides a reproducible framework for screening thermal performance in tropical mass-concrete foundations. Nevertheless, broader geometric coverage, local material calibration, and field validation are still required before the regression equations can be used confidently as stand-alone design tools.
Acknowledgements
This research was funded by the Ministry of Education and Training, Vietnam, under grant number B2024-XDA-10.
Notes
[1] Contributed by Author Contributions
T.-T.P. developed the methodology, conducted the investigation, performed the formal analysis, and drafted the manuscript. N.-T.T. conducted the investigation, analysed the data, contributed to visualization, and reviewed and edited the manuscript. C-C.V. contributed to the study design, supervised the project, participated in the investigation, and reviewed and edited the manuscript. H.-H.T. contributed to methodology, supported the validation, and reviewed and edited the manuscript. H.-H.L. administered and supervised the project and reviewed the manuscript. All authors critically reviewed and approved the final version of the manuscript and agreed to be accountable for all aspects of the work.
[2] Disclosure of Interest
The authors declare that they have no known competing financial interests or personal relationships that could have appeared to influence the work reported in this paper.
The authors further declare that this manuscript has not been published elsewhere and is not under consideration by another journal in substantially the same form. Any overlap with related work by the authors is limited to properly cited background material and does not duplicate the present dataset, tables or figures.