

1. Introduction
Flat slab systems are a very common built form in contemporary construction, offering architectural freedom, lower storey height and easily executable formwork. However, their structural performance is frequently controlled by punching shear resistance at slab-column connections, which is a brittle failure mechanism that needs to be carefully appraised, especially in existing structures experiencing higher loads or changes in function. As a result, strengthening methods have been widely investigated, and three common ones proved to be effective: (i) enlarging the area of the column support zone (Ebead & Marzouk, 2002; Taresh et al., 2021), (ii) adding flexural reinforcement (bonded externally systems such as CFRP (Silva et al., 2021; Ghayeb et al., 2023)), or (iii) introducing post-installed shear reinforcement (Adetifa & Polak, 2005; Navarro et al., 2020).
These strengthening strategies are based on the punching shear reinforcements available for new slabs. These approaches include stirrups (de Oliveira, et al., 2022; Siqueira & Melo, 2023), shear studs (Mohammed et al., 2024; Maués et al., 2025) and shear heads (Jiang et al., 2024). Due to their ease of installation and superior performance in enhancing the flexibility and load-bearing capacity of slabs, shear bolts are now preferred beyond traditional applications for retrofitting existing flat slabs. Prior experimental and numerical studies demonstrated how shear bolts increased punching shear resistance, in particular if a sufficient fastening tool is used.
Slab openings for plumbing, ventilation, and fire protection, should be designed before construction (Ravindra et al., 2017; Mahlis et al., 2018). Openings near columns in flat slab systems reduce concrete volume and may cut main reinforcing bars, increasing punching shear failure risk due to high compression and tension stress concentrations (Taresh et al., 2025). Studies into the shear performance of perforated flat slabs date back over 60 years (Elstner & Hognestad, 1956), but construction technology has spurred more research. Number, location, distribution, and distance of openings from the column negatively affect punching shear strength in such slabs. It has been shown that increasing the equally sized openings is detrimental to shear strength (Ha et al., 2015) and more so if they have a greater dimension than the column (Anil et al. 2014; Oukaili et al., 2014) or are located closer to the column (Genikomsou & Polak, 2017). Openings at the corners reduce shear strength more than those at column faces (Yousef et al., 2019).
However, most existing studies focus solely on strengthening flat slabs without any openings. Meanwhile, the strategies for strengthening implicitly assume continuity of strengthening elements around the column. For example, enlargement-based strengthening methods require having the column entirely enveloped with strengthening elements, whereas strengthening strategies based on enhancing flexural rein-forcing bars (like using CFRP sheets) necessitate continuous force transfer paths. The existence of openings surrounding columns complicates fulfilling the continuity condition and stress transfer paths. In contrast, shear bolts offer flexibility in implementation and help avoid continuity issues. As of today, limited research has addressed the behaviour of flat slabs with openings and externally post-installed shear reinforcements (Adetifa & Polak, 2005). Although post-installed shear reinforcement may seem like a potentially more flexible approach to be installed in many configurations around the column (e.g., along column faces or at corners), its performance has not been adequately assessed, particularly in the presence of slab openings.
Furthermore, limited studies have rigorously examined the interaction between slab openings and post-installed shear reinforcement using nonlinear finite element modelling techniques. Thus, the main aim of this study is to understand the behaviour of flat slabs with openings near column areas that are strengthened using post-installed shear reinforcement. This study uses a numerical approach with the finite element models of flat slabs that are validated in previous literature. Openings with different sizes and arrangements are introduced near the column region, and the post-installed shear reinforcement is distributed over these openings. The objectives of this study are (i) to determine the impact of opening location and size on punching shear capacity, (ii) to evaluate the capability of various arrangements of post-installed shear reinforcement in minimising strength loss, and (iii) to offer design-oriented principles and procedures for enhancing perforated slab-column connections with shear bolts. These findings are anticipated to help fill the existing knowledge gap to enhance the reliability of strengthening guidelines for flat slabs with openings.
2. Methodology
2.1. Description of Test Specimens
The present study is based on previously tested reinforced concrete flat slab specimens by (Inácio et al., 2012), denoted as M8 and M8S, which were adopted by (Amer et al., 2025) as reference slabs for validation of the developed finite element models (FEM). These specimens represent typical interior slab-column connections and consist of square slabs supported on their edges with side dimensions of 1800 mm and 120 mm depth, represent the region within two contraflexure lines for a typical flat slab system. These specimens were selected to ensure that data on load-deflection responses, failure modes and crack patterns is available. Both were reinforced using eight shear bolt lines radially spaced around the column, each line consisting of two 75 mm spaced shear bolts. The main difference is how they are strengthened. Specimen M8S incorporates two 8 mm in diameter shear bolts with small end anchorages, while Specimen M8 has large end anchorages. The bolts’ ends in slab M8S are directly attached to slab surfaces through their washers, while bolts’ ends of slab M8 are attached to slab surfaces through a 150 mm × 50 mm anchorage steel plate accommodating two bolts. Figure 1 illustrate the strengthening technique and end anchorage details. All specimens were loaded from the top centrally with monotonic static loading until failure using a hydraulic jack placed underneath the slab by means of a square steel plate of 200 × 200 mm and 50 mm thick. The details of these slabs are listed in Table. 1. Details of support and test geometry are shown in Figure 2.
Table 1:
Details of tested slabs (Adopted from (Inácio et al., 2012))
| Specimen | M8 | M8S | |
|---|---|---|---|
| Anchorage type | Large (L) | Small (S) | |
| Bolt Diameter | 8 mm | 8 mm | |
| f′c (MPa) | 50.66 | 41.14 | |
| f′t (MPa) | 2.35 | 2.11 | |
| Ec (GPa) | 39.14 | 35.27 | |
| Top tension rein. | Ø 10 mm @ 75 mm | ||
| Bottom Compression rein. | Ø 6 mm @ 200 mm | ||
| Flexural reinforcement ratio | 1.124 % | ||
| Effective depth | 91 mm | ||
| Bolt properties | f0.2 (MPa) | 523 | 587 |
| Ew (MPa) | 200000 | 217000 | |
| Ø 10 mm | fy/f0.2 (MPa) | 467 | |
| ft (MPa) | 597 | ||
| Ø 6 mm | fy/f0.2 (MPa) | 586 | |
| ft (MPa) | 696 | ||
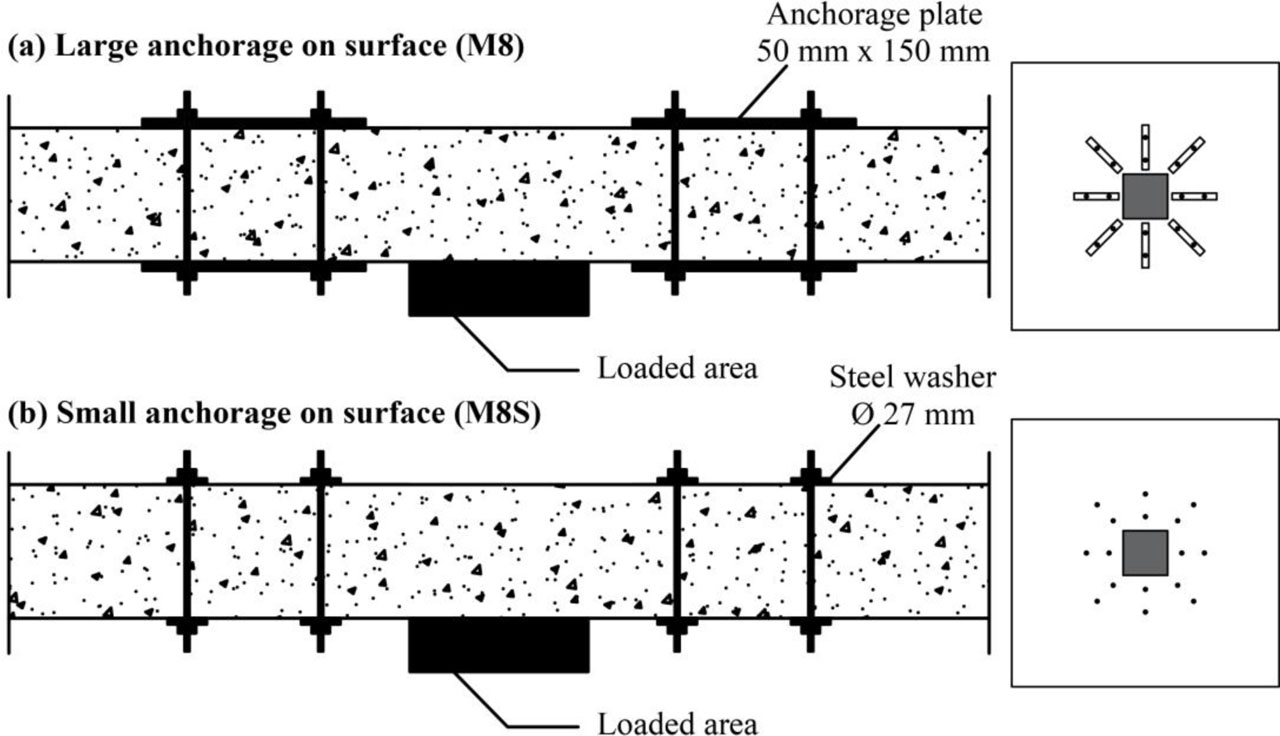
Figure 1:
Kinds of terminal anchorages of shear bolts (Adopted from (Inácio et al., 2012))
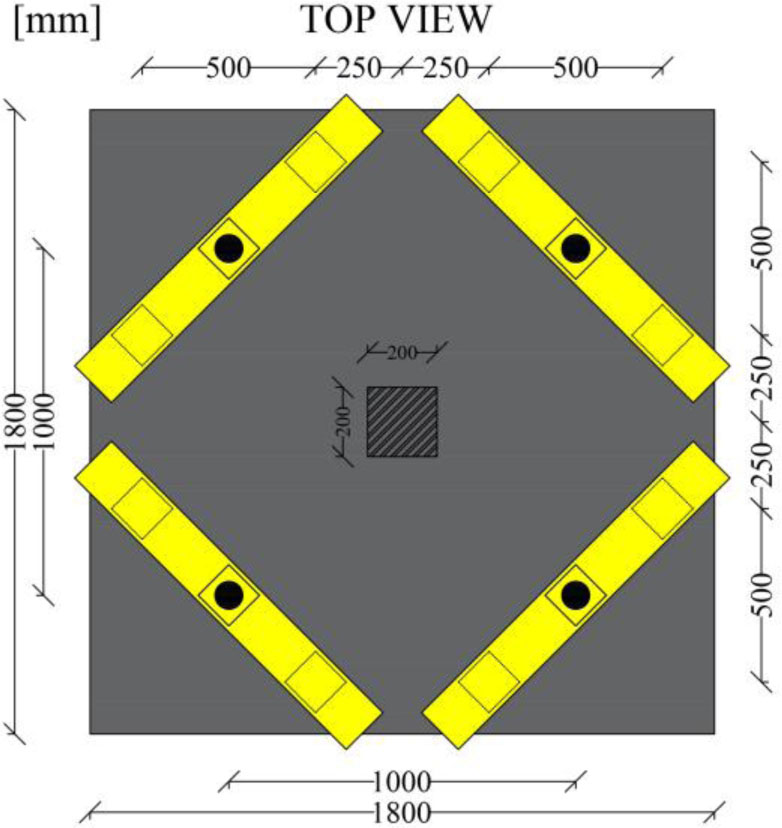
Figure 2:
Geometry and support details of tested slabs (Adopted from (Inácio et al., 2012))
2.2. Model Verification
The reference slabs M8 and M8s were numerically modelled and analysed by (Amer et al., 2025) using concrete damaged plasticity (CDP) in ABAQUS software with a detailed finite element modelling. In the verification phase, the numerical results were compared with the experimental data of specimens M8 and M8S for load-deflection response, crack patterns and failure mechanism. The numerical representation of the tested slabs was made with a mesh size of 20 mm, which was established as the optimum choice.
The concrete was modelled utilising 8-node hexahedral brick elements (C3D8R) with lower integration (Amer et al., 2025; Taresh et al., 2021; Taresh et al., 2021; Ali et al., 2022; Taresh et al., 2025). The concrete's response to compression was modelled using the Hognestad parabola. While the stress-crack displacement relationship was used to represent concrete tension response. The tensile response was characterised by a bilinear tension-softening response, requiring essential concrete parameters (fracture energy Gf and maximum tensile strength f′t). The fracture energy (Gf) was obtained according to CEB-FIP Model Code 1990, as Gf = Gf0 (fcm / fcm0)0.7, where Gf0 is the base fracture energy and fcm0 = 10 MPa. The reinforcing bars were simulated using truss elements (T3D2). While shear bolts were modelled using beam element type (B32). Their plastic behaviour (reinforcing bars and shear bolts) was delineated by a table that encompassed yield stress and the associated plastic strain. The embedding method was employed to simulate the interaction between concrete and all of the beam and truss elements. The tie constraint was employed to define the interaction between any contacted surfaces (loading plate, anchorage plate, nuts, and concrete). Given that all slabs possess identical shapes, a quarter of each was selected for investigation.
The test slabs were carefully analysed using quasistatic analysis with the capabilities of advanced software ABAQUS. Thus, each slab model was subjected to a constant-rate displacement (at 20 mm/s), while following a gradual (from 0 to 40 mm/s) and continuous amplitude curve for the velocity. It should be noted that the reported loading velocity (20 mm/s) corresponds to the displacement-controlled loading applied in the ABAQUS/Explicit analysis and does not represent a physical experimental loading rate. It is worth noting that the slab models were constrained at their lateral boundaries so that there were no vertical movement or displacements along those edges. To come up with this, Figure 3 provides a detailed overview illustrating the baseline geometry and boundary conditions used in the slab models considered in the simulations. The vertical deflection Δ of the slab was recorded at the centre of each slab. Detailed information about finite element modelling (FEM) can be found in (Amer et al., 2025).
The numerical models were in excellent compatibility with the experimental outcomes. The ultimate loads predicted were shown to correlate very strongly with the test results, with differences being within acceptable bounds. In addition, failure modes achieved from numerical assessment were found to be agree with experiments in punching shear failure aspect. Figure 3 shows, load-deflection curves of tested reference slabs and the associated finite element models Figure 4. illustrates the standard FEM geometry and BCs for use with slab models.
Overall, the verification confirms the reliability of the developed numerical models, enabling their use in the subsequent parametric study involving flat slabs with openings and different shear bolt configurations, without the need for extensive additional experimental testing.
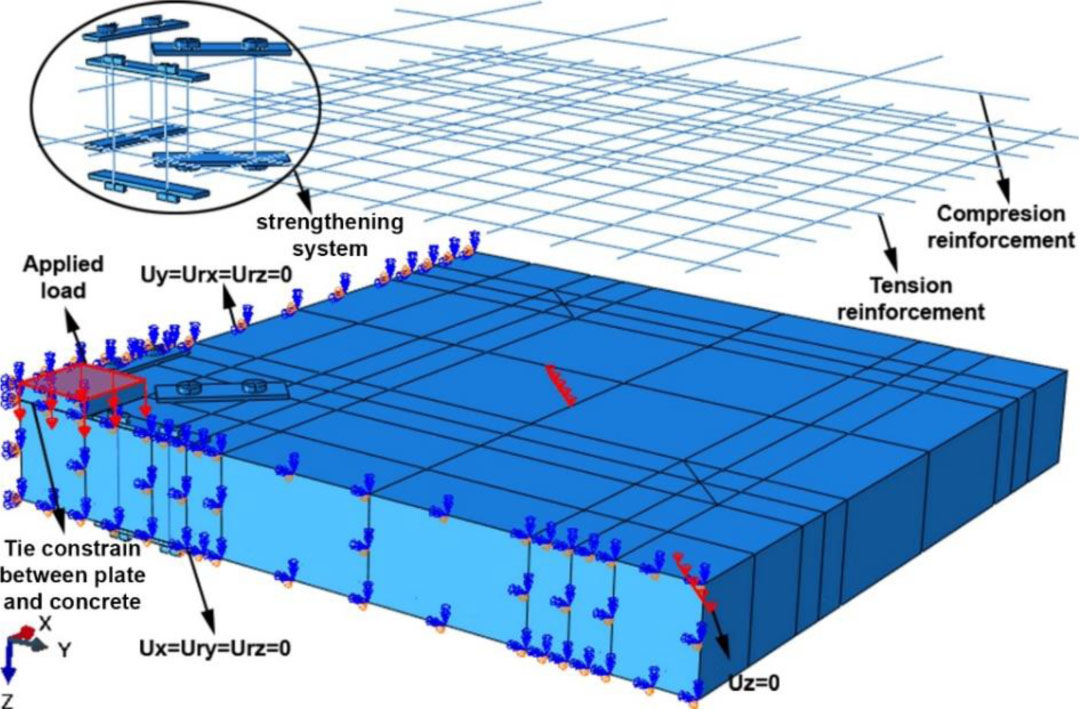
Figure 3:
Geometry details of slab model (M8) (Amer et al., 2025)
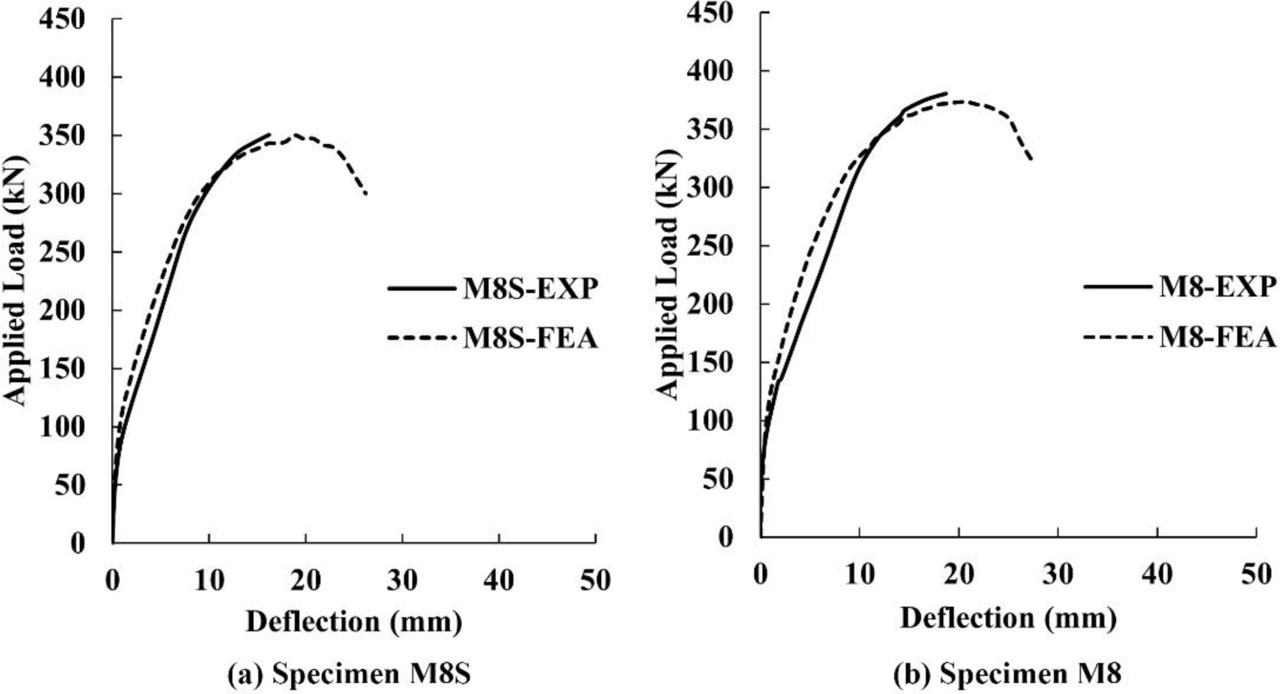
Figure 4:
Load-deflection response of reference slabs and their corresponding finite element models (Amer et al., 2025)
2.3. Parametric Study
The geometric configuration adopted in this study is derived from the slab-column connections that were numerically validated previously for solid flat slabs. All specimens have the same general dimensions, reinforcement details, and boundary conditions to provide uniformity for valid comparison.
The effect of introducing slab openings near the column region in punching shear behaviour is studied by means of a series of perforations around the column zone. The openings were square and located at the edges and corners of the column, where shear stresses are maximum. The setups were intended to provide realistic situations that would require service openings for mechanical and electrical installations.
Parametric study is conducted to investigate the influence of opening size and position on the punching capacity of slabs. Figure 5 illustrates the seventeen slabs analysed in the parametric study, featuring small, medium, and large opening sizes with dimensions: 75 × 75 mm, 100 × 100 mm, and 150 × 150 mm, respectively. These dimensions were selected to be less than the column size to i) achieve sufficient flexural capacity of the slabs ii) sustaining sufficient flexural reinforcement iii) achieving realistic slab behaviour. To re-establish the advantage of symmetry, one quarter of the slabs are utilised, each featuring either two symmetric openings at the column face or four openings at the column corners. These openings are regarded as a worst-case scenario for assessing their impact on the punching capacity of strengthened flat slabs with shear bolts. The considered models were grouped into four groups based on the opening size, anchorage type, and geometric configuration, as shown in Figure 5.
Group 1 (LS series) includes six slabs that are shear-strengthened with shear bolts with large end anchorages and two small-sized openings of 75 × 75 mm located at the opposite sides of each column. Group 2 (LL series) involves six slabs that are strengthened with shear bolts with large end anchorages and two large-sized openings of 150 × 150 mm located at the opposite sides of each column. Group 3 (SM series) involves four slabs that are shear-enhanced by shear bolts with small end anchorages and medium-sized openings of 100 × 100 mm located at the opposite sides of each column, as well. Group 4 (LMC series) includes two slabs that are strengthened with shear bolts featuring large end anchorages and four medium-sized openings of 100 × 100 mm located at the corners of each column. Table 2 lists details of all the parametric slab models.
The slab model M8 was used for parametric groups 1, 2, and 4. While the Slab model M8S was specifically used for parametric group 3. Each group includes one reference slab that is with similar perforations and without any shear reinforcements for comparison purposes.
For each group, several layouts were evaluated by changing the quantity, size, and distribution of openings around the column. These configurations were chosen, as they provide opportunities to represent a range of disturbance levels to the shear perimeter and test whether openings interacted with shear bolt arrangements. Spacing between shear bolts was held constant (75 mm). This systematic alteration made in size, position and layout of openings allows for a full assessment for the joint contribution of slab perforations and anchorage arrangement to structural performance of strengthened flat slabs.
The shear force associated with flexural capacity (Vflex,max) of the solid reference slabs (M8 and M8S), can be calculated by the yield-line method for a uniformly reinforced slab, as given in Equations (1 and 2) (Guandalini et al., 2009). For simplicity and to avoid the complexity, the shear force associated with flexural capacity (Vflex,min) of perforated slab models has been approximately estimated by using the same equations through considering the flexural reinforcement after perforation (ρres).
Where:mR – nominal moment capacity per unit width,
B – side dimension of test specimen,
C – side dimension of column,
rq – radius of load introduction at perimeter,
f′c – specified compressive strength of concrete (cylinder),
fy – yield strength of reinforcement,
ρ – flexural reinforcement ratio,
d – slab effective depth.
Table 2:
Details of all slab models
| Group | Slab model | Anchorage type | Opening size [mm] | f′c [MPa] | ρ [%] |
|---|---|---|---|---|---|
| Reference perforated slabs | LS | - | 75 × 75 | 50.66 | 0.95 |
| LL | - | 150 × 150 | 50.66 | 0.78 | |
| SM | - | 100 × 100 | 41.14 | 0.78 | |
| LMC | - | 100 × 100 | 50.66 | 0.78 | |
| Group 1 | LS-1 | Large | 75 × 75 | 50.66 | 0.95 |
| LS-2 | Large | 75 × 75 | 50.66 | 0.95 | |
| LS-3 | Large | 75 × 75 | 50.66 | 0.95 | |
| LS-4 | Large | 75 × 75 | 50.66 | 0.95 | |
| LS-5 | Large | 75 × 75 | 50.66 | 0.95 | |
| LS-6 | Large | 75 × 75 | 50.66 | 0.95 | |
| Group 2 | LL-1 | Large | 150 × 150 | 50.66 | 0.78 |
| LL-2 | Large | 150 × 150 | 50.66 | 0.78 | |
| LL-3 | Large | 150 × 150 | 50.66 | 0.78 | |
| LL-4 | Large | 150 × 150 | 50.66 | 0.78 | |
| LL-5 | Large | 150 × 150 | 50.66 | 0.78 | |
| LL-6 | Large | 150 × 150 | 50.66 | 0.78 | |
| Group 3 | SM-1 | Small | 100 × 100 | 41.14 | 0.78 |
| SM-2 | Small | 100 × 100 | 41.14 | 0.78 | |
| SM-3 | Small | 100 × 100 | 41.14 | 0.78 | |
| SM-4 | Small | 100 × 100 | 41.14 | 0.78 | |
| Group 4 | LMC-1 | Large | 100 × 100 | 50.66 | 0.78 |
| LMC-2 | Large | 100 × 100 | 50.66 | 0.78 |
3. Results and Discussions
3.1. Ultimate Shear Strength
As a sole part of parametric studies, finite element analysis was executed to examine the ultimate load behaviour of the strengthened flat slabs, especially in terms of shear capacity, central deflection, and crack patterns on tension surfaces. The numerical results indicated that the shear bolts with large end anchorages significantly increased the punching shear resistance of the strengthened slab models with openings of size 75 × 75 mm in Group 1 by an average 42% compared to the corresponding reference slab model LS. The slab model LS-4 recorded the highest resistance increase, about 50%, followed by the slab models LS-1 and LS-6 achieving a 45% increase. While the other arrangements of shear bolts showed satisfactory enhancements, the slab model LS-3 recorded less resistance. The reason for this outcome is dependent on the proper selection shear bolts arrangement. The suitable arrangement of shear bolts provided enough confining pressure and more support to the additional flexural bars around the openings. Load-deflection curves for parametric slab models of Group 1 are shown in Figure 6.
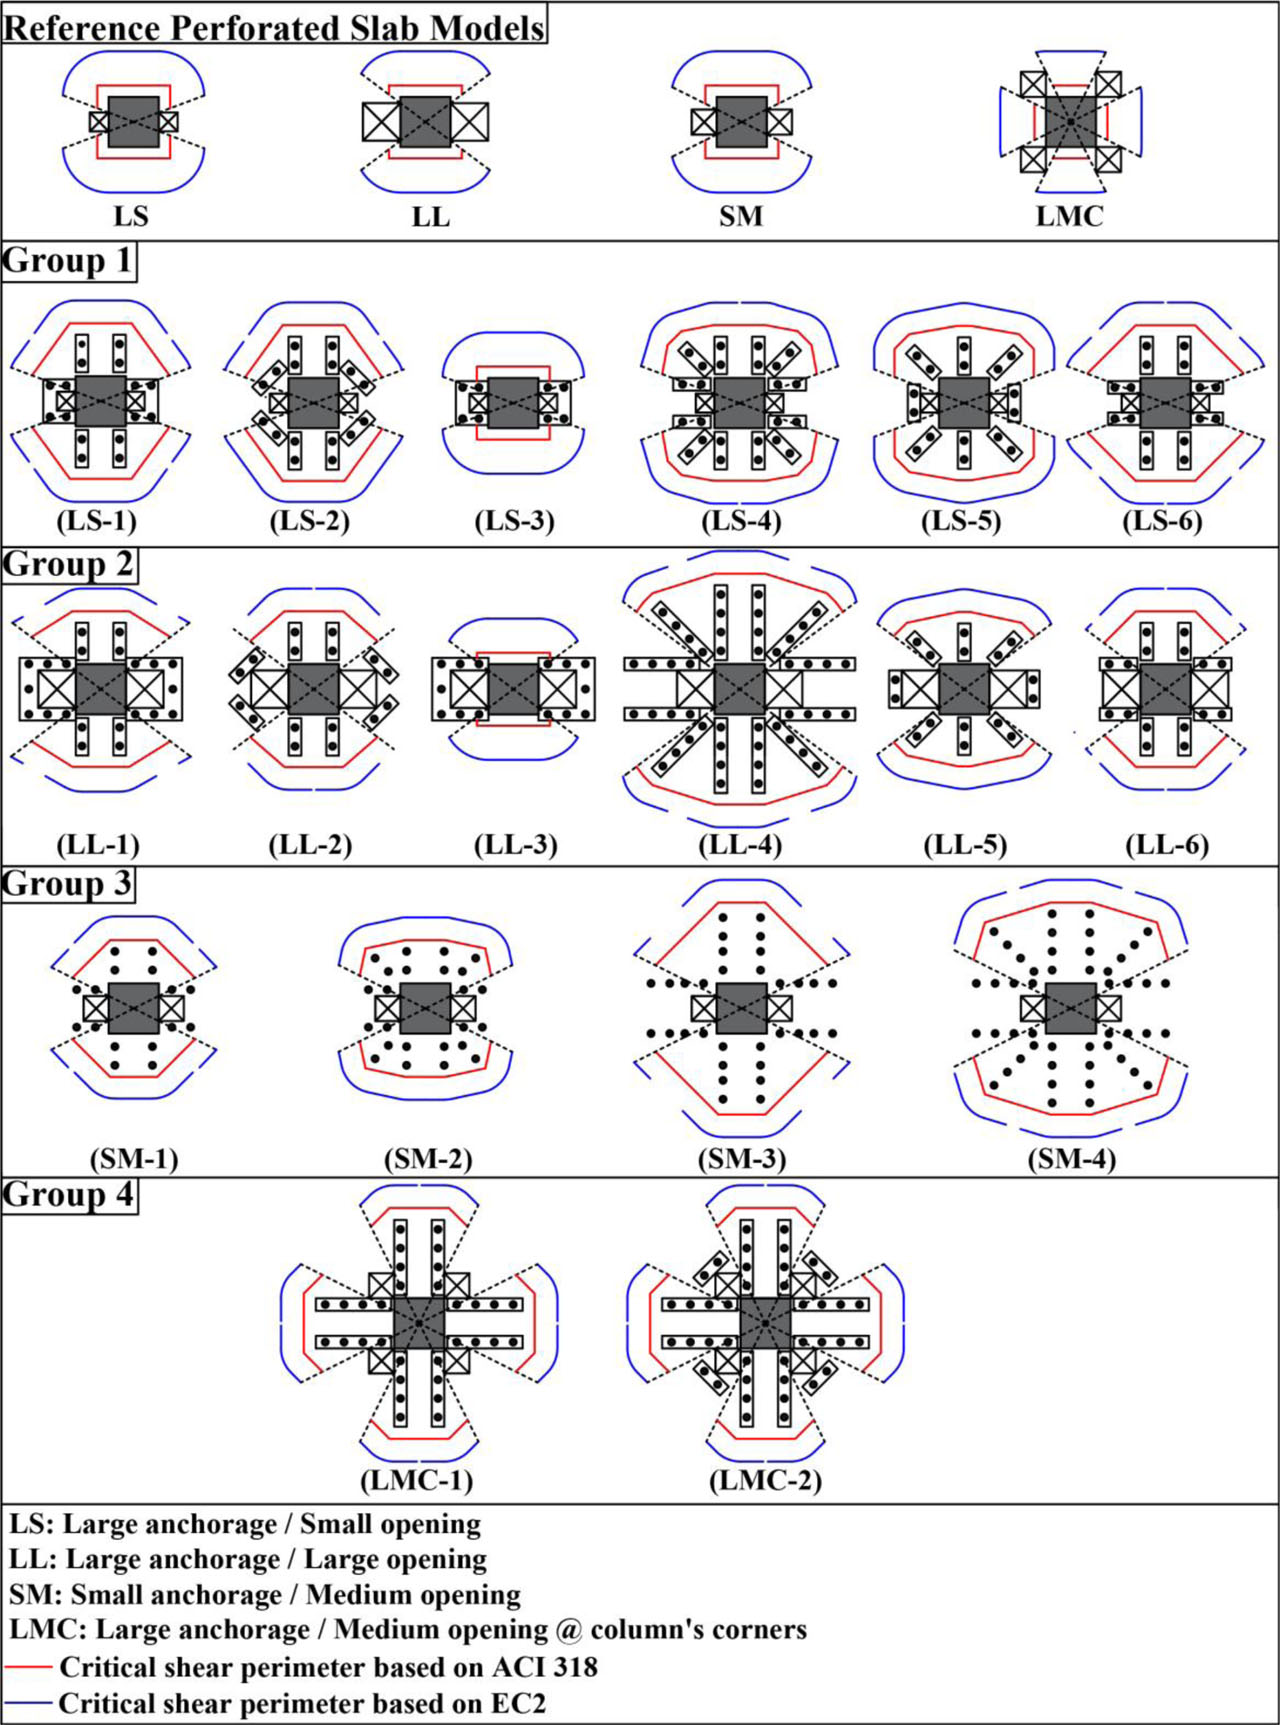
Figure 5:
Patterns of openings in parametric slab models
For the same reason, the slab model LL-4 in Group 2 exhibited the highest punching increment at roughly 91%, surpassing the slab model LL-1, which showed an increment of about 85% (refer to Figure 7). Although other strengthened slab models demonstrated a significant increase in punching strength, they were less effective than slabs LL-2 and LL-5 in terms of ultimate load capacity and deflection. However, the strengthened slab models in this group demonstrated an average increase in punching capacity of approximately 56% compared to their corresponding reference slab model LL.
The strengthened slab model SM-4 in Group 3 showed relatively comparable performance to other strengthened slabs and an increase in punching capacity of about 73% in comparison to control slab SM. However, the average strength increase of all strengthened slab models was 61% in comparison to the control slab SM (refer to Figure 8). Meanwhile, the shear bolts arrangements for strengthened slab models in Group 4 (openings at column corners) provided an average increase in punching capacity about 67% compared to the control slab LMC (refer to Figure 9).
In general, it can be decisively concluded that the radial arrangement of shear bolts, as seen in slab models LS-4, LL-4, and SM-4, is the best and most efficient solution to enhance punching shear strength in flat slabs with openings. This arrangement significantly increases the confinement pressure on the concrete located between the terminal anchorages of the shear bolts and provides better support for the flexural reinforcement surrounding the column. The radial distribution of shear bolts ensures a large and close bond area with the slab surfaces, which increases the critical shear section around the column, where flexural and shear stresses are at their highest values, and activates flexural reinforcement more efficiently than in orthogonal placement.
The analysis outcomes showed that the flexural reinforcement was fully utilized at failure. The shear bolts, terminal anchorage type, and additional reinforcement around the openings significantly enhance the flexural capacity of strengthened flat slabs. However, the first shear bolt close to the column recorded higher stress levels (≥ fy) than the subsequent shear bolts for all slab models. The first row of bolts endures greater stress than the following rows because of the shear cracks and openings located near the column. Generally, the shear bolts of all slabs commenced engagement at loads exceeding the ultimate load of the reference specimens.
Slab ductility is quantified as the ratio of failure displacement to yield displacement (δmax/δy), with the yield load defined as 75% of the failure load. Table 4 indicates that strengthened slab models have up to an average of 52%, 25%, 39%, and 68% more ductility in Group 1, Group 2, Group 3, and Group 4 compared to control slab models, respectively. Moreover, energy absorption markedly rises, with strengthened slab models exhibiting an average increase of 327%, 416%, 558%, and 674% in Group 1, Group 2, Group 3, and Group 4 compared to control slab models. Table 4 lists energy absorption for all parametric slab models.
The numerical results generally show that the efficiency of post-installed shear bolts in perforated flat slabs depends not only on the amount of inserted shear bolts, but also on the compatibility between the opening configuration and the reinforcement layout. Radial arrangements supplied more uniform stress redistribution around column region and delayed punching failure more effectively than orthogonal configurations.
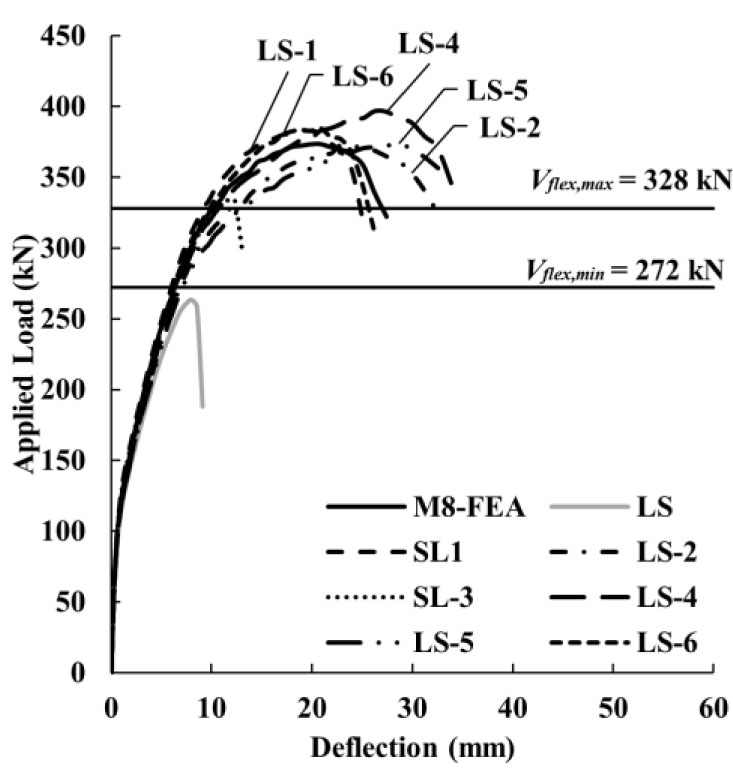
Figure 6:
Load-deflection responses of parametric slab models of Group 1
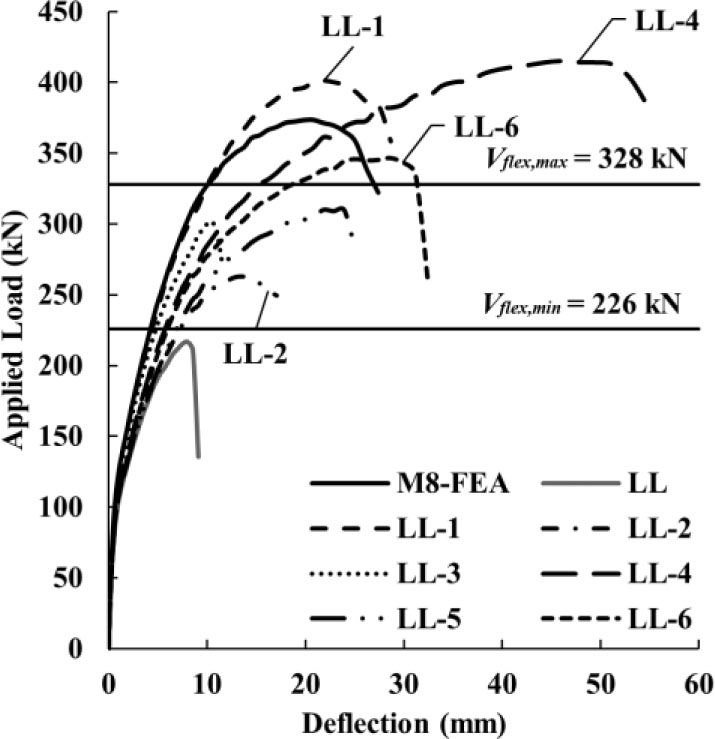
Figure 7:
Load-deflection responses of parametric slab models of Group 2
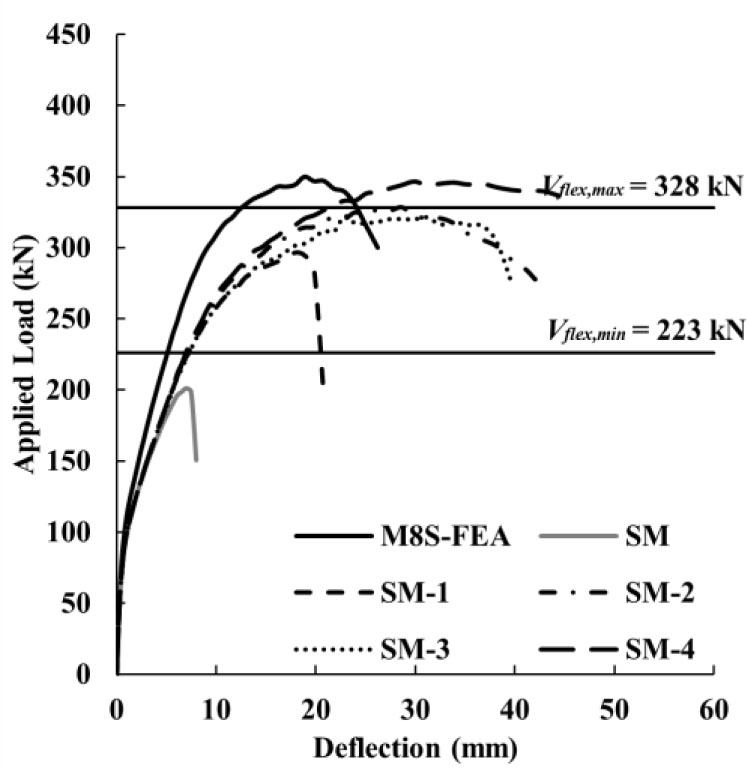
Figure 8:
Load-deflection responses of parametric slab models of Group 3
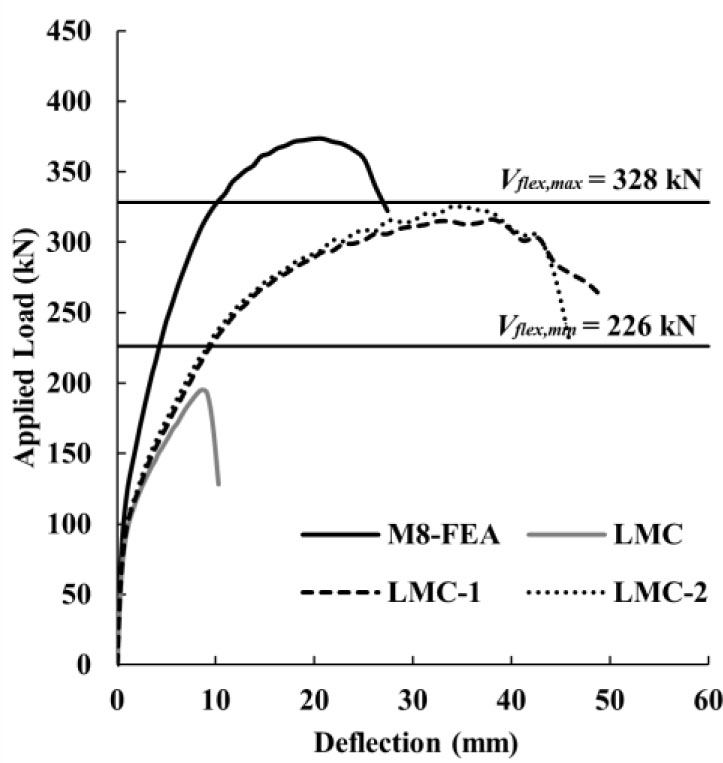
Figure 9:
Load-deflection responses of parametric slab models of Group 4
3.2. Failure Mode
All the parametric slab models displayed cracking patterns on the tension surfaces. Compared with the unstrengthened slab models, where crack patterns remained largely concentrated around the column region, the strengthened slab models developed more extensive crack patterns that propagated toward the slab edges and corners. All strengthened slab models exhibited a flexural behaviour, with punching shear occurring outside the shear-enhanced region. Except for slab models LS-3 and LL-3 experienced flexural behaviour followed by punching cone formation inside the strengthened zone. The change in failure mode to flexure is related to the increase in punching shear resistance given by the strengthening method. The large crack distribution on the tension surface is also considered a good indicator of a higher mobilisation of the flexural reinforcement, which agrees with the observations made by (Inácio et al., 2012 & Amer et al., 2025). However, the flexural behaviour was observed after the punching shear resistance of all strengthened slab models had significantly increased. The punching surface was formed outside the strengthened region, which postponed punching failure to a location farther away from the column. Therefore, this behaviour can be considered an indicator of the effectiveness and durability of the proposed strengthening strategy. Figures 10, 11, 12, 13, and 14 depict the cracked tension surface for all the parametric slab models (blue contours show the cracked regions). The maximum tensile principal stresses were adopted to identify the cracked regions on the tension surfaces of the slab models, as previously used by (Taresh et al., 2021 & Taresh et al., 2026). Importantly, the blue contours indicate regions of minimal principal tensile stresses. The blue regions shown represent severely cracked or locally spalled concrete, where the maximum tensile stress (f′t) has been largely exceeded.
Interestingly, the slab models that recorded ultimate punching strength exceeding Vflex,max have revealed an obvious formation of a punching cone outside the shear-enhanced region. While the slab models that recorded ultimate punching strength between Vflex,max and Vflex,min showed that most of the base perimeter of the punching cone formed outside the shear-enhanced region.
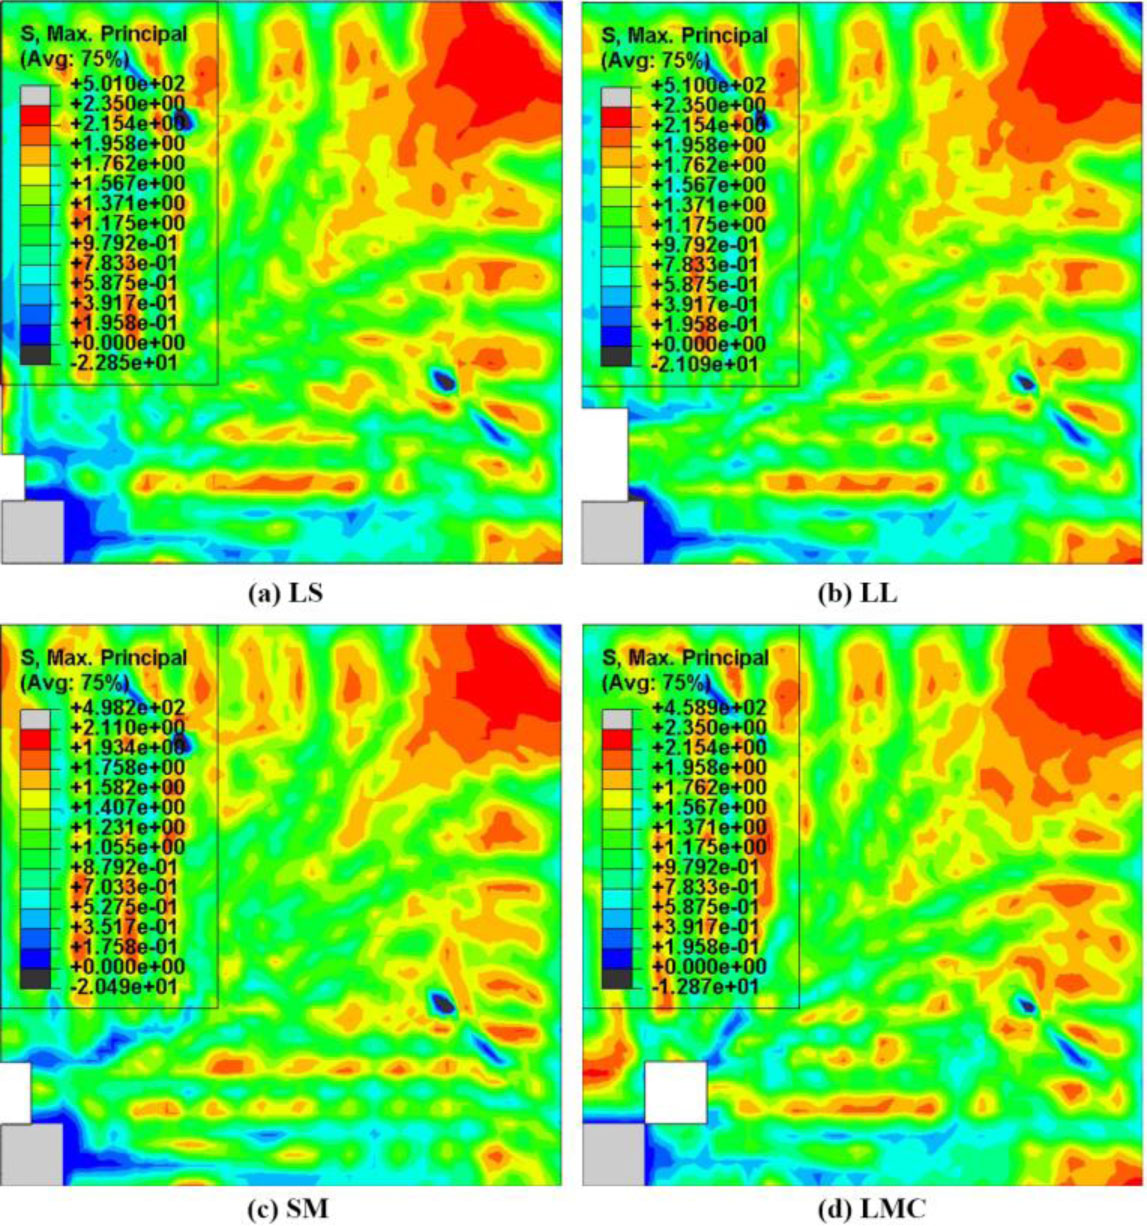
Figure 10:
Crack patterns on the tension surface of reference slab models
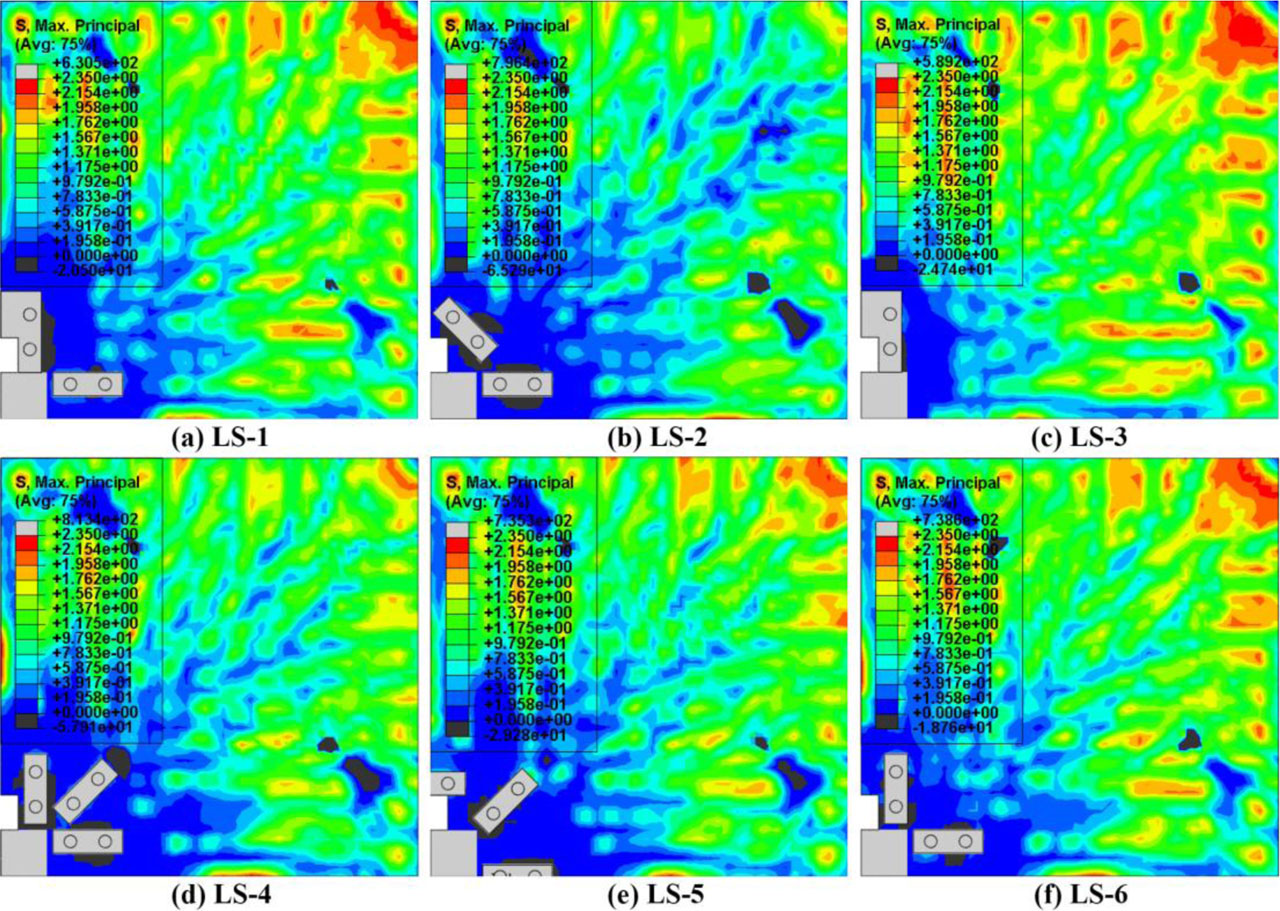
Figure 11:
Crack patterns on the tension surface of slab models in Group 1
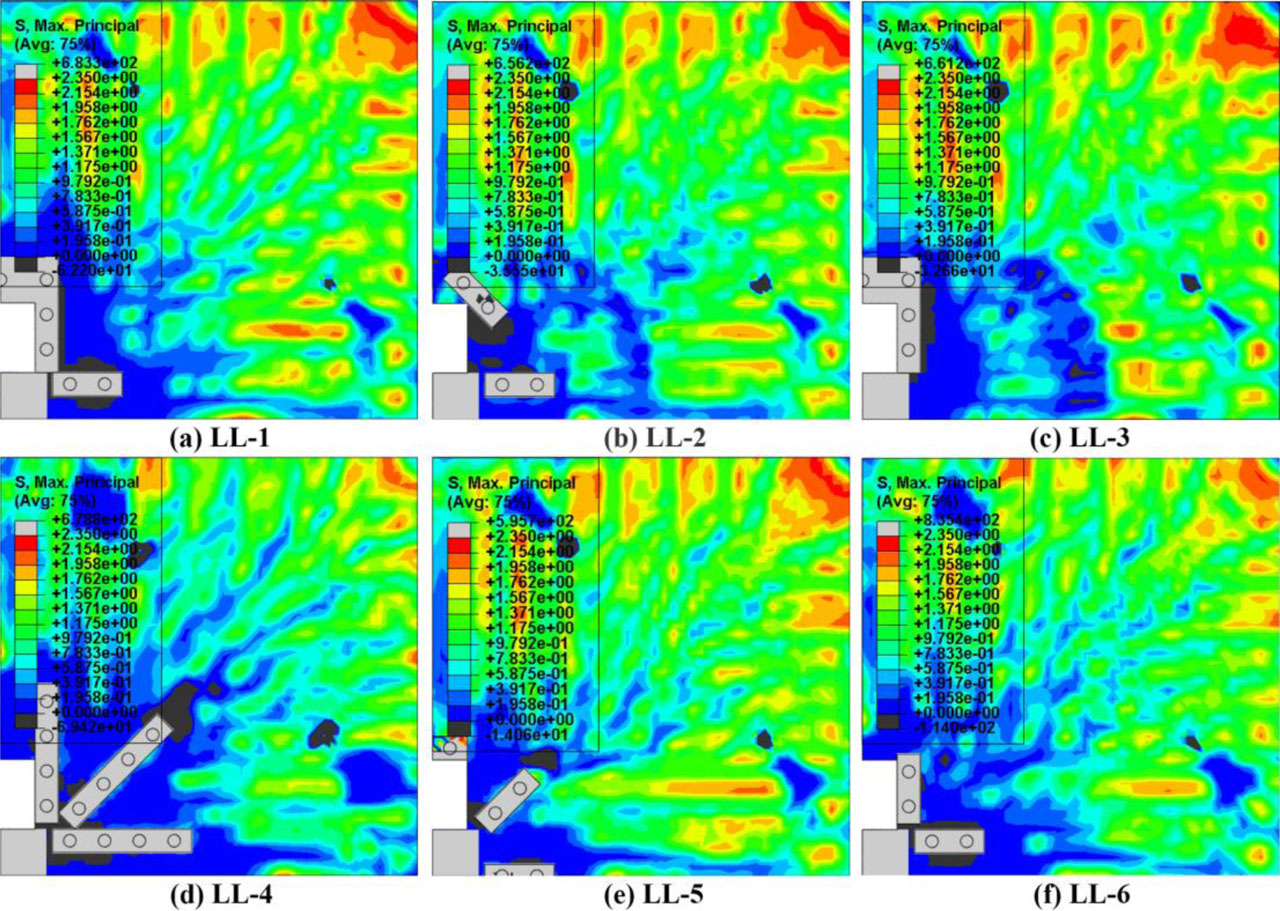
Figure 12:
Crack patterns on the tension surface of slab models in Group 2
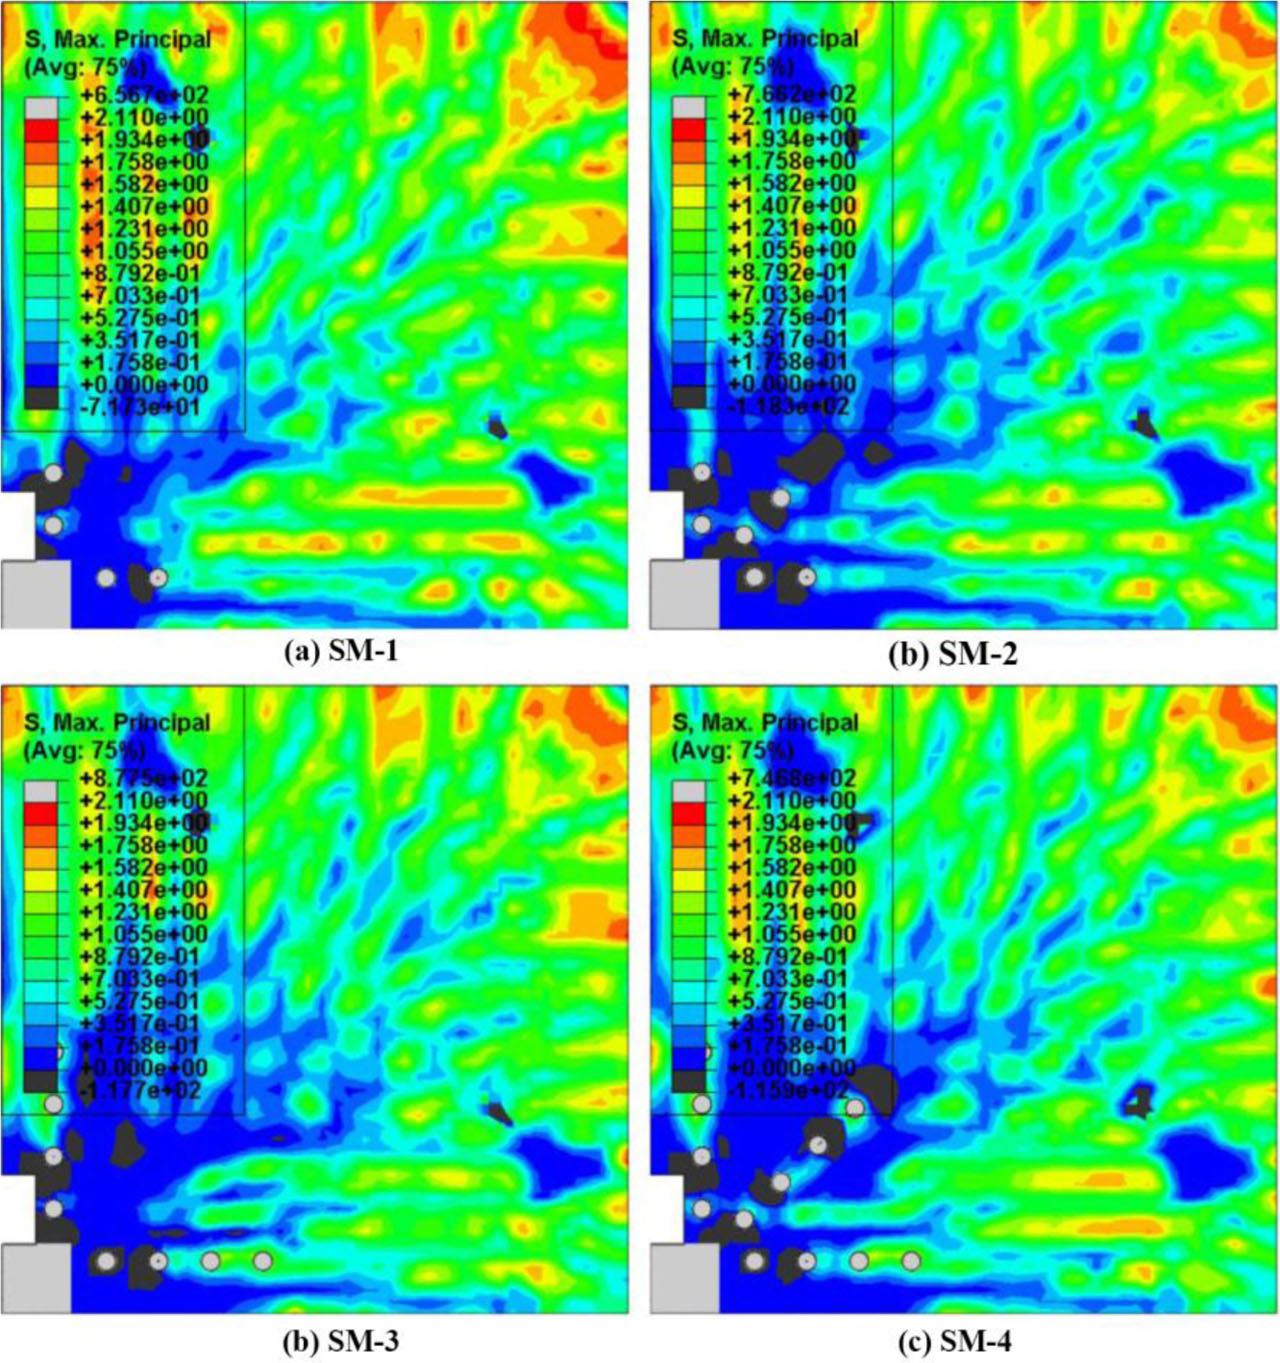
Figure 13:
Crack patterns on the tension surface of slab models in Group 3
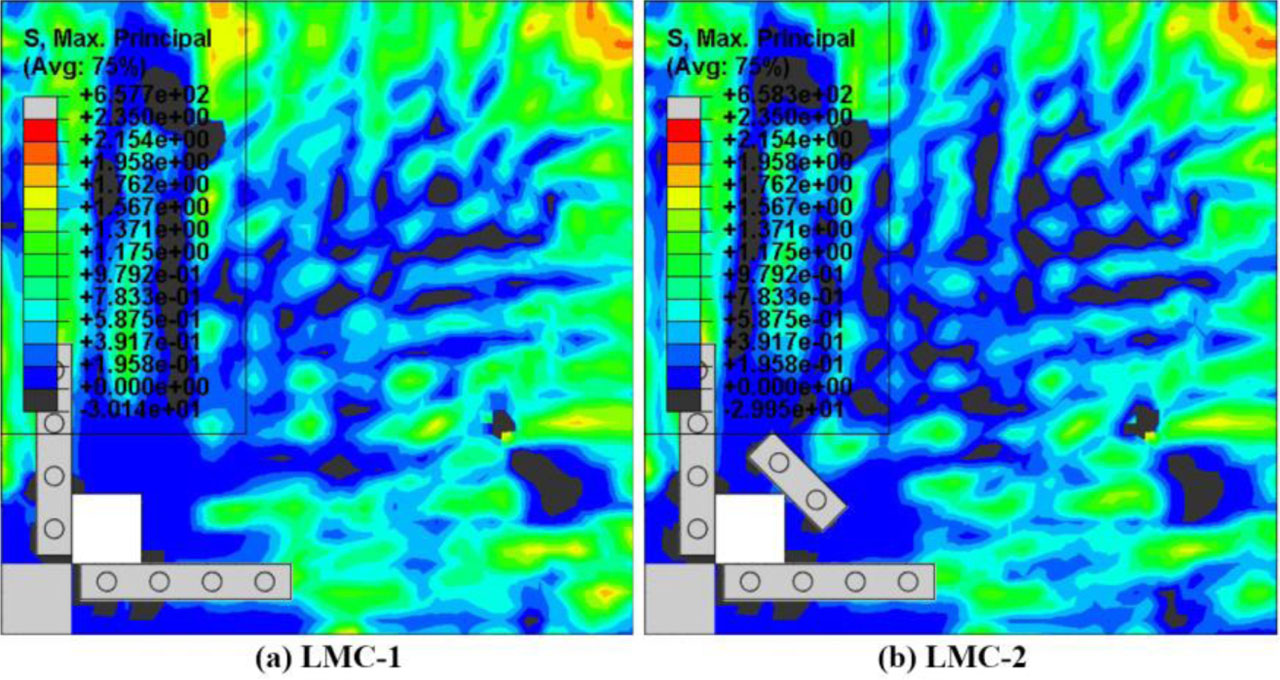
Figure 14:
Crack patterns on the tension surface of slab models in Group 4
3.3. Codes Evaluations
Structural failure of flat slabs occurs primarily via flexural or punching shear mechanisms; however, the latter happens to be critical for such slab system. Punching shear strength is estimated by properly outlining the essential region bounded by the control perimeter, which is drawn around the column to delimit the area primarily vulnerable to shear failure. For unstrengthened slabs, this control perimeter is typically located at a distance of 0.5d and 2d from the column face (where d is the effective depth of the slab) as established in ACI 318-25 and EC2-2004, respectively. The design standards ACI 318 and EC2-2004 prescribe that punching shear checks should be extended beyond this region, treating control perimeter located at 0.5d and 1.5d, respectively from the strengthened edge to assess failure zones properly.
The finite element results show that all slab models exhibited flexural behaviour associated with punching failure occurring outside the strengthened region, due to the rigid zone generated by the combined action of both shear bolts and their terminal anchorages. Thus, punching shear checks should focus on the critical section beyond the strengthened zone where such failures are presumably more likely to occur. However, it should be pointed out that this observation does not include the strengthened slab models LS-3 and LL-3, which failed within the shear-reinforced zone itself but only after these two slab models had a clear flexural response before progressing to shear failure.
Both design codes stipulate that the control perimeter is minimised in the presence of openings around the column. The effective control perimeter for all slab models was calculated according to the provisions of ACI 318-25 and EC2-2004. The effective control perimeter is limited even further by excluding the areas enclosed between the radial dashed lines (refer to Figure 5), which are drawn from the column centre to the opening's corners. Since most strengthened slab models failed in flexural mode associated with punching shear occurring beyond the strengthened zone, the control perimeter (bout) is positioned at 0.5d and 1.5d from the strengthened zone according to ACI 318-25 and EC2-2004, respectively. Except for slab models LS-3 and LL-3, the control perimeter (bo) is positioned at 0.5d and 2d from the column according to ACI 318-25 and EC2-2004, respectively, as they failed in flexural mode associated with punching shear within the strengthened zone. Figure 5 depicts the location and shape of the effective control perimeter based on the design codes for both strengthened and unstrengthened slab models. The formulae used for determining punching resistance inside and outside the retrofitted zone, according to ACI 318-25, are shown in Equations (3) and (4), respectively. The formulae for determining punching resistance inside and beyond the enhanced territory, as per the design code EC2-2004, are shown in equations (5) and (6), respectively.
Where:Vn, ACI – nominal shear strength of slab within the shear-reinforced zone
Vc, ACI – shear strength provided by concrete
Vs – shear strength provided by shear bolts
Av – area of shear bolts within the control perimeter
fyt – yield strength of shear bolts (≤ 420 MPa)
s – spacing between shear bolts
λ – modification factor of lightweight concrete (for normal weight concrete λ = 1)
λs – size effect modification factor equals (2/(1+0.004d)0.5 ≤ 1)
bo – control perimeter inside the enhanced zone
f′c – compressive strength of concrete-based cylinder test
d – effective depth of the slab
Vout, ACI – punching shear strength outside shear-reinforced zone
bout - control perimeter outside the enhanced zone
K – size effect factor
ρ – flexural reinforcement ratio
fck – characteristic compressive strength of concrete
Vn, EC2 – nominal strength of slab within the shear-reinforced zone
Ase – area of shear bolts within the control perimeter
Vse – shear strength provided by shear bolts
fyte – effective design strength of the shear bolts (fyte=1.15(250+0.25d) ≤ fyt).
Nevertheless, whether within or outside the enhanced zone, both design codes underestimate the punching shear strength, as illustrated in Table 3. Punching shear estimates were found to be conservative in both design codes.
It is worth noting that the selected anchorage plates should have an adequate thickness, recommended to be at least 5 mm for rust protection. It is preferred to adopt a radial arrangement for shear bolts as much as possible. Additionally, it is advised to extend each line of shear bolts to a distance of two to four times the slab depth to create a rigid zone around the column where shear and flexural stresses are at their highest levels.
Table 3:
Finite element analyses outcomes of parametric slab models
| Group | Slab model | Anchorage type | Opening size | VFEA [kN] | VACI [kN] | VEC2 [kN] | VACI / VFEA | VEC2 / VFEA | Failure mode |
|---|---|---|---|---|---|---|---|---|---|
| Reference perforated slabs | LS | - | 75 × 75 | 264 | 202.20 | 181.25 | 0.77 | 0.69 | Punching |
| LL | - | 150 × 150 | 217 | 155.60 | 128.99 | 0.72 | 0.59 | Punching | |
| SM | - | 100 × 100 | 201 | 168.15 | 144.50 | 0.84 | 0.72 | Punching | |
| LMC | - | 100 × 100 | 195 | 124.40 | 124.30 | 0.64 | 0.64 | Punching | |
| Group 1 | LS-1 | Large | 75 × 75 | 383 | 167.51 | 214.14 | 0.44 | 0.56 | Flexural |
| LS-2 | Large | 75 × 75 | 373 | 167.51 | 214.14 | 0.45 | 0.57 | Flexural | |
| LS-3 | Large | 75 × 75 | 334 | 254.00 Eq. 3 | 250.00 Eq. 5 | 0.76 | 0.75 | Flexural | |
| LS-4 | Large | 75 × 75 | 396 | 187.96 | 249.76 | 0.47 | 0.63 | Flexural | |
| LS-5 | Large | 75 × 75 | 374 | 183.88 | 247.62 | 0.49 | 0.66 | Flexural | |
| LS-6 | Large | 75 × 75 | 384 | 173.09 | 209.45 | 0.45 | 0.55 | Flexural | |
| Group 2 | LL-1 | Large | 150 × 150 | 401 | 135.21 | 126.76 | 0.34 | 0.32 | Flexural |
| LL-2 | Large | 150 × 150 | 271 | 132.00 | 129.08 | 0.49 | 0.48 | Flexural | |
| LL-3 | Large | 150 × 150 | 302 | 218.00Eq. 3 | 163.00Eq. 5 | 0.72 | 0.70 | Flexural | |
| LL-4 | Large | 150 × 150 | 415 | 201.39 | 256.64 | 0.49 | 0.62 | Flexural | |
| LL-5 | Large | 150 × 150 | 310 | 136.09 | 174.74 | 0.44 | 0.56 | Flexural | |
| LL-6 | Large | 150 × 150 | 353 | 131.30 | 142.94 | 0.37 | 0.40 | Flexural | |
| Group 3 | SM-1 | Small | 100 × 100 | 296 | 121.72 | 154.28 | 0.41 | 0.52 | Flexural |
| SM-2 | Small | 100 × 100 | 328 | 140.40 | 186.34 | 0.43 | 0.57 | Flexural | |
| SM-3 | Small | 100 × 100 | 320 | 138.22 | 151.75 | 0.43 | 0.47 | Flexural | |
| SM-4 | Small | 100 × 100 | 347 | 203.21 | 187.07 | 0.59 | 0.54 | Flexural | |
| Group 4 | LMC-1 | Large | 100 × 100 | 316 | 197.10 | 233.06 | 0.62 | 0.74 | Flexural |
| LMC-2 | Large | 100 × 100 | 325 | 197.10 | 233.06 | 0.61 | 0.72 | Flexural | |
| Average | 0.50 | 0.58 | |||||||
Table 4:
Deformation capacities of all parametric slab models
| Group | Slab model | Ductility | Energy absorption | Deflection at failure | Strength increase [%] |
|---|---|---|---|---|---|
| Reference perforated slabs | LS | 2.00 | 1519.13 | 8 | - |
| LL | 2.28 | 1300.63 | 8 | - | |
| SM | 2.33 | 1032.03 | 7 | - | |
| LMC | 2.16 | 1224.93 | 8 | - | |
| Group 1 | LS-1 | 3.07 | 5984.22 | 20 | 45 |
| LS-2 | 3.07 | 6694.35 | 23 | 41 | |
| LS-3 | 2.32 | 3052.21 | 12 | 27 | |
| LS-4 | 3.28 | 8209.74 | 26 | 50 | |
| LS-5 | 3.50 | 8709.45 | 29 | 42 | |
| LS-6 | 3.00 | 6267.94 | 21 | 45 | |
| Group 2 | LL-1 | 2.75 | 6719.07 | 22 | 85 |
| LL-2 | 2.56 | 3033.10 | 15 | 25 | |
| LL-3 | 2.11 | 2229.23 | 10 | 39 | |
| LL-4 | 3.54 | 15375.5 | 46 | 91 | |
| LL-5 | 2.93 | 5276.23 | 22 | 43 | |
| LL-6 | 3.20 | 7630.03 | 27 | 63 | |
| Group 3 | SM-1 | 2.68 | 4024.48 | 18 | 47 |
| SM-2 | 3.34 | 7558.56 | 29 | 63 | |
| SM-3 | 3.46 | 7403.89 | 29 | 59 | |
| SM-4 | 3.50 | 8157.59 | 30 | 73 | |
| Group 4 | LMC-1 | 3.63 | 9848.43 | 38 | 62 |
| LMC-2 | 3.63 | 9113.35 | 35 | 67 |
4. Conclusions
This research provides one of the first systematic numerical evaluations of post-installed shear bolts in perforated flat slabs, offering new insights into their structural behaviour and practical design implications. It examines the punching shear behaviour of reinforced concrete flat slabs with openings near columns by non-linear finite element modelling utilising the concrete damaged plasticity model in the ABAQUS software. These slabs are strengthened with shear bolts encompassing small and large end anchorages. It should be noted that the validated reference specimens possess an effective depth of 91 mm and a slab thickness of 120 mm, which are smaller than those of many practical flat slab systems. Consequently, the quantitative outcomes presented herein should be interpreted within the scope of the investigated geometry. Although the study provides insight into the relative effectiveness of different strengthening layouts of shear bolts, future studies should extend the validated numerical framework to thicker slab systems to evaluate the influence of size effect on punching shear behaviour and the effectiveness of post-installed shear bolt strengthening. The findings drawn in this study depend entirely on the numerical results.
The punching shear resistance of the strengthened perforated slabs has been estimated using the design codes ACI 318-25 and EC2-2004. Both design codes underestimated the punching shear capacity outside the strengthened area, and both were conservative, whether their estimations were in or out of the shear-enhanced zone.
The observed development of multiple flexural cracks on the tension surface of most of the strengthened slab models is an indication that a significant amount of overall tension reinforcing bars has been mobilised, as this was proved by the finite element outcomes. Hence, this is considered a positive sign of the robustness of the proposed strengthening technique.
The proposed strengthening method increased the shear strength capacity considerably, between 25% and 91%, compared to the unstrengthened slabs. Furthermore, the strengthened slabs demonstrated enhanced ductility, increased central deflections at failure, and markedly superior energy absorption capacity.
The strengthened perforated slabs demonstrate notable flexural performance before ultimate failure outside the shear-enhanced boundary, except for slab models LS-3 and LL-3, which failed in flexural mode linked to punching inside the strengthened zone. In contrast to the unstrengthened slab models, they failed in pure punching shear failure.
The strengthened perforated slab models revealed clear formation of punching cones outside the shear-reinforced region particularly, when the ultimate strength exceed Vflex,max. While most the cone perimeter is formed beyond the strengthened zone when the ultimate strength is between Vflex,max and Vflex,min.
Recommendations are provided regarding the thickness of anchorage plate for rust protection and arrangement of shear bolts and their extension from column boundaries to satisfy a specific equivalent condition. Future research works may extend the applications of this numerical framework to many other slabs, such as thicker slabs with openings strengthened with different flexural reinforcement ratios, and opening size or locations.
Finite element analyses outcomes revealed that radial arrangement of shear bolts with large end anchorages is the most effective in comparison to grid arrangement. The radial arrangement exhibited more punching shear resistance, denser stress redistribution, and larger crack propagation on the tension surface, indicating that slabs participated more in resisting the load.
Acknowledgments
The authors would like to extend their heartfelt thanks to the Ministry of Higher Education and Scientific Research of Iraq for their generous support, which was crucial to the successful completion of this project. Their commitment to advancing research in this field has been invaluable.